P
 Long
Long
 Long
Long
 Long
Long
 Long
Long
 Long
Long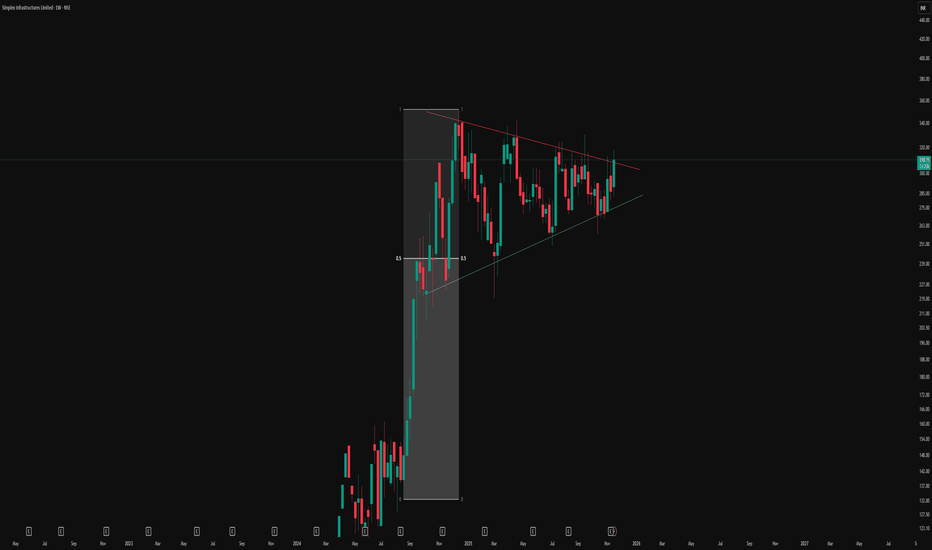
DOMS – Multi-Month Triangle Breakout |________________________________________
💹 DOMS Industries Ltd (NSE: DOMS)
Sector: Consumer & Stationery Products | CMP: 2621.70 |
View: Multi-Month Symmetrical Triangle Breakout With Expanding Momentum
________________________________________
📊 Price Action:
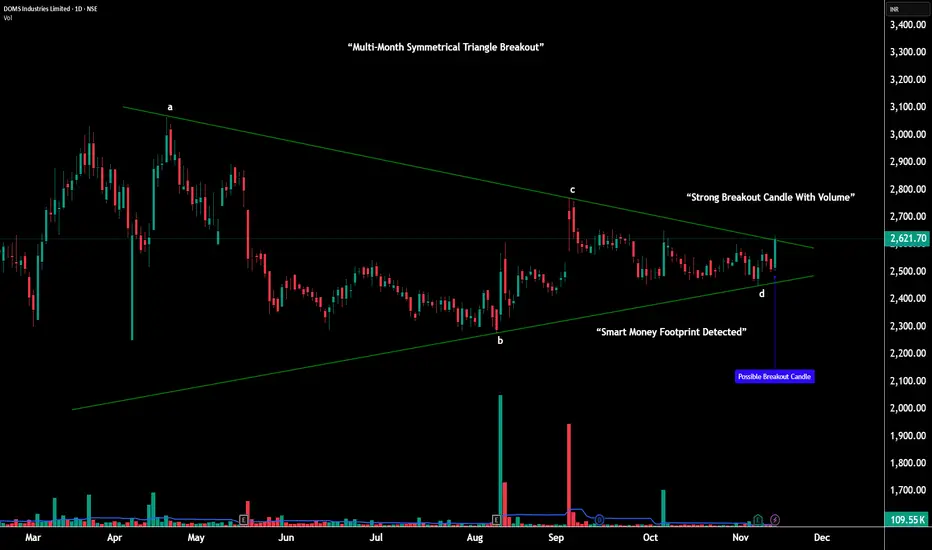
DOMS has spent the last five months forming a large symmetrical triangle — a volatility contraction structure marked by steady lower highs and higher lows from points A–B–C–D.
Throughout this period, buyers consistently defended the broader 2470–2500 demand belt, while sellers lost strength on every push lower.
This slow tightening shows how the market was preparing for a decisive move.
In the latest session, DOMS finally broke above the upper trendline, backed by a strong bullish range candle and a clear rise in volume, confirming the start of a fresh expansion phase.
________________________________________
📉 Chart Pattern Analysis – Large A–B–C–D Symmetrical Triangle:
This multi-month structure represents a major volatility compression following a previous uptrend — a classic continuation setup.
Point A: First major lower high
Point B: Deep anchor low
Point C: Lower high confirming supply weakening
Point D: Higher low showing demand strengthening
This clean A–B–C–D formation validates the symmetrical triangle perfectly.
As price approached the apex, volatility dried up, volume decreased, and the range narrowed — all ideal ingredients for a strong breakout.
The breakout candle now signals the end of compression and beginning of trend expansion.
________________________________________
📈 STWP Trading Analysis:
Bullish Breakout Zone: 2621.70 – 2633.20 | Stop Loss: 2498.60
The breakout candle shows high momentum and elevated volume, signaling institutional activity. Price has reclaimed all key moving averages with trend strength visible across 1H–1D–1W timeframes. As long as DOMS holds above the 2570–2590 structure zone, the bullish continuation bias remains active. Upside resistance levels can be used as potential levels of partial profit-taking, momentum checkpoints, and trend continuation targets.
________________________________________
🕯️ Candlestick Structure – Strong Bullish Breakout Candle:
The latest session printed a wide-range bullish candle, breaking through the upper triangle boundary decisively.
This type of candle — strong body, controlled wicks, clean range expansion — reflects conviction buying, not speculative spikes.
When this appears at the apex of a large compression pattern, it often marks the start of a new trending phase.
________________________________________
📏 Fibonacci Analysis:
Measured from swing low 2275.40 to swing high 2585.70:
38.2% @ 2393 → Secondary support
50% @ 2430 → Balanced support zone
61.8% @ 2467 → Strong golden zone (defended repeatedly)
The rebound from the 61.8% area aligns with the D-point of the triangle — reinforcing the structural validity and strengthening the breakout.
________________________________________
🧭 STWP Support & Resistance:
Resistances: 2667 | 2713 | 2794
Supports: 2540 | 2459 | 2413
The 2470–2500 region remains a major demand base, where the stock formed its higher lows at point D.
Immediate supply lies near 2667–2713, the first test zone after the breakout.
________________________________________
📊 STWP Volume & Technical Setup:
Volume climbed to 109.55K, significantly higher than recent averages — showing accumulation on the breakout.
RSI at 59 and Stochastic at 67 suggest healthy momentum with room for continuation.
MACD structure remains bullish, and multi-timeframe trend strength is intact.
Trend Direction: UPTREND | Volume Confirmation: Strong Buying Activity
________________________________________
🧩 STWP Summary View:
Momentum: Strong
Trend: Bullish
Risk: Moderate
Volume: High
DOMS has broken out of a large multi-month symmetrical triangle, a pattern known for initiating strong directional moves once volatility expands.
The structure remains bullish above 2570–2590, with continuation potential toward 2667 → 2713 → 2794 in the coming sessions.
________________________________________
⚠️ Disclosure & Disclaimer – Please Read Carefully
This analysis is for educational purposes only and should not be treated as investment advice.
I am not a SEBI-registered financial advisor.
Trading carries risk — use stop-loss, risk limits, and disciplined position sizing.
Please consult a SEBI-registered adviser before making trading decisions.
________________________________________
Position Status: No active position in (DOMS) at the time of this analysis.
Data Source: TradingView & NSE India
________________________________________
💬 Found this useful?
🔼 Boost this post to help more traders learn structured analysis
💭 Share your thoughts — does this breakout hold the strength for trend expansion?
🔁 Share with traders who study breakout structures
👉 Follow for more clean, price-action-driven institutional breakdowns
🚀 Stay Calm. Stay Clean. Trade With Patience.
Trade Smart | Learn Zones | Be Self-Reliant 📊
________________________________________
 Long
Long
Midwest Ltd – Retest Confirmation After Breakout (30-Min)Midwest Ltd has shown a clean breakout–retest structure on the 30-minute timeframe, respecting both the trendline support and supply zones. The price successfully reclaimed the ₹1,140–₹1,150 range after a short pullback, confirming a bullish retest setup.
The chart highlights how historical rejections (orange circles) have turned into support retests, strengthening the validity of the breakout. If momentum sustains above ₹1,165, a continuation move toward ₹1,180+ could unfold.
🎯 Key Levels:
CMP: ₹1,160 (+3.95%)
Immediate Resistance (Retest Zone): ₹1,165 – ₹1,180
Support / Gap Zone: ₹1,130 – ₹1,145
Golden Zone (Major Support): ₹1,090 – ₹1,115
Stop-Loss: Below ₹1,120 (on 30-min closing basis)
📊 Technical View:
Ascending structure forming higher lows along trendline support.
Gap zone retested successfully, showing demand absorption.
Shortfall recovery followed by a sharp volume rise on breakout.
Sustaining above ₹1,165 may lead to a new swing leg toward ₹1,200.
🧠 View:
Midwest Ltd is showing a textbook breakout–retest structure. Sustaining above ₹1,165 with volume confirmation could trigger a quick 3–4% upside, while ₹1,115 remains the key demand zone.  Long
Long
Silver Mini Futures (Nov 2025) – Accumulation to Distribution Silver Mini Futures on the 15-min chart clearly showcases a complete market cycle structure — transitioning from accumulation → uptrend → distribution → downtrend, providing an excellent study in price behavior and volume confirmation.
The move began with accumulation around ₹1,55,000, followed by a strong uptrend breakout, leading to a sharp rally. However, as price entered the ascending triangle near the ₹1,66,000 zone, momentum weakened, signaling distribution.
An exhaustion gap and a failed retest confirmed a reversal, leading to a steep downtrend, which remains active after a minor pullback.
📊 Phase Breakdown:
Accumulation Phase: ₹1,54,800 – ₹1,55,800
Sideways base formation with increasing volume at lows.
Uptrend Phase: Breakout above ₹1,56,000 triggered momentum.
Distribution Phase: Formed an ascending triangle with weak breakout follow-through.
Retest failure at ₹1,65,000 signaled exhaustion.
Downtrend Phase: Sharp decline with heavy volume, currently finding support near ₹1,57,000.
🎯 Key Technical Zones:
Resistance: ₹1,64,400 – ₹1,66,000 (supply zone)
Immediate Resistance (Retest Box): ₹1,58,200 – ₹1,58,800
Support Zone: ₹1,56,800 – ₹1,57,100
Major Support: ₹1,54,500
🧠 View:
Silver Mini Futures is currently in a downtrend continuation phase after a distribution top. A minor retest near ₹1,58,800 could invite short opportunities, while only a sustained move above ₹1,60,000 may signal trend reversal strength. Silver Mini Futures (Nov 2025) – Accumulation to DistributionSilver Mini Futures on the 15-min chart clearly showcases a complete market cycle structure — transitioning from accumulation → uptrend → distribution → downtrend, providing an excellent study in price behavior and volume confirmation.
The move began with accumulation around ₹1,55,000, followed by a strong uptrend breakout, leading to a sharp rally. However, as price entered the ascending triangle near the ₹1,66,000 zone, momentum weakened, signaling distribution.
An exhaustion gap and a failed retest confirmed a reversal, leading to a steep downtrend, which remains active after a minor pullback.
📊 Phase Breakdown:
Accumulation Phase: ₹1,54,800 – ₹1,55,800
Sideways base formation with increasing volume at lows.
Uptrend Phase: Breakout above ₹1,56,000 triggered momentum.
Distribution Phase: Formed an ascending triangle with weak breakout follow-through.
Retest failure at ₹1,65,000 signaled exhaustion.
Downtrend Phase: Sharp decline with heavy volume, currently finding support near ₹1,57,000.
🎯 Key Technical Zones:
Resistance: ₹1,64,400 – ₹1,66,000 (supply zone)
Immediate Resistance (Retest Box): ₹1,58,200 – ₹1,58,800
Support Zone: ₹1,56,800 – ₹1,57,100
Major Support: ₹1,54,500
🧠 View:
Silver Mini Futures is currently in a downtrend continuation phase after a distribution top. A minor retest near ₹1,58,800 could invite short opportunities, while only a sustained move above ₹1,60,000 may signal trend reversal strength.  Long
Long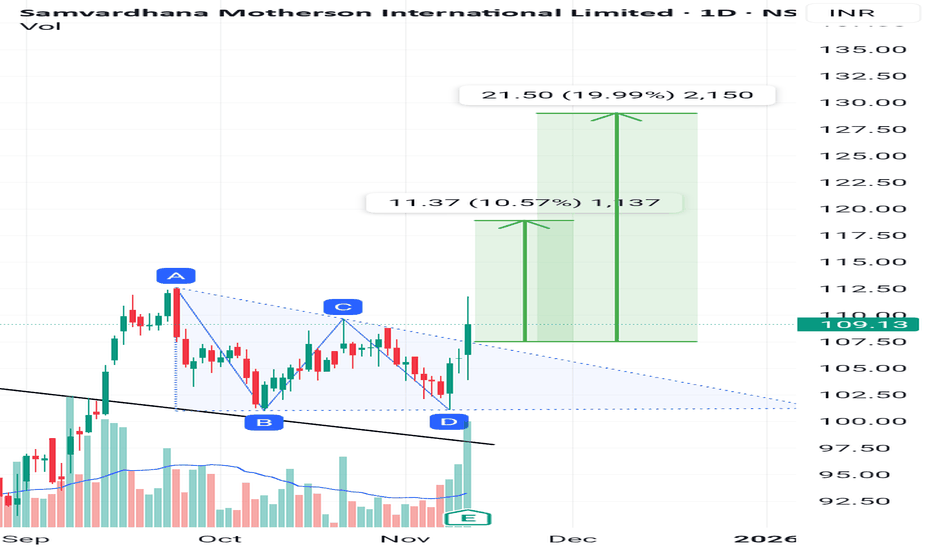
Bharat Dynamics Ltd – Symmetrical Triangle Breakout on Watch (D)Bharat Dynamics is currently trading near a key breakout point of a symmetrical triangle pattern on the daily chart. After a prolonged downtrend, the stock has entered a consolidation phase, forming higher lows and compressing price action — a setup that often leads to a strong directional move.
Bharat Dynamics Q2 Results
✅ Net Profit: ₹216 Cr vs ₹123 Cr (YoY) — 🔼 up 75.5%
✅ Revenue: ₹1,147 Cr vs ₹545 Cr (YoY) — 🚀 strong growth
✅ EBITDA: ₹188 Cr vs ₹98.8 Cr (YoY) — 🔼 up 89.4%
✅ EBITDA Margin: 16.4% vs 18.1% (YoY) — 🔽 slight dip
The price has reclaimed the ₹1,500–₹1,530 zone, and a sustained close above ₹1,550 could confirm a breakout, opening the path for a quick momentum rally toward ₹1,650 and beyond.
🎯 Key Levels:
CMP: ₹1,525.70 (−0.95%)
Breakout Zone: ₹1,550 – ₹1,560
Target 1: ₹1,650 – ₹1,670
Target 2: ₹1,710 – ₹1,740
Resistance: ₹1,950 – ₹2,000
Stop-Loss: ₹1,470 (on daily close basis)
📊 Technical View:
Symmetrical triangle pattern forming after a prolonged correction.
Price compression with reduced volume indicates breakout buildup.
Breakout confirmation expected above ₹1,560 with increasing volume.
If sustained, the move could extend toward the higher resistance zone around ₹1,950+.
🧠 View:
Bharat Dynamics is at a decisive point — a breakout above ₹1,550–₹1,560 with volume can mark the start of a short-term uptrend. Keep an eye on price action near this level for confirmation.  Education
 Long
Long
Long 
 Long
Long
Suzlon (W): Cautiously Bullish, Pending BreakoutThis is a classic "wait and watch" scenario. The stock is coiling in a major, year-long consolidation pattern, and the pressure is building. A powerful fundamental catalyst (record-breaking results) is now meeting a critical technical resistance, setting the stage for a significant move.
📈 1. The Long-Term Context
- The Run-Up: After hitting its all-time low in March 2020, the stock has been in a massive, multi-year uptrend, which paused in September 2024.
- The Pattern: The stock has been consolidating in a Symmetrical Triangle for over a year. This pattern indicates a period of indecision and contracting volatility—a "coiling spring" before its next major trend.
- The Foundation: The long-term trend remains bullish, supported by an active Golden Cross (50/200 SMA) on both the Weekly and Monthly charts .
🚀 2. The Current Setup (The Decisive Hurdles)
The stock is currently squeezed between two key resistance levels that must be broken:
1. A Short-Term Horizontal Resistance: A minor "lid" formed around ₹59-₹61 .
2. The Primary Angular Resistance: The main, multi-month downtrend line that forms the top of the Symmetrical Triangle.
The stock must first break the short-term horizontal level to gain the momentum needed to challenge the main triangle.
📊 3. Indicators & Catalysts
Conflicting indicators are observed which is the key. This is a classic feature of a consolidation phase:
- Short-Term (Weak): The RSI is down (currently in neutral/sell territory), and the short-term EMAs are not yet in a PCO state . This shows the immediate price action is choppy and lacks momentum.
- Long-Term (Strong): The active Golden Cross on higher timeframes shows the underlying trend is still firmly bullish.
- The Catalyst: The "good results" are a massive fundamental driver. The company just reported its highest-ever quarterly net profit (a 539% YoY increase) and a record 85% revenue jump . This provides a strong fundamental case for the triangle to break to the upside .
🎯 4. Future Scenarios & Key Levels to Watch
This is a "wait for confirmation" setup.
🐂 The Bullish Case (Two-Step Breakout)
- Trigger 1 (Short-Term): A decisive, high-volume breakout and close above the horizontal resistance (₹61) .
- Target 1: This would likely trigger a quick move to the first target of ₹65 .
- Trigger 2 (Long-Term): A sustained move that breaks the main angular resistance of the triangle.
- Target 2: This confirms the end of the year-long consolidation and opens the door to long-term target of ₹74 .
🐻 The Bearish Case (Breakdown)
- Trigger: If the stock fails to break out (due to weak short-term momentum) and instead breaks the triangle's support .
- Target: The price would likely fall to retest the recent support level, which is the identified zone of ₹51 - ₹53 .  Long
Long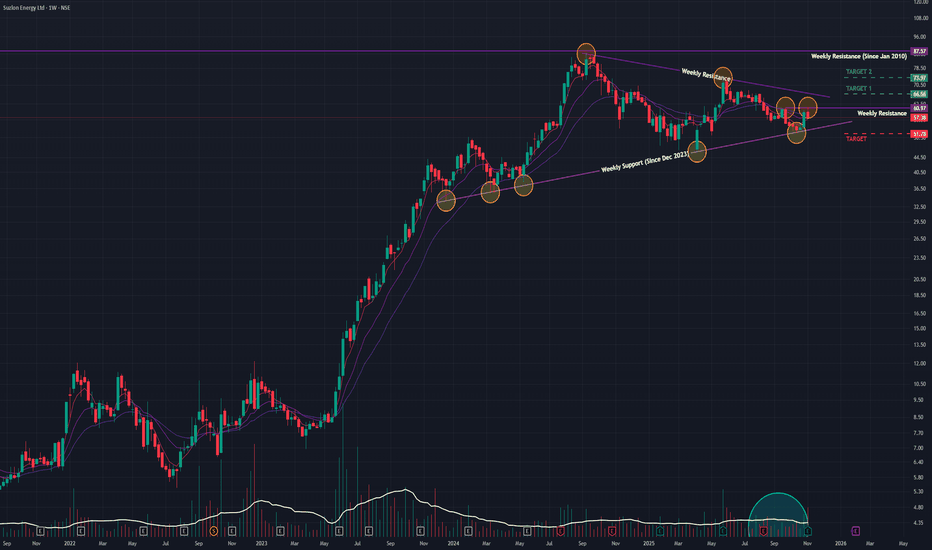
 Long
Long
 Long
Long
Long 
Supriya Lifescience (W): Bullish, Awaiting Breakout ConfirmationThe stock is in a classic bullish consolidation pattern. After establishing a major bottom in March 2023, the price has been in a clear uptrend. The current "Ascending Triangle" pattern shows that pressure is building for a significant move.
📈 1. The Dominant Pattern: Ascending Triangle
- Formation: Since October 2024, the stock has been forming a clear Ascending Triangle. This is defined by:
1. A flat, horizontal resistance line that has rejected multiple breakout attempts.
2. A rising support trendline , indicating that buyers are stepping in at progressively higher prices.
- Implication: This pattern is bullish because it shows that sellers are holding a fixed line, but buyer aggression is steadily increasing.
🚀 2. The Current Setup (The "Coiling Spring")
- Pressure Building: The stock has made several attempts to break the resistance and failed. This is normal and builds energy for the eventual move.
- Imminent Test: The stock is once again testing this critical resistance this week . The price is being compressed between the rising support and the flat resistance, which usually precedes a volatile move.
📊 3. Key Technical Indicators
- RSI: The Relative Strength Index is rising on both the Monthly and Weekly timeframes. This shows that long-term and medium-term momentum is building in favor of the buyers.
- EMAs: The short-term Exponential Moving Averages are in a "PCO" (Price Crossover) state, confirming the immediate trend is bullish.
🎯 4. Future Scenarios & Key Levels to Watch
This setup provides two very clear outcomes:
🐂 The Bullish Case (Breakout)
- Trigger: A decisive, high-volume close above the horizontal resistance of the triangle.
- Confirmation: This move would confirm the triangle is complete and the next leg of the uptrend has begun.
- Target: The next logical price target would be ₹1,300 .
🐻 The Bearish Case (Breakdown)
- Trigger: The stock fails at resistance again and, more importantly, breaks below the triangle's rising support trendline .
- Confirmation: This would invalidate the bullish pattern.
- Target: The price would likely fall to retest the next major horizontal support level at ₹710 .  Long
Long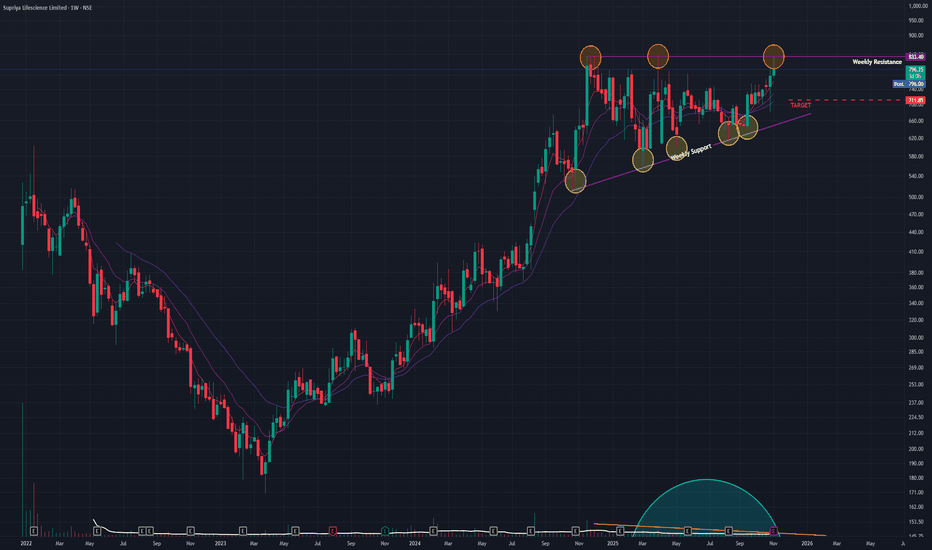
 Long
Long


 Long
Long