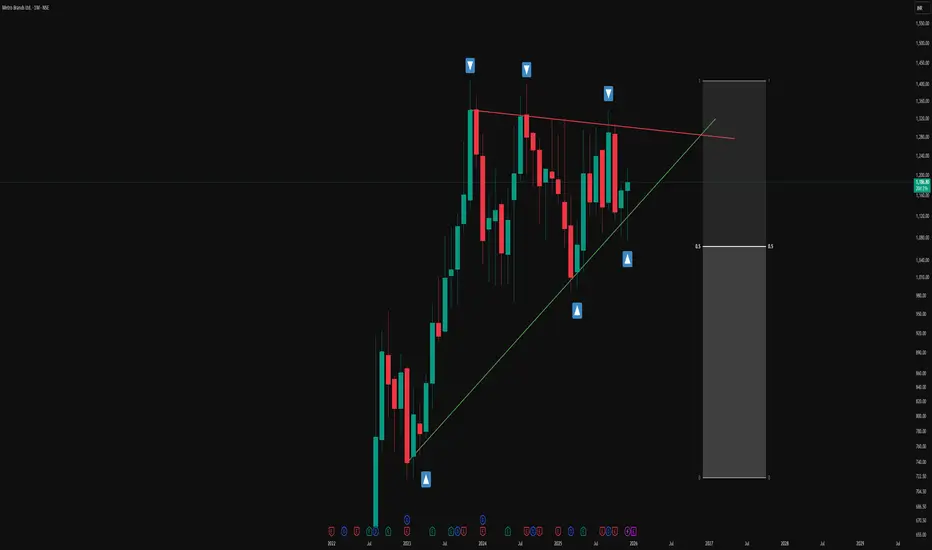
Simple Triangle Pattern on a Monthly Time FrameOverview -
This monthly chart illustrates a symmetrical triangle pattern defined by a series of higher lows and relatively stable swing highs, framed by a green ascending trendline and a red counter-trendline. The structure is presented in an observational manner to highlight how price has evolved within these converging boundaries over an extended period.
Triangle structure -
1.The green line represents the primary trendline, drawn from successive higher swing lows where price has repeatedly
Triangle
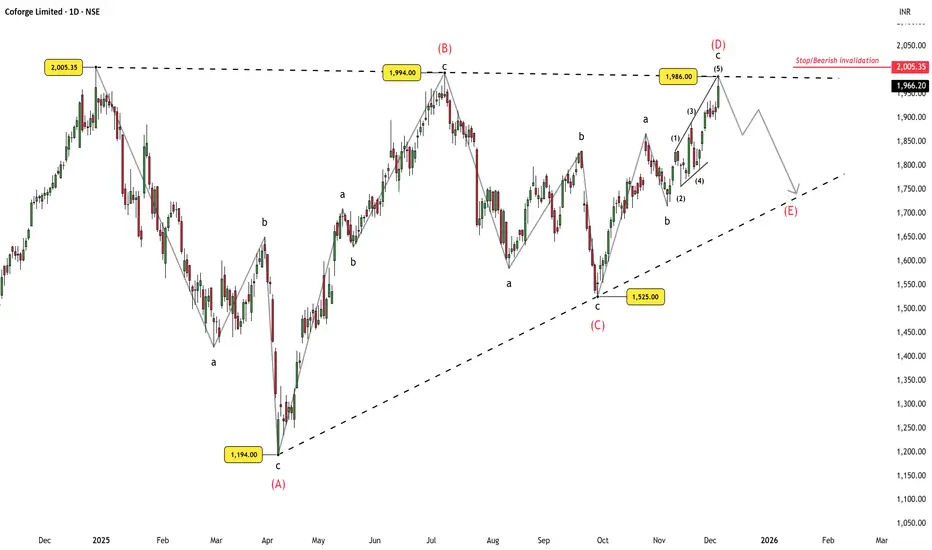
Coforge: Ending Diagonal Signals Exhaustion Near Wave (D) HighCoforge has likely completed Wave c of (D) with a clean ending diagonal near the upper boundary of the multi-month triangle structure. This raises the probability of Wave (D) being complete — if price turns down from here.
Technical View
Ending Diagonal: The final leg into ₹1,986 shows a wedge structure — typical of terminal C-waves inside corrective patterns.
Structural Resistance: This move hits the B–D trendline, a natural pivot for Wave (D) completion.
Pivot Zone: The 52-week high
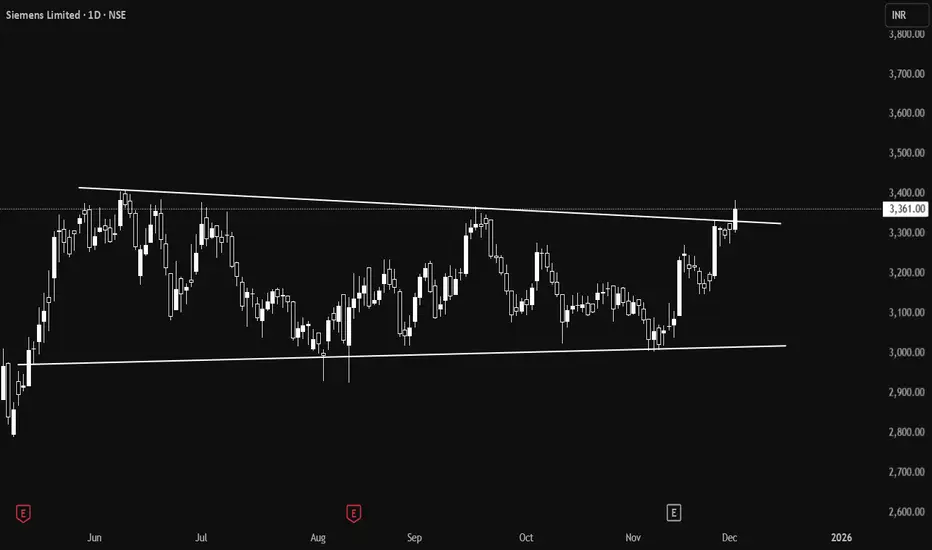
NESTLEIND – Symmetrical Triangle Breakout Setup (1D Chart)I’m watching Nestle India for a potential bullish breakout from a symmetrical triangle on the daily timeframe. Price has been consolidating after a strong impulsive move, and it is now respecting both trendline support and triangle resistance.
🔍 What I'm Seeing
Price created a strong rally, followed by a healthy consolidation.
A symmetrical triangle pattern has formed — showing tight price compression.
Price is currently sitting near the trendline support, indicating buyers are still active.
HCLT - Buy - Technical Analysis#HCL Technologies Limited - Technical Analysis
Price: 1,683.00 |
#Trade Setup - Bullish Reversal
#Outlook
Strong bullish setup with 4-35% upside potential. The failed bearish head & shoulder pattern combined with monthly demand zone bounce suggests institutional accumulation. Breakout above 1,745 opens path to 1,951 and beyond.
Pattern Analysis:
1. Bounced from monthly demand zone - Strong support established
2. Made higher low in monthly chart - Trend reversal signal
3. Failed Bearish Hea
#Bajaj Finance Limited - BUY - Technical Analysis#Bajaj Finance Limited - #Technical Analysis
Price: 1,048.00
#Swing Trading Setup
Pattern: #Range #breakout with #consolidation above breakout zone. #Triangle/Box pattern breakout with target hit. Currently forming double bottom pattern.
Key Technical Points:
1. Range breakout & consolidating above breakout area
2. EMA's sorted & aligned - price trading above all EMAs
3. Triangle/Box pattern breakout - target achieved, now forming double bottom
4. Classic divergence in recent bounce area co
US500 – Clean Retest of Broken Structure With Bearish ContinuatiPrice has retested the broken structure level (blue line) and is now reacting inside a premium zone, suggesting sellers may re-enter the market from this region. The consolidation and repeated rejections indicate absorption of buy-side pressure.
With HTF context still pointing toward a deeper correction, this LTF retest offers a potential distribution setup before a continuation lower toward the next major liquidity pocket.
Bearish Path:
• Retest of the broken structure
• Reaction from premium
Sbin The lower time frame shows the price is forming a triangle pattern. And nearby support is seen at the 942 to 952 zone.
The daily chart shows, the price is moving steadily and is having a pullback towards the trend line. The price can bounce from the trend line.
If the price breaks the triangle, sell below 960 with the stop loss of 966 for the targets 954, 948, 942 and 936.
Buying opportunities will come when the price tests the 940 zone.
Always do your analysis before taking any trade.
Trade Rate Sensitive Assets: A Comprehensive OverviewIntroduction
In the global financial markets, assets are often influenced by fluctuations in trade rates, currency values, and interest rates. Trade rate sensitive assets are those whose valuations, returns, or profitability are significantly affected by changes in trade rates or related economic variables. Understanding these assets is crucial for investors, traders, and policymakers, as shifts in trade rates can impact everything from corporate earnings to sovereign debt sustainability. In th
Descending Triangle BreakoutOberoi Reality is forming a Descending Triangle Pattern and can be a good Swing Trade for two reasons:
1. Descending Triangle Pattern gives a Good Breakout Movement.
2. The QOQ result of the stock has been very good with an increase of Profit in the Medium Term.
3. The stock has formed higher low in Price as Well as RSI.
I've set the targets at 38.2 and 50 levels of the fibonacci.
Descending Triangle PatternThis can be a profitable trade because of :
1. The stock is forming Descneding Triangle Pattern which can give potential momentum till 12-15%.
2. The stock's current low is a bit above the previous one and can be also see in the RSI.
3. DLF has given very strong QoQ resultand has shown very high profit.
The Stock's upcoming target are marked using Trend based Fibonacci Extension Tool.
Decoding the Descending Triangle: Key Structure & FVG🔻Understanding the Pattern
- The chart above highlights a classic descending triangle pattern, easily visible by its series of lower highs (marked in red) and a relatively consistent demand zone acting as support.
- This resistance trendline (CT—Contraction Trendline) has been tested multiple times, confirming its significance as sellers consistently respond to price rallies by pushing back from lower levels.
🔻Equilibrium and Price Exploration
- Notice how price action moves from the equilibri
Symmetrical Triangle breakdown 🔎 Overview
The Symmetrical Triangle is a contraction pattern formed when the market prints Lower Highs (LH) and Higher Lows (HL) inside two converging trendlines.
After a strong impulsive bullish move (flagpole), price enters consolidation as volatility shrinks — this creates the triangle.
Momentum shifts only when price breaks out of the structure.
A Symmetrical Triangle is a neutral pattern that can break in either direction, allowing momentum to expand upward or downward once price closes
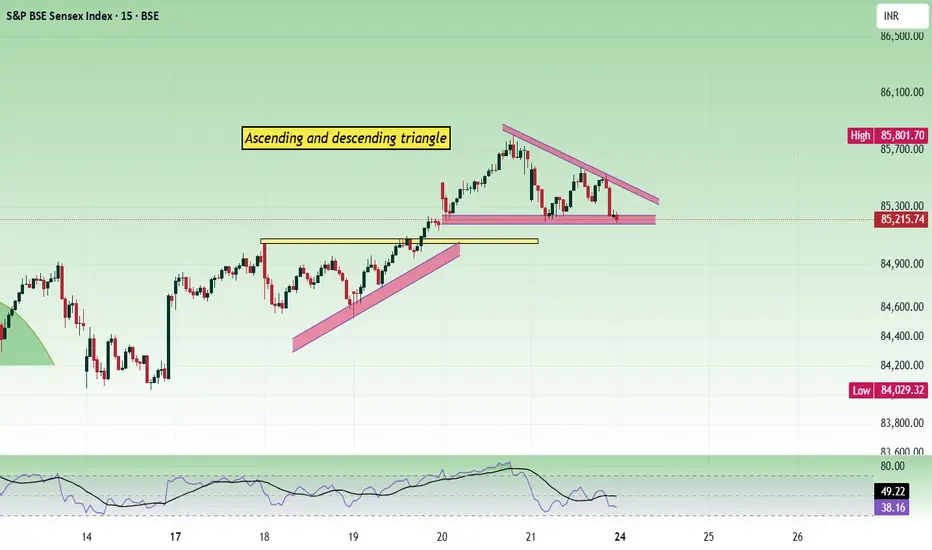
Sensex - Weekly review Nov 24 to Nov 28We can see a very interesting pattern formation. Price has formed an ascending triangle pattern before breaking out to the upside. After that, it has formed a descending triangle. There is a trend direction zone between 85000 and 85200.
How the price reacts between 85000 and 85200 will decide the trend direction.
Buy above 85260 with the stop loss of 85120 for the targets 85380, 85520, 85680, 85840, 85980, 86120 and 86300.
Sell below 84900 with the stop loss of 85060 for the targets 84760, 84620
Godrej Properties Symmetrical TriangleGodrej Properties is forming a Symmetrical Triangle. The recent news signify that they have acquired land / property deal worth of 2400 Cr which can boost the stock. I've outlined 4 possible targets using the Fib Tool. Not sure if it's gonna go down or up. Let me know your opinion about it.
PEL | Triangle breakout after 7 years consolidationPEL | Triangle breakout after 7 years consolidation
CMP : 1293 (Dip : 1150)
SL : 1000
P
Sensex - Expiry day analysis Nov 20The price is sustaining above the resistance at 85k, and the resistance is acting as support now. The pattern we are seeing in the chart is an ascending triangle, which can give a breakout to the upside. For this to work, the price should show bullish strength at the 85k zone.
Buy above 85060 with the stop loss of 84920 for the targets 85200, 85320, 85480 and 85600.
Sell below 84780 with the stop loss of 84920 for the targets 84660, 84520, 84400 and 84260.
Expected expiry day range is 84800 to 8