Triangle
Is Wave 5 About to Lift Indian Bond Yields Higher?After a strong impulsive rise from 6.13% to 6.65%, the India 10-Year Government Bond Yield appears to be consolidating in a textbook Wave 4 contracting triangle . Each leg within the pattern—(a) through (e)—shows the typical compression seen before the final thrust in yields.
If this interpretation holds, a Wave 5 breakout may soon lift yields higher toward or beyond the 6.7% region, completing the larger five-wave structure.
Market Implication:
A rise in bond yields usually reflects tigh
Supply-Demand Squeeze: Symmetrical Triangle at the Flip zoneWitness a textbook supply-demand play on the monthly chart of Bharat Wire Ropes Ltd. as price contracts above a major zone conversion! The chart highlights a high-probability symmetrical triangle pattern—marked with a red counter trendline (lower highs) and a green trendline (higher lows).
This powerful squeeze forms right at the intersection of key supply and demand zones.
- Both supply (resistance) and demand (support) have been mapped for clear zone analysis.
- The symmetrical triangle show
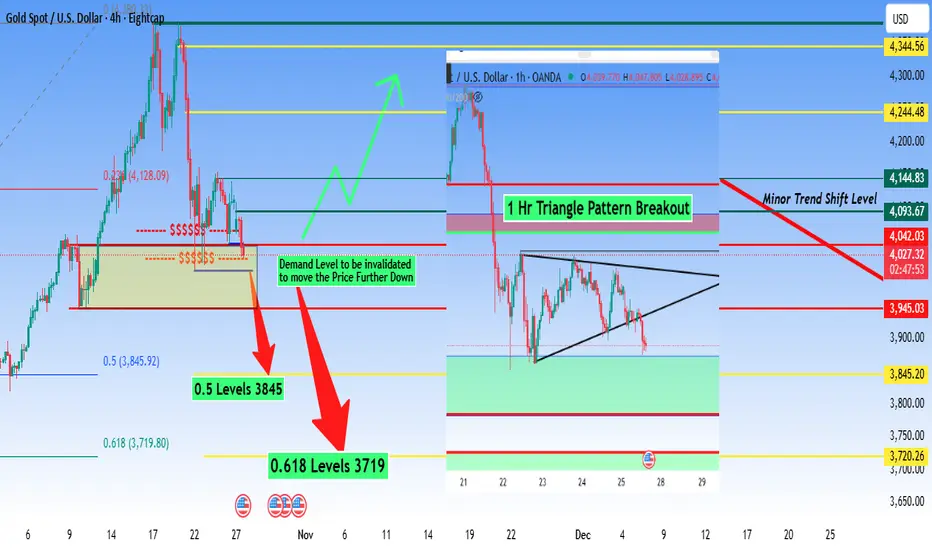
XAUUSD Analysis - Levels and Pridiction#Gold (XAU/USD) Technical Analysis - October 27, 2025
Current Market Status: Retracement on Higher Time Frame,
Lower Timeframe Bearish Breakdown⚠️
Gold is trading at 4,033.67, having broken down from the previous #consolidation zone. The market has violated key support levels and is now showing clear bearish momentum with multiple technical confirmations.
Critical Technical Developments:
1️⃣ Triangle Pattern Breakdown (1H Chart)
The 1-hour chart reveals a confirmed triangle #pattern breakout
Mastering MTFA Charts : Symmetrical & Descending PatternsObserve the synergy of multiple time frames with this detailed analysis of Bhageria Industries Ltd.
Target Points -
1) The right panel displays a monthly chart, highlighting a broad symmetrical triangle formation within a prominent supply-demand zone—notice how the structure showcases the interplay of lower highs and higher lows, reflecting a period of equilibrium and market compression.
2) The left panel brings the focus to the weekly time frame, where a descending triangle pattern unfold
Descending Triangle fake breakdowns explainedThe daily chart for Utkarsh Small Finance Bank Limited displays a well-defined descending triangle, marked by a consistent supply trendline and an established horizontal support zone. During the recent price action, there was a temporary dip below the support, which was quickly retraced as price action returned within the range and formed a distinct lower wick rejection candle at the base.
This chart highlights the role of false moves and re-entries within important technical zones, as well as
ASCENDING TRIANGLE BREAKOUT IN RBL BANK-EDUCATIONAL PURPOSEBreakout seen on weekly chart after 5 years of consolidation
Long position can be initiated on little correction till 300 levels with the investment horizon of around 5 years
Target : 660 (121%)
Stoploss : Weekly closing below 242 (-21%)(recent swing low)
Risk Reward Ratio = 1:6
Investment horizon : 55-60 months (till October 2030)
Only for investment -- Not for short term trading
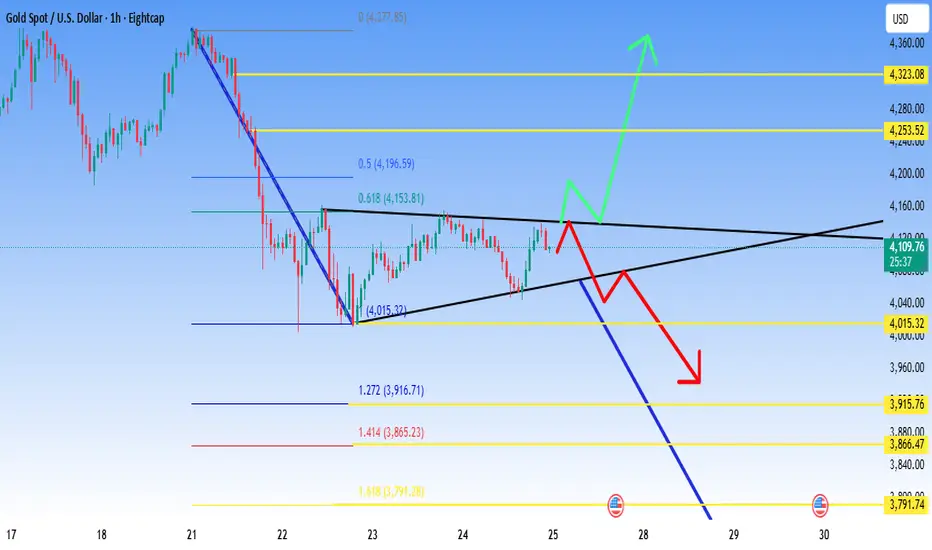
XAUUSD, Whats the Trend? If Pattern Breaks out?#Gold (#XAU/USD) Technical Analysis - October 24, 2025
Current Market Bias: **BEARISH**
Gold is currently trading at 4,109.12, positioned within a critical decision zone. The price action shows a developing #Descendingtriangle pattern with a clear resistance trendline connecting the recent highs around 4,150-4,200.
Key Observations:
The market has failed to break above the dynamic resistance multiple times, indicating weakening bullish momentum. Price is currently hovering near the 0.618 Fib
INDUSTOWER - Symmetrical Triangle Breakout Watch🚀 Indus Towers Ltd (NSE: INDUSTOWER) | Symmetrical Triangle Breakout Watch
________________________________________
🏢 Company Overview
Indus Towers Ltd is one of India’s largest telecom tower companies, providing critical passive infrastructure for the country’s telecom operators. The stock recently stabilized after a sharp fall and is now moving into a consolidation pattern that could signal the next big move.
________________________________________
📊 Current Market Snapshot
CMP: ₹352.05
Secto
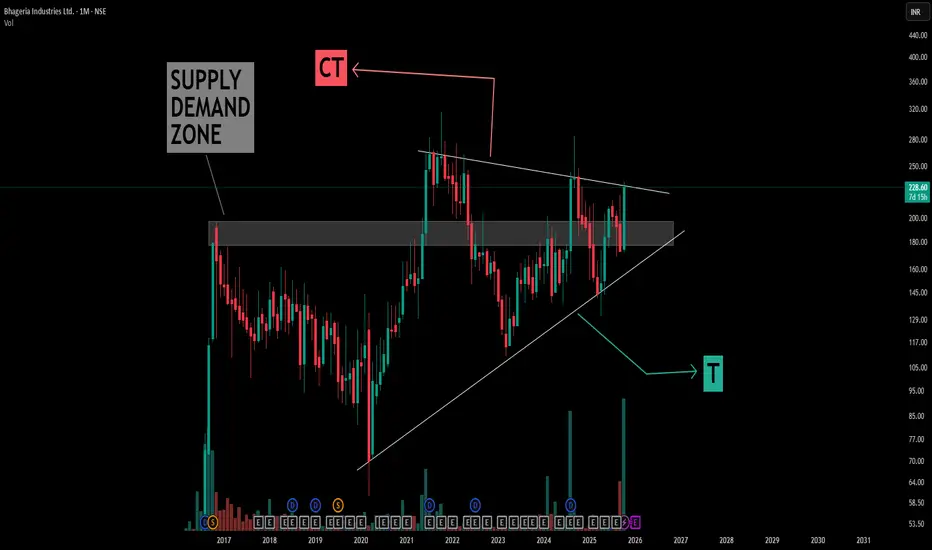
Understanding Symmetrical Triangle Patterns in depthThis chart illustrates a classic example of a symmetrical triangle pattern formed over several years, with simple compression trendline (CT) and trigger (T) lines drawn in white for clarity.
Key learning points from the structure:
- Symmetrical Triangle Formation: The pattern is defined by converging trendlines representing successive lower highs and higher lows, indicating a period of price consolidation and market indecision
- Supply Converts to Demand: The boxed area initially acted as suppl
Bharat Forge (BHARATFORG)Pattern: Symmetrical Triangle
Breakout Zone: Above ₹1,272
Structure: Higher-low formation inside triangle; RSI > 55, MACD crossover supportive
Volume: Expansion seen near breakout candle
Plan:
Buy Trigger: Close above ₹1,272
Stoploss: ATR-based (~₹1,230)
Targets: ₹1,380 → ₹1,450
View: Momentum-supported breakout; auto-ancillary sector showing rotation strength.
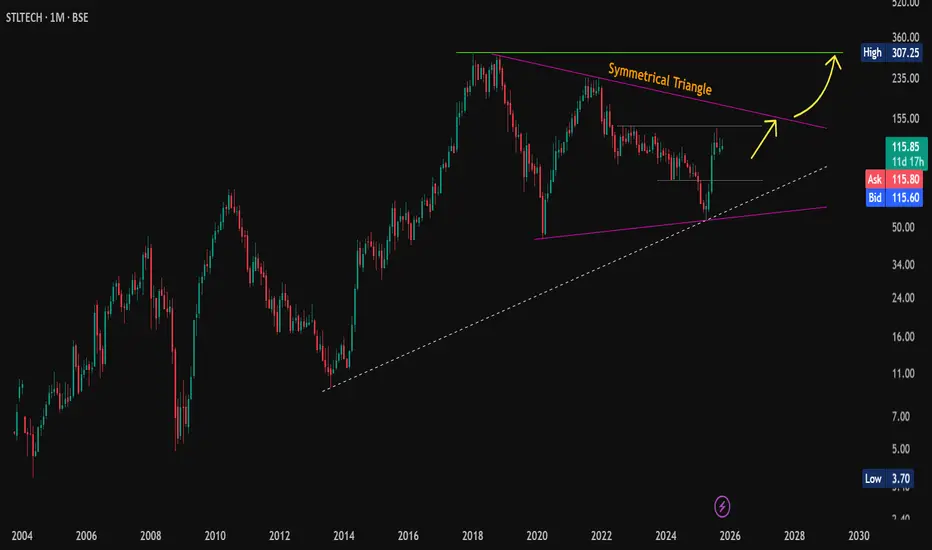
#STLTECH: Sleeping Giant in Fibre Space?✨ #MuhuratPick 🪔
CMP: 115.85
📐 Pattern: Symmetrical Triangle on Monthly Chart
🔼 Immediate Resistance: 143 (breakout zone)
🔽 Support Levels: 105 / 95 | Strong support: 82
❌ Pattern Invalidation: 61.80 (MCB)
🎯 Pattern Target:
Triangle height ≈ 251 points from trendline → Potential target = ATH 307+
🚀 Can Go Big in the Long-Term
#DiwaliPick | #STLTECH | #SterliteTech | #DataCentreTheme | #OpticalFibre | #ChartSetup | #LongTerm | #SymmetricalTriangle | #ChartPatterns | #TurnAro
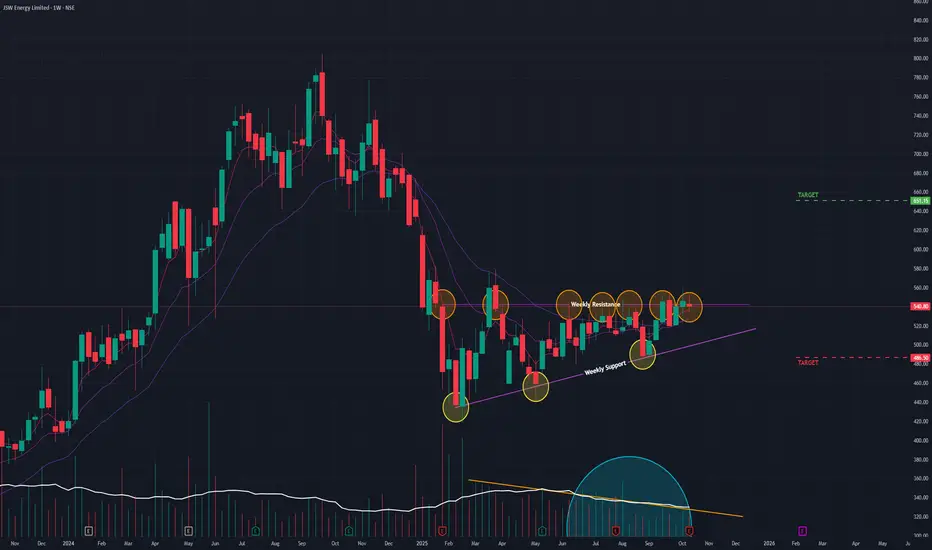
JSW Energy (W) - Coils in Bullish Triangle, Awaiting BreakoutAfter a prolonged downtrend from its September 2024 peak, JSW Energy is showing clear signs of a potential trend reversal, as it meticulously forms a classic bullish pattern. The stock is now approaching a critical decision point.
The Setup: An Ascending Triangle
Since February 2025, the stock has been forming a classic Ascending Triangle . This bullish pattern is characterized by:
- A series of Higher Lows , indicating that buyers are becoming more aggressive on each pullback.
- A flat
Ganesh Housing cmp 861.60 by Weekly Chart viewGanesh Housing cmp 861.60 by Weekly Chart view
- Support Zone 790 to 830 Price Band
- Resistance Zone 950 to 1000 Price Band
- Descending Triangle Breakout in the making process
- Support Zone seems tested retested over the past few weeks
- Volumes are flat, need to increase for fresh upside price movement
Persistent (D) - Surges 7% But Stalls at Key ResistancePersistent Systems showed significant bullish intent today with a powerful, high-volume surge. However, it was ultimately rejected at a key resistance trendline, placing the stock at a critical juncture where a breakout is being fiercely contested.
The Consolidation Pattern: A Triangle
Since reaching its All-Time High (ATH) in December 2024, the stock has been consolidating within a large Triangle Pattern . The upper boundary of this pattern is a descending (angular) resistance trendline th
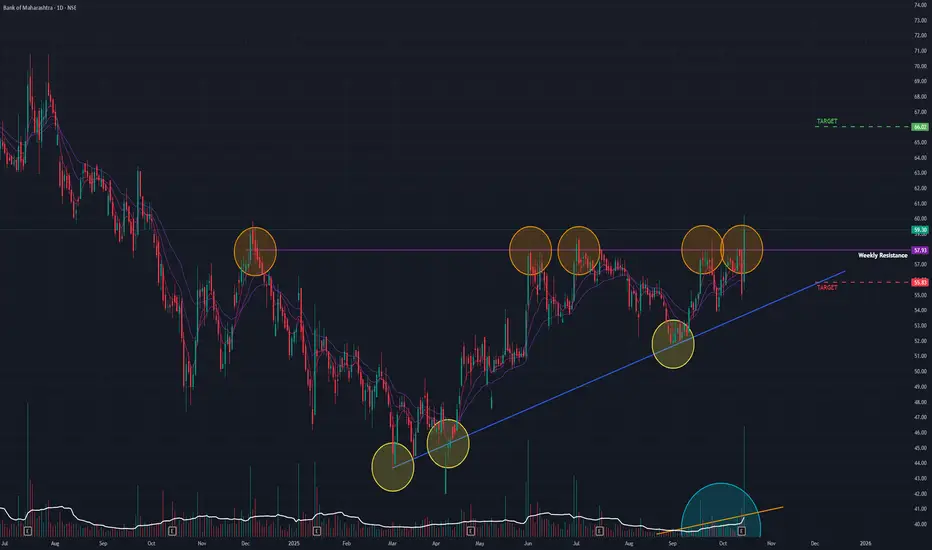
Bank of Maharashtra (D) - Breaks Out of Bullish Triangle PatternBank of Maharashtra has delivered a powerful bullish signal today, breaking out of a classic Ascending Triangle pattern on high volume. This decisive move suggests that its consolidation phase is over and a new uptrend is likely beginning.
The Setup: An Ascending Triangle
Following a prior downtrend, the stock meticulously formed an Ascending Triangle pattern. This is a classic bullish structure characterized by a series of Higher Lows consistently pushing up against a flat horizontal re
TATA Comm (D) - Breakout Confirmed, But Indecision Pauses RallyTata Communications has completed all the phases of a classic bullish breakout, but today's trading action suggests a brief pause or indecision before a potential new leg up. The overall technical posture remains strong as long as the stock holds above its newly established support.
The Setup: An Ascending Triangle
Following a brief downtrend from its September 2024 All-Time High, the stock began forming a solid base. This took the shape of a classic Ascending Triangle , characterized by a
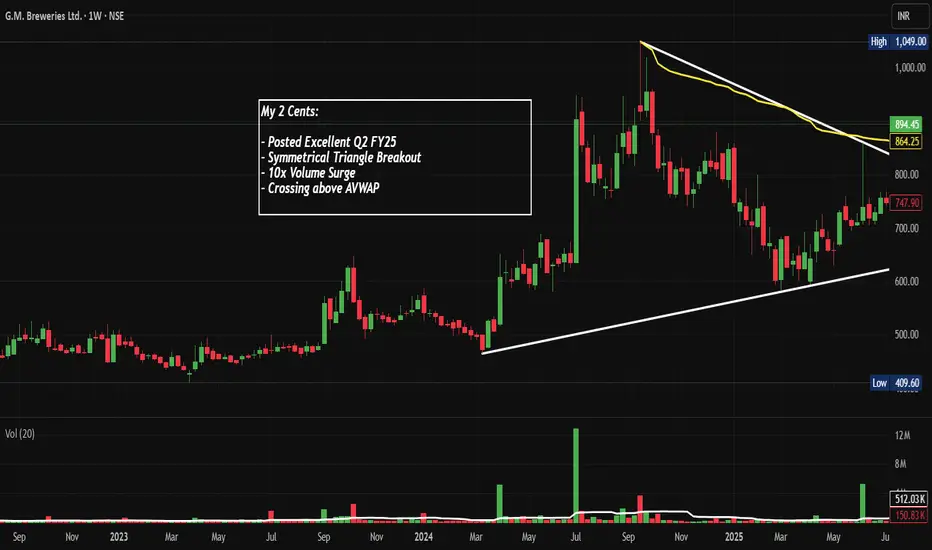
GMBREW: Broke Out Post Q2 FY26 with 10x Vol, Chart of the WeekA Small-Cap Brewery Stock NSE:GMBREW Broke Out With 10x Volume and Posted 61% Profit Growth in Q2 FY26. Let's Analyse in the "Chart of the Week"
As per the Latest SEBI Mandate, this isn't a Trading/Investment RECOMMENDATION nor for Educational Purposes; it is just for Informational purposes only. The chart data used is 3 Months old, as Showing Live Chart Data is not allowed according to the New SEBI Mandate.
Disclaimer: "I am not a SEBI REGISTERED RESEARCH ANALYST AND INVESTMENT ADVISER."
T