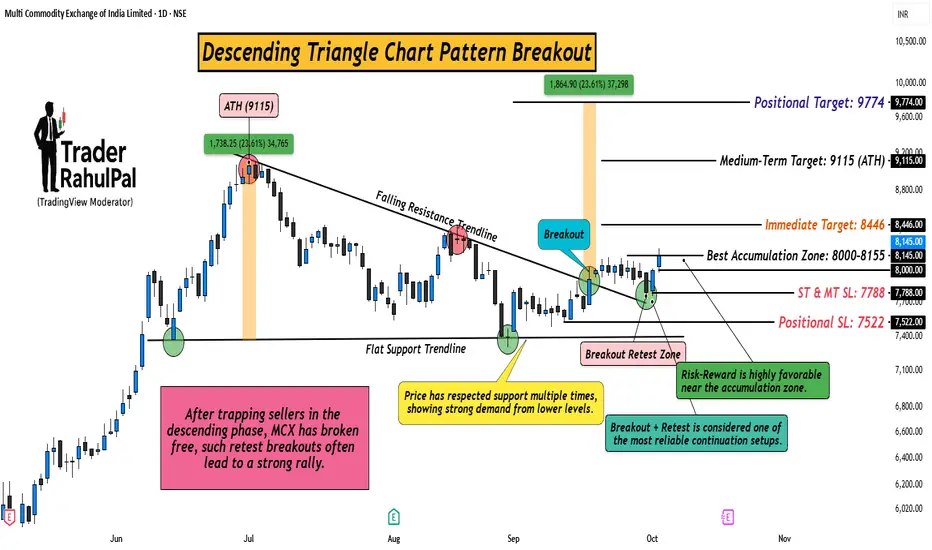
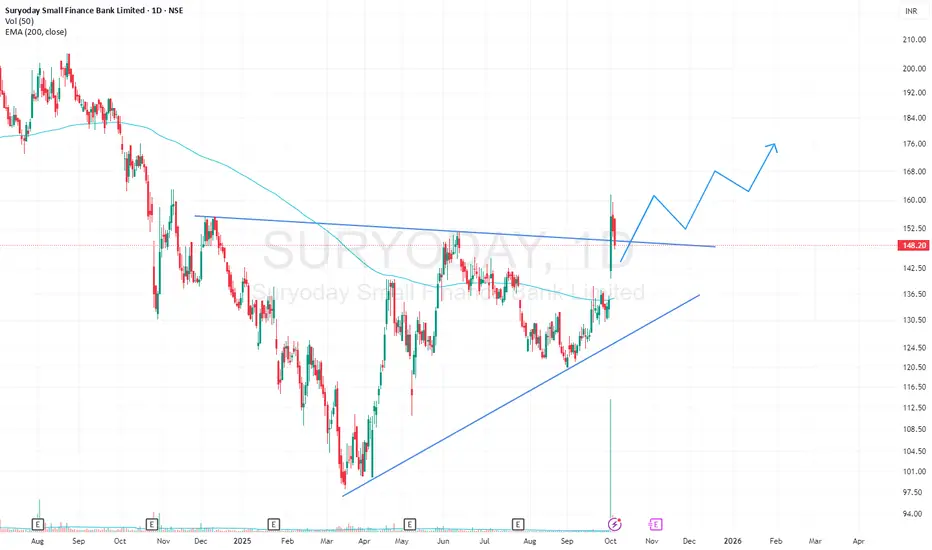
Don’t Miss This Rare MCX Setup Breakout + Retest= Big Move AheadHello Traders!
Today’s analysis is on MCX Ltd., where we just spotted a powerful Descending Triangle Breakout . After weeks of consolidation, the price has finally broken the falling resistance and even retested the breakout zone. This setup often leads to a strong trending move.
Why this setup is special?
Price respected support multiple times, showing heavy demand from lower levels.
Breakout + Retest makes it one of the most reliable continuation patterns.
Risk–Reward is highly favorabl
Triangle
ETH Retest Confirmed – Bullish Momentum Intact!CMP: $3,968
Ethereum is holding strong above the symmetrical triangle breakout zone after a textbook breakout + retest . Despite the recent consolidation, the structure remains bullish , and the bigger pattern is still in play.
🔶 Technical Highlights:
✅ Symmetrical Triangle Breakout: ETH successfully broke out and retested the upper trendline (see red circle). This retest confirms the breakout validity.
✅ Consolidation Above Resistance: ETH is consolidating in a tight range above
Indian Hotels: Post-Triangle Rally Taking ShapeChart Insight
Price action has been coiling within a clean contracting triangle, with the recent rebound from ₹708.10 likely marking the E-wave low . The broader structure fits neatly as a possible Wave (4) consolidation within the larger uptrend.
Momentum View
RSI has turned higher from the oversold region, mirroring price stability near the triangle base — an early hint that momentum is rebuilding.
Trade View
As long as ₹708.10 holds, a bullish bounce toward ₹811.95 and possibly ₹8
Symmetrical Triangle & Parallel Channel CoexistenceThis weekly chart of Tara Chand Infralogistic Solutions Ltd. serves as a case study in identifying and analyzing overlapping price action structures in 3 Main Points -
1) The chart highlights a well-defined symmetrical triangle pattern, with one white line representing the counter-trendline (CT) and another as the primary trendline (T), illustrating the process of volatility contraction.
2) Overlaid within the triangle, a clearly marked parallel channel (in pink) frames the intermediate price
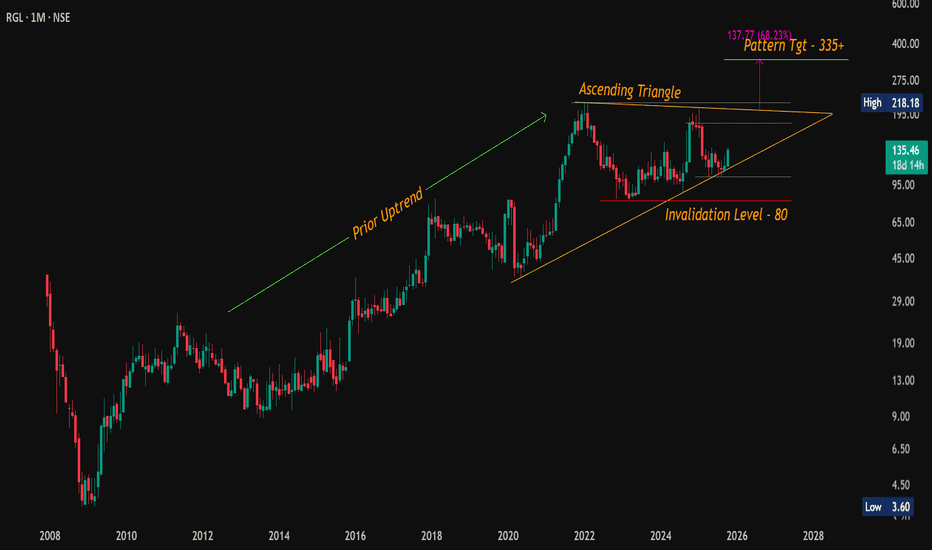
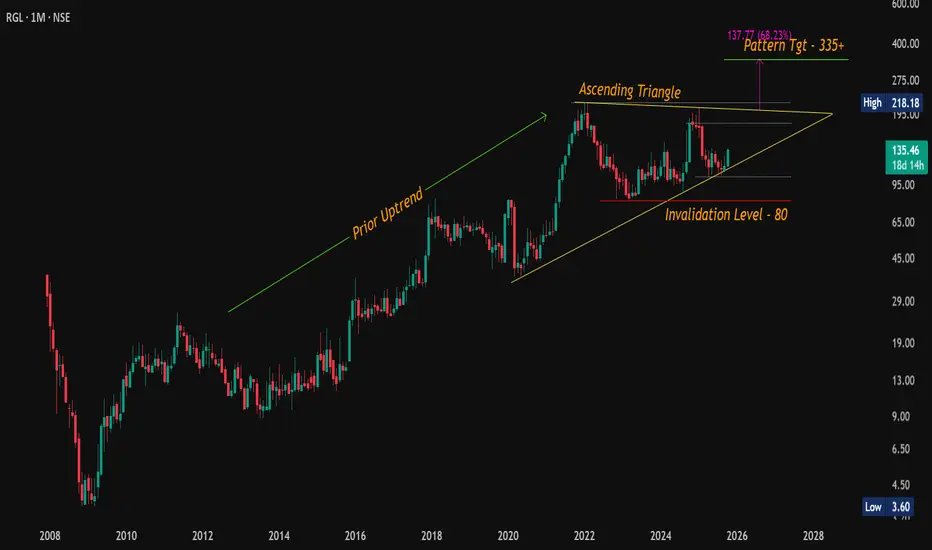
#RGL – Ascending Triangle Breakout Loading?CMP: 135.50
Setting up for a potential bullish breakout with a classic Ascending Triangle pattern on the monthly chart , following a strong prior uptrend.
🔹 Overhead Resistances: 146 / 177 / 207
🔹 Breakout Confirmation Level: 218
🔹 Support Zone: 103 – 99
🔹 Pattern Target: 335+
🔸 ~68% upside from breakout level
🔸 ~150% upside from CMP (135)
📉 Pattern Invalidation Level: 80 MCB
📈 A sustained breakout above 218 (monthly close) may open the gates for a strong move towards
#Nifty | Will Nifty Break Free? Triangle Says Soon!#Nifty Daily Outlook:
CMP: 25,285
Pattern: Symmetrical Triangle ▶️
A Symmetrical Triangle pattern is forming on the daily timeframe , following a strong uptrend , a classic bullish continuation setup .
🟣 Breakout Level: A daily close above the falling trendline from the all-time high (ATH) ( marked in purple ) will confirm the breakout.
🎯 Pattern Target: 26,700
🔒 Pattern Invalidation: Close below 24,337 DCB
Price action is compressing tightly within the triangle, ind
Dynamatic (D) - Double Breakout Signals Trend ContinuationAfter consolidating since its all-time high in April 2024, Dynamatic Technologies has delivered a powerful and technically significant breakout, suggesting its previous uptrend is ready to resume.
The Consolidation Pattern
For the past several months, the stock has been trading within a Triangle Pattern . This is a classic continuation pattern, indicating a pause in the trend rather than a reversal. While there have been several attempts to breach the upper descending trendline of this pat
Symmetrical Triangle Breakout Watch | Sequent Scientific-Red line marks a key counter trendline (resistance) from previous swing highs, acting as a short-term ceiling.
-Green line indicates the primary trendline (support) from recent swing lows, showing steady price strength.
-Hidden dashed lines reveal underlying resistance zones, adding complexity to potential breakout levels.
-The overall chart displays a large symmetrical triangle pattern—a classic consolidation setup, Simple .
- Disclaimer: Trading involves significant risk and is not suita
Triangle Breakout Alert: Aluminium Bulls Waking Up?CMP: $2743
Aluminium is breaking out of a symmetrical triangle on weekly timeframe after months of consolidation.
📍 Breakout Zone: $2736 – $2799
📉 Support Levels: $2633 / $2543 – $2481
📈 Resistance Zones: $3170 – $3229, then $3388
🎯 Symmetrical Triangle Pattern Target: ~$3378 (+23% from CMP), which aligns closely with the major resistance zone between $3229 – $3388 .
A weekly close above $2736 – $2799 could support further upside momentum.
If price pulls back within the tr
Sagility cmp 43.47 by Daily Chart view since listedSagility cmp 43.47 by Daily Chart view since listed
- Support Zone 40.75 to 42.75 Price Band
- Resistance Zone 45.50 to 47.50 Price Band
- Price traversing inside Symmetrical Triangle pattern
- Support Zone repeatedly tested rested since month of July 2025
- Price trending in Darvas Box range 41.50 to 47.50 and awaiting Breakout
- Price rejection seen by frequent selling pressure at Resistance Zone upper band
- Fresh Breakout possible basis supportive Volumes based closure above 47.50 price l
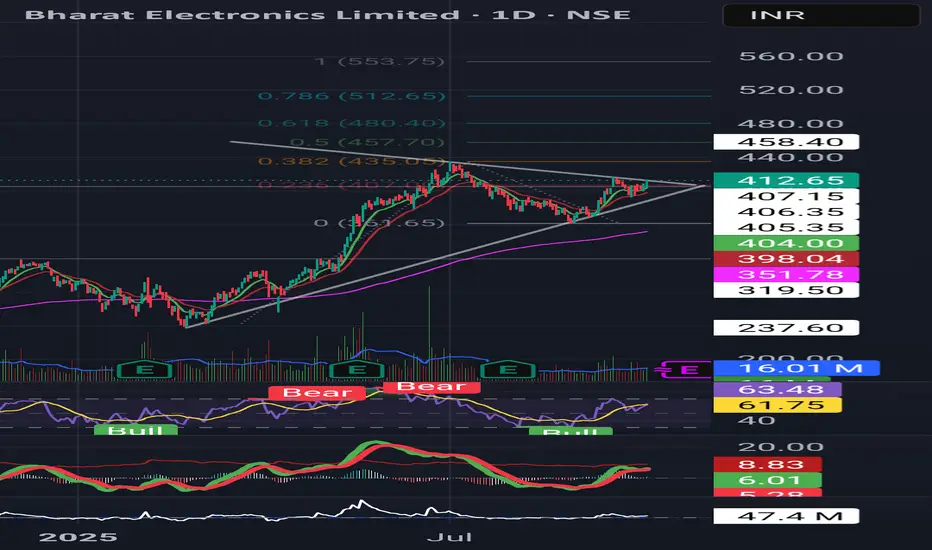
BEL (Bharat Electronics Ltd) – Technical SetupPattern: Symmetrical Triangle breakout visible on the daily chart.
Breakout Confirmation: Price has moved above the triangle resistance trendline with rising volume.
Targets (Fibonacci-based):
1st Target: ₹435
2nd Target: ₹480
3rd Target: ₹512
Stoploss: ATR-based, below support zone (~₹395–₹400).
---
🔎 Multi-Timeframe Check
Daily: Strong breakout setup with RSI > 60, MACD crossover supportive.
Hourly: Needs sustained close above breakout for confirmation.
Weekly: Still consolidatin
SRFSRF is exhibiting a triangle breakout, supported by a reversal and currently trading above a key support level. The stock has formed a strong bullish candle, indicating positive sentiment.
It's advisable to monitor the next trading session for confirmation of continued upward momentum. If the bullish trend persists, further price appreciation can be expected.
Given the current technical setup, there is a high probability of sustained upward movement. However, to manage risk effectively, implemen
Prakash Ind (D) - Coils in Major Triangle Pattern, Nearing ApexPrakash Industries is currently in a prolonged consolidation phase, trading within a large Triangle pattern that has been forming since September 2023. This pattern typically acts as a continuation of the prior trend, which in this case was a strong uptrend that began in April 2023.
The stock is now approaching the apex of this triangle, suggesting a significant price move could be imminent. The key boundaries to watch are:
- A formidable long-term resistance trendline dating back to Janu
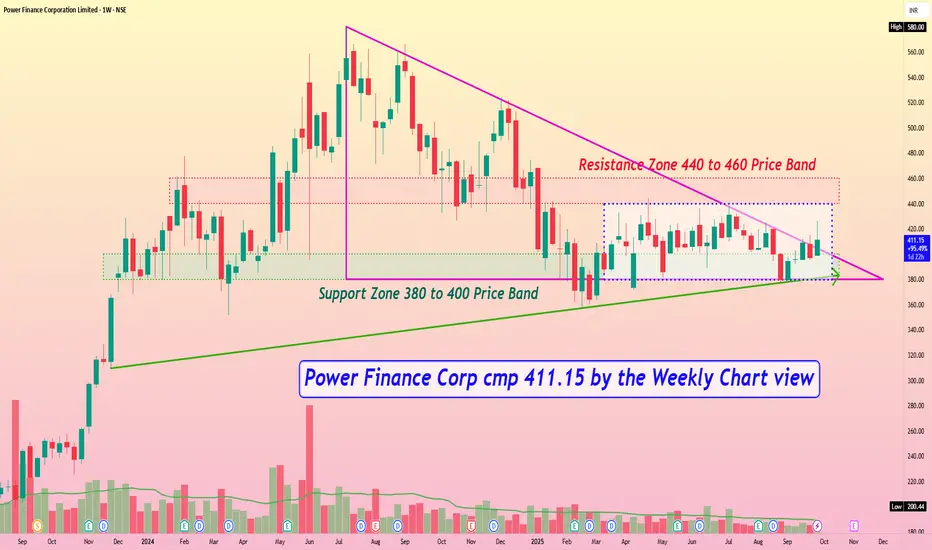
Power Finance Corp cmp 411.15 by the Weekly Chart viewPower Finance Corp cmp 411.15 by the Weekly Chart view
- Support Zone 380 to 400 Price Band
- Resistance Zone 440 to 460 Price Band
- Price traversing within Descending Triangle pattern after ATH
- Rising Support Trendline well respected by touch points since close to 2 years
- Price seen majorly trending inside Darvas Box since Mar 2025 in a range of 380 to 440
- Volumes in close sync with avg traded qty on Daily Chart and in steady stream by Weekly Chart
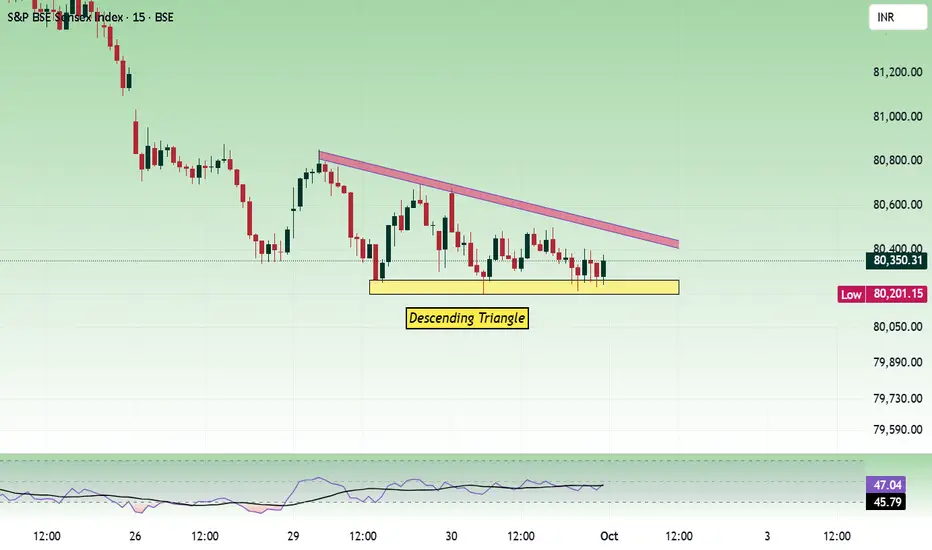
Sensex - Expiry day analysis Oct 1For the past two days, the price has been moving within the range of 80200 to 80800. And today's movement has formed a triangle pattern. Unless the range is broken, the movement can be choppy. Nearby support is seen at 80000. If 80k is broken, the next support is at the 79750 to 79820 zone.
Buy above 80320 with a stop-loss of 80200 for targets of 80400, 80520, 80640, 80760, and 80880.
Sell below 79960 with a stop-loss of 80100 for the targets 79840, 79760, 79640, 79520, 79400, and 79240.
If the
Nifty - Monthly Expiry Day Analysis Sep 30The price was holding the support at the 24600 zone and moved within the range of 24600 to 24800 today, forming a descending triangle in the process. 24600 is the trend direction deciding zone now.
Buy above 24660 with the stop loss of 24610 for the targets 24700, 24740, 24800, 24840, and 24880.
Sell below 24580 with the stop loss of 24620 for the targets 24540, 24500, 24460, 24420, and 24380.
Nearby support is at 24500, and resistance is at 24800. If the price does not gain strength, it will re
NETWEB: AI Infrastructure Goldmine ? Chart of the MonthNSE:NETWEB MarchingTowards 4,000: Is This the AI Infrastructure Goldmine You've Been Waiting For? Let's analyze in the "Chart of the Month".
As per the Latest SEBI Mandate, this isn't a Trading/Investment RECOMMENDATION nor for Educational Purposes; it is just for Informational purposes only. The chart data used is 3 Months old, as Showing Live Chart Data is not allowed according to the New SEBI Mandate.
Disclaimer: "I am not a SEBI REGISTERED RESEARCH ANALYST AND INVESTMENT ADVISER."
This a
Silver Bullish Breakout on Monthly & Weekly CharPattern Formed: Symmetrical Triangle (Long-Term Consolidation)
Breakout Type: Bullish Breakout on Monthly & Weekly Chart
Volume Confirmation: Strength in breakout with price expansion
Measured Move Target: ~$44 (based on triangle height projection)
Immediate Resistance Zone: $44.11 (Historical supply zone)
Support Levels Post-Breakout:
Immediate Support: $34.78
Strong Support: $33.28
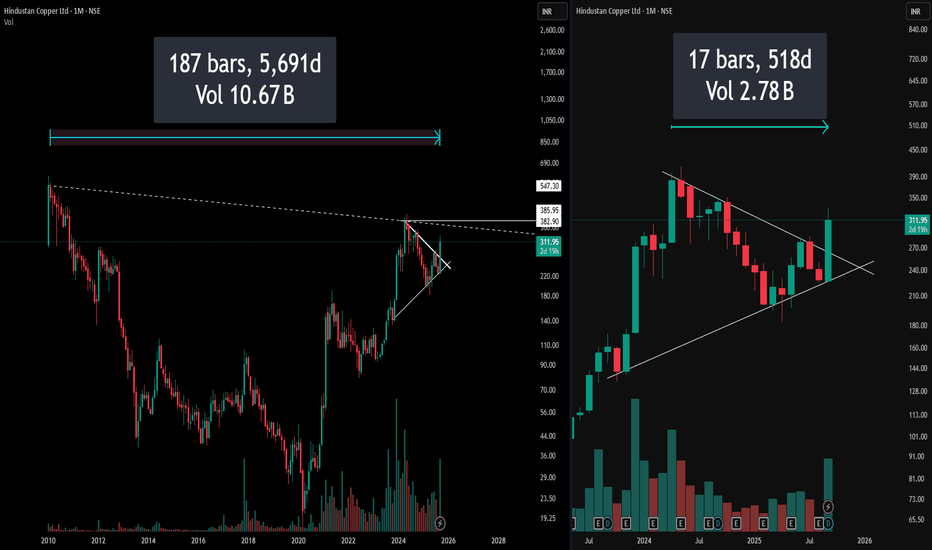
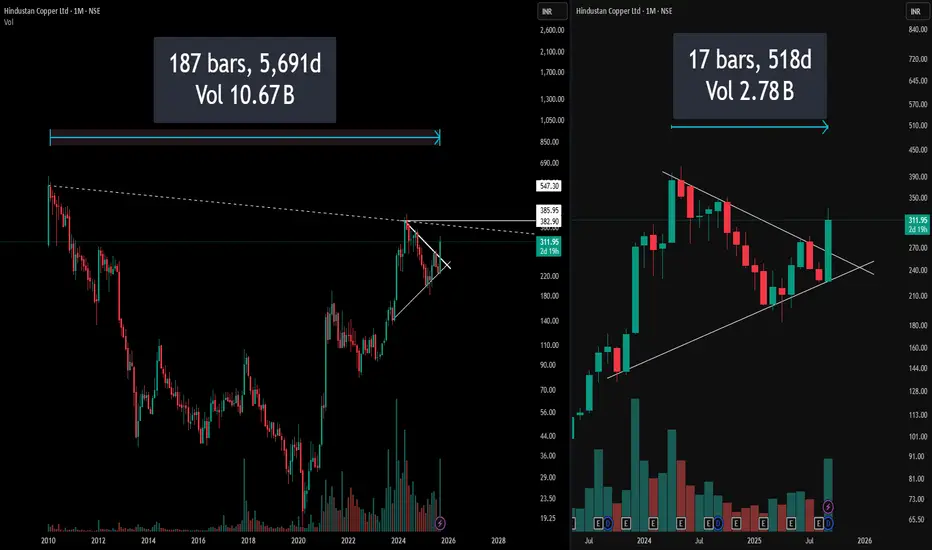
5000 Days vs 500 Days of Data : Which is better ?Most traders jump straight into attractive chart patterns and impulsively take trades, ignoring the bigger picture. Here’s a powerful case study
Left Side: Full Monthly Chart with Hidden Resistance
On the left, the chart captures over a decade of price action, immediately drawing attention to a long-standing downward-sloping resistance stretching from all-time highs. This hidden resistance line is not visible on the usual zoomed-in view, yet it presents a formidable barrier that traders often