SCHWSCHW has recently delivered a Triangle Pattern breakout within the context of a long-term parallel channel that has been forming over several years. This convergence of patterns suggests a potential shift in momentum and a likely resumption of the broader trend.
The breakout from the triangle indicates emerging bullish sentiment, but a decisive breakout above the 2-year high is still pending. This level is a critical resistance, and once breached, it could confirm the breakout’s strength and in
Triangle
Monthly Descending Triangle & False BreakdownA descending triangle on the monthly chart shows lower highs converging toward a flat support, reflecting mounting seller pressure and key institutional interest at the horizontal base
The red counter trendline highlights corrective rallies within the broader down-sloping resistance.
The red demand zone marks where significant buying absorbed prior declines, offering a structural support area.
The white box illustrates a false breakdown below support—a liquidity-grab that shook out weak hands
Gold .....Triangle pattern in the making ?Do you see what i see ?
Marked on the above chart are two triangular patterns which are identical in nature, one already formed and one in the making . if we break the sloping trend line on the upside, the targets mentioned is possible. stoploss for the trade will be the swing low of the structure which breaks the upper trend line. Plan your trade and then trade the plan.
This is just my view. Trade according to your risk management or consult your financial consultant before taking the trade.
XLong
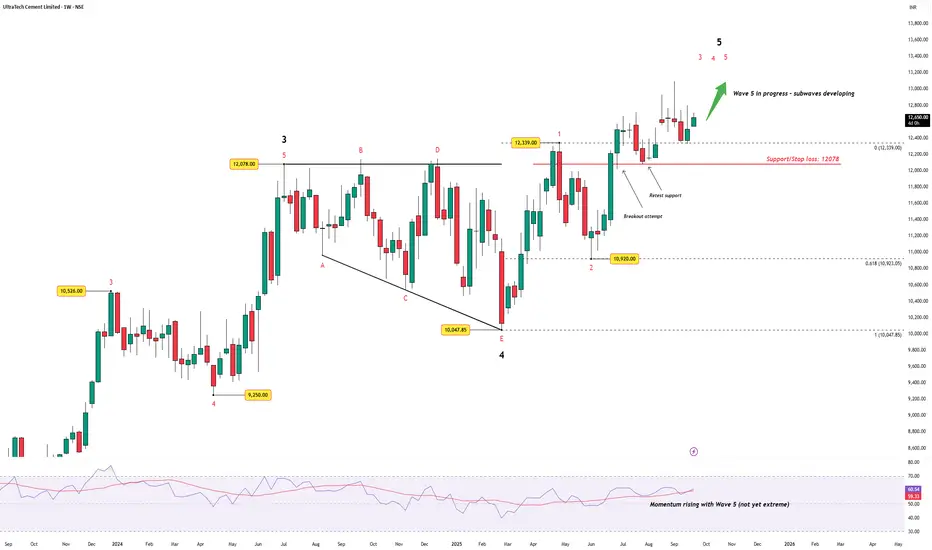
UltraTech Cement – Wave 4 Triangle Breakout, Wave 5 in MotionUltraTech Cement completed a higher-degree Wave 4 triangle between 12,078 and 10,047. The breakout from the E-wave low (10,047) kicked off Wave 5 .
The first breakout attempt above 12,339 was followed by a clean retest of support , keeping the structure intact.
Price is now carving out the internal subwaves of Wave 5.
Strict support / stop loss sits at 12,078 – below this, the bullish thesis fails.
RSI shows momentum rising but not yet at extreme levels – consistent with an unfolding
BANCOINDIA: BO after Consolidation, Chart of the WeekBanco Products Broke Out From a Consolidation, Continuing Its Massive Bull Run. Let's analyse in "Chart of the Week"
As per the Latest SEBI Mandate, this isn't a Trading/Investment RECOMMENDATION nor for Educational Purposes; it is just for Informational purposes only. The chart data used is 3 Months old, as Showing Live Chart Data is not allowed according to the New SEBI Mandate.
Disclaimer: "I am not a SEBI REGISTERED RESEARCH ANALYST AND INVESTMENT ADVISER."
This analysis is intended solel
XAUUSD - Flag PatternWhats your take on Guys.
#Institutions Consolidation going on - #Accumulation or #Distribution.
Kind of #Triangle #pattern in formation, ##Flagpattern. DO your analysis, Enter trade on Breakout and confirmation side. Trade with #confluence. i would say accumulate at bottom of pattern with SL and Participate in full swing before #Breakout.
Breakout - Looks Good On Chart - GRAPHITE📊 Script: GRAPHITE
📊 Industry: Industrial Products (Electrodes & Refractories)
Key highlights: 💡⚡
📈 Script is trading at upper band of BB.
📈 MACD is giving crossover .
📈 Crossover in Double Moving Averages.
📈 Right now RSI is around 63.
📈 One can go for Swing Trade.
📈 In Monthly Chart It Script is forming Symmetrical triangle and about to give breakout, we can see good rally in future.
⏱️ C.M.P 📑💰- 555
🟢 Target 🎯🏆 - 578 / 597
⚠️ Stoploss ☠️🚫 - 539
⚠️ Important: Always maintain your Risk
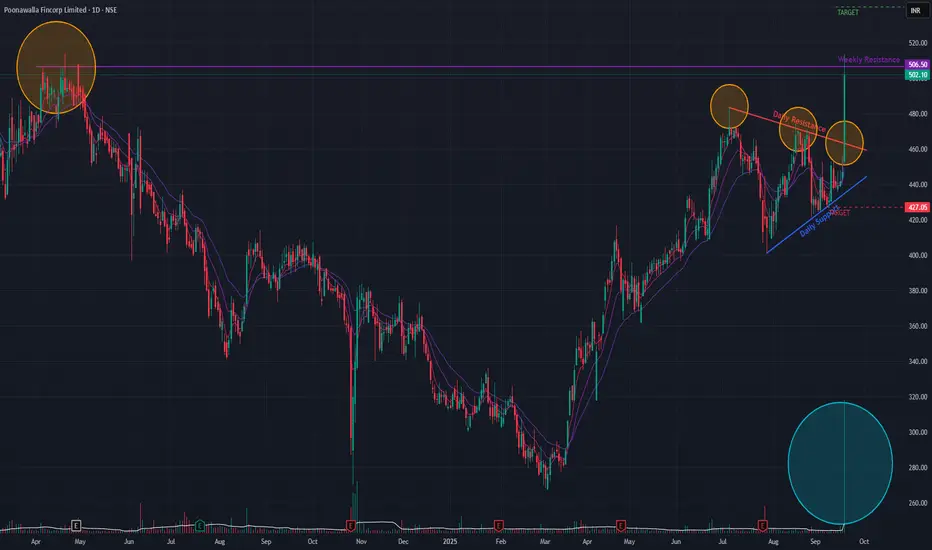
Poonawalla Fincorp (Daily) - Potential ATH ?Poonawalla Fincorp has shown a significant bullish development, decisively breaking out of a Triangle continuation pattern today. This breakout was marked by a substantial 12.30% surge in price , backed by exceptionally high trading volume.
This move signals a potential continuation of the bullish run that began in March 2025, which itself was a reversal of a downtrend initiated by a Double-Top bearish pattern in April 2024.
Bullish Confirmation Signals 👍
The positive outlook is supported
HYUNDAI : Breakout stock (Swing pick)#HYUNDAI #swingtrade #momentumtrade #breakoutstock #trendingstock
HYUNDAI : Swing trade
>> Breakout with Volume
>> Trending Stock
>> Momentum Trade
>> Volatility contraction seen
>> Good Strength in Stock
Swing Traders can lock profit at 10% and keep Trailing
Please Boost, comment and follow us for more Learnings.
Disc : Charts shared are for learning purpose only, not a Trade recommendation. Do your own research and consult your financial advisor before taking any position.
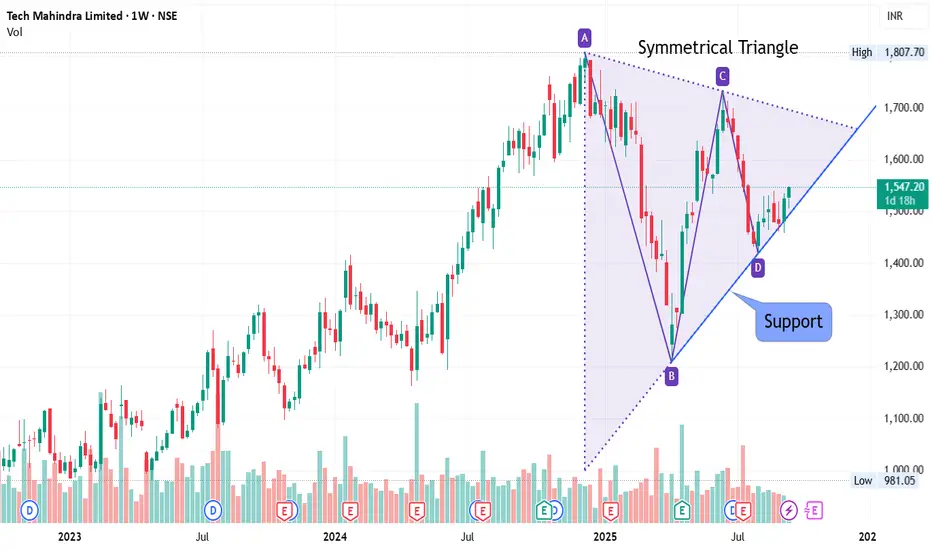
At Support - Weekly Chart - TECHM📊 Script: TECHM
📊 Industry: IT - Software (Computers - Software & Consulting)
Key highlights: 💡⚡
📈On Weekly Chart Script is forming symmetrical triangle and trading near support line.
📈 Script is trading at upper band of BB.
📈 MACD and Double Moving Averages are giving Crossover
📈 Right now RSI is around 58.
📈 One can go for Swing Trade.
⏱️ C.M.P 📑💰- 1547
🟢 Target 🎯🏆 - 1612 / 1655
⚠️ Stoploss ☠️🚫 - 1499
⚠️ Important: Always maintain your Risk & Reward Ratio.
✅Like and follow to never miss a
Aegis Logistics (Daily Timeframe) - Potential Breakout ??Following a strong uptrend that peaked in July 2024, Aegis Logistics entered a multi-month consolidation phase. Despite marking a new all-time high in January 2025, the stock lacked sustained upward momentum and has since formed a clear Symmetrical Triangle pattern . This pattern typically acts as a continuation signal, suggesting the prior uptrend is likely to resume.
Recent Bullish Momentum
This week, the stock has shown a significant surge in buying interest, rallying +14.05% on the bac
Ascending Triangle Breakout on #SBILIFE#SBILIFE is showing clear signs of a strong breakout from current levels.
The ascending trendline has supported the price since 09MAY25. The price continued to hold near the levels of 1855, with every red candle bought in.
Yesterday, i.e. 04AUG15 was a good day to initiate accumulation. In our view, price is expected to move sharply once the daily/weekly candle closes above 1860 with supporting volumes.
VoltasPrice is facing double top resistance at the 1434 - 1438 zone and had a pullback towards the 1410 zone. Nearby strong support is at 1400.
1400 and 1412 are buying(support) levels. Buy can be initiated depending on the price movement at these levels.
Buy above 1412 with the stop loss of 1400 for the targets 1422, 1430, 1442, 1454, and 1466.
If the price opens below 1410 and moves towards 1400, we can buy when the price shows bullish strength above 1400.
Price is bearish below 1400. Sell below 13
Multi-Pattern Mastery: Descending Triangle Meets Broadening FormThis chart demonstrates the power of multi-pattern recognition in technical study,showcasing how a descending triangle (white lines) can coexist with a broadening formation pattern (red ascending line with shared lower base). The descending triangle shows consistent lower highs against a stable support level, while the broadening pattern reveals expanding volatility through higher highs and the same lower boundary.
Patterns to Study :
Descending Triangles: Characterized by horizontal support
Dr. Reddy's (Weekly Timeframe) - Potential BreakOut?Dr. Reddy's Laboratories is currently in a phase of strategic consolidation. After a remarkable 93.63% uptrend that began in March 2022, the stock has settled into a well-defined triangle formation since August 2024. This pattern suggests a temporary equilibrium between buyers and sellers as the market digests previous gains.
The technical underpinnings remain constructive. The Positive Crossover (PCO) in the short-term EMAs provides a bullish undercurrent, and the resilience of key support l
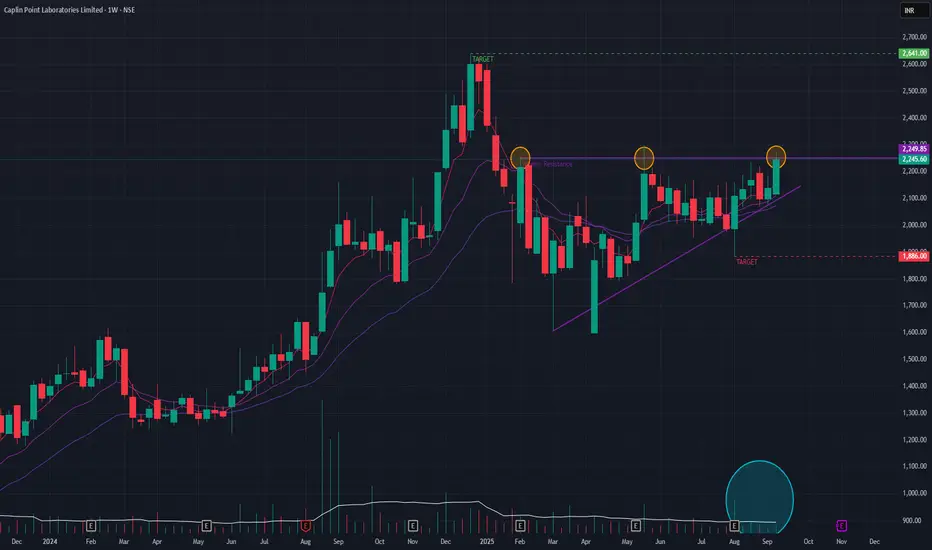
Caplin Point (Weekly Timeframe) - Will the uptrend continue ?After a brief downtrend, Caplin Point has formed a classic triangle pattern , which often acts as a continuation signal for the preceding long-term uptrend. Technical indicators are favorable, with the short-term EMAs arranged in a bullish formation that signals strong underlying momentum.
The one element of caution is that recent trading volumes have been average. Therefore, a breakout from the triangle must be accompanied by a significant increase in volume to validate buyer conviction. If
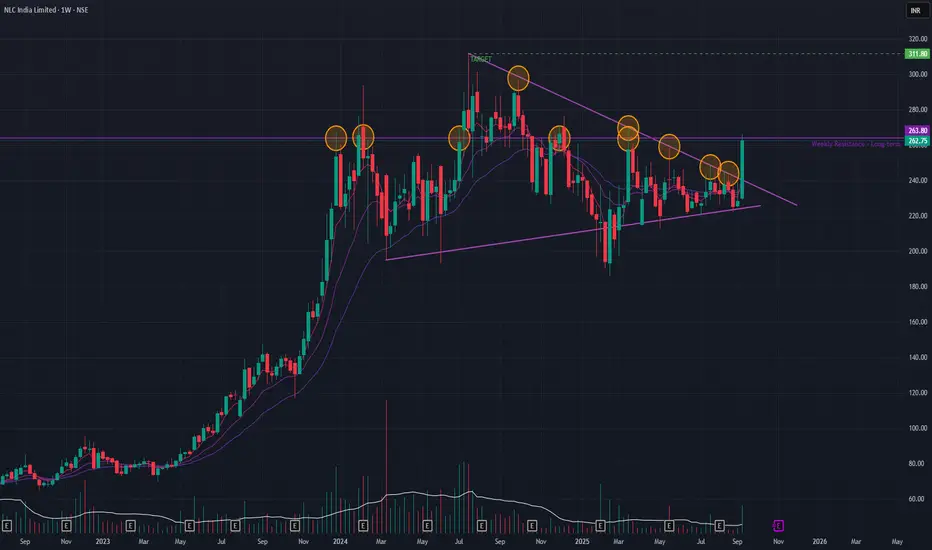
NLC India Ltd (Weekly Timeframe) - Potential BreakOut & ATH ??Following its all-time high, NLC India has been consolidating in a sideways pattern, which can be interpreted as a bullish triangle formation—often a precursor to an uptrend continuation. This thesis was strongly supported this past week by a powerful +14.97% rally on a massive volume spike, indicating a potential end to the consolidation phase.
However, the stock is now confronting a formidable, long-term horizontal resistance level that has been in place for over a decade (since December 20
Gulf Oil (Weekly Timeframe) - Potential BreakOut & ContinuationTechnical analysis of Gulf Oil reveals a promising setup. The stock has formed a classic triangle pattern , indicating a period of consolidation before a likely continuation of its preceding uptrend. This week, we've observed a significant breakout attempt, which is notable as it follows multiple rejections from the pattern's upper trendline.
For this breakout to be considered valid, it must be accompanied by a surge in trading volume , confirming buyer conviction. If these conditions are met
ABDL (Daily Timeframe) - Can it continue the uptrend ??ABDL is in a confirmed uptrend, having rallied over 90% since its April 2025 lows. The stock is now consolidating within a bullish triangle pattern , which typically signals a continuation of the prior trend.
This bullish outlook is supported by several key factors:
Today's significant price surge was accompanied by a massive spike in volume, confirming strong buyer interest and a potential breakout.
The short-term Exponential Moving Averages (EMAs) are in a Positive Crossover (PCO) sta
Ascending Triangle Pattern in Technical Analysis The Ascending Triangle is a bullish continuation pattern. It forms when the price creates higher lows (🔼) while facing consistent resistance at the same horizontal level (🔴).
🧐 How to Identify It
Flat Resistance Line 🔴
Price hits the same level multiple times and gets rejected.
This creates a horizontal line on top.
Rising Support Trendline 🔼
Each dip forms a higher low, indicating buying pressure.
Connect the swing lows with a rising trendline 📈.
📊 How to Trade
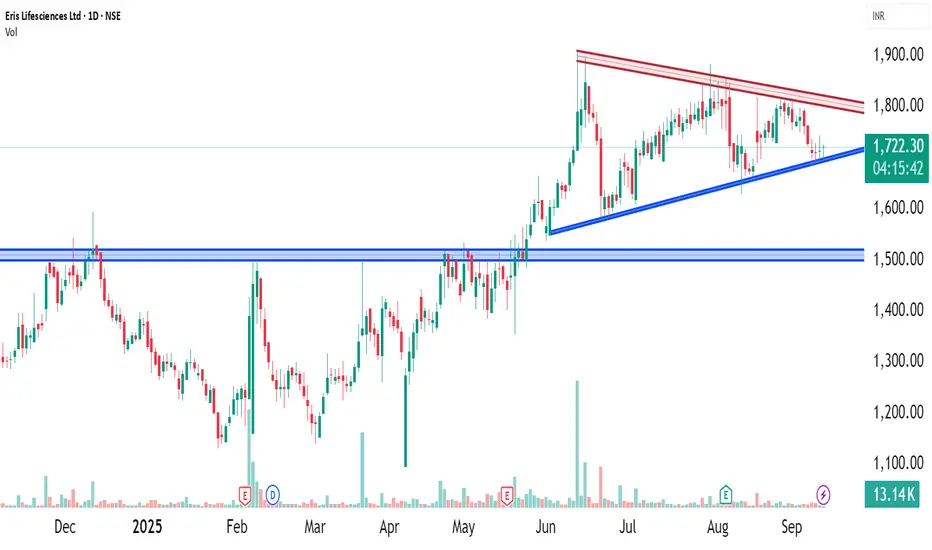
Eris Lifesciences Ltd: Symmetrical Triangle FormationEris Lifesciences Ltd . is currently exhibiting a Symmetrical Triangle Pattern on its daily chart. This pattern is characterized by converging trendlines formed by lower highs and higher lows, indicating a period of consolidation. While symmetrical triangles often serve as continuation patterns, they can also signal potential reversals, depending on the breakout direction.
The pattern's apex is approaching, suggesting that a breakout—either upward or downward—is imminent. It's crucial to moni