Nested Bullish Patterns Signal Major Breakout!Script: NSE:SUPREMEIND | Timeframe: Daily | Analysis Type: Technical (Pure Price Action) | Patterns: Symmetrical Triangle + Cup & Handle
Idea Summary 💡
A powerful, nested pattern setup is concluding on the daily chart! A large Symmetrical Triangle contains a secondary Cup and Handle (Bullish) pattern. This rare confluence signals strong accumulation and suggests an imminent, powerful upside breakout is likely!
Chart Pattern Logic 🔍
Primary Pattern (Symmetrical Triangle): Characterized by desce
Triangle
Sensex - Expiry day analysis Aug 19Today price opened gap up and faced resistance at the 81800 zone and fell down. The 81800 zone is a strong resistance, and the 80700 zone is strong support. Price can move within this range if it does not gain strength.
Price has formed a descending triangle pattern and also looks bearish.
Buy above 81500 with the stop loss of 81380 for the targets 81600, 81720, 81880, 81980, 82100, and 82240.
Sell below 81180 with the stop loss of 81320 for the targets 81060, 80920, 80840, 80700 and 80580.
Alwa
Nifty 50 Intraday Expiry for 14/08/25 ⚡ Trade Setups with Precise Stop Loss Rules
A) BULLISH BREAKOUT (PREFERRED):
✅ Trigger: Hourly candle CLOSE > 24,700 (breakout confirmation).
🎯 Targets:
T1: 24,800
T2: 24,950 (triangle high)
❌ STOP LOSS: Below the LOW of breakout candle (e.g., if breakout candle low = 24,685, SL = 24,684).
B) BEARISH BREAKDOWN:
✅ Trigger: Hourly candle CLOSE < 24,465 (breakdown confirmation).
🎯 Targets:
T1: 24,350
❌ STOP LOSS: Above the HIGH of breakdown candle
🚫 STRICT NO-TRADE ZONES (NTZ):
Upper NT
BSE Ltd cmp 2482 by Daily Chart viewBSE Ltd cmp 2482 by Daily Chart view
- Support Zone 2270 to 2345 Price Band
- Resistance Zone 2525 to 2585 Price Band
- Descending Triangle pattern Breakout seems sustained
- Stock seems trading within price range indicating Darvas Box setup
- Volumes seen gradually syncing closely with the average traded quantity
- Most known Technical Indicators BB, EMA, MACD, RSI, SAR seem trending positively
Muthoot Fin. bounce from Polarity LevelsNSE:MUTHOOTFIN made a good bounce from Polarity Levels with a huge candle again with high Volumes and closing above 50 DEMA, taking Support of 200 DEMA.
On the back news of the finance ministry seeking relaxation in the new rules on gold loans proposed by the central bank, they proposed that small ticket borrowers below 200,000 rupees should be excluded from the tighter rules to ensure speedy disbursements.
Price Action & Volume Analysis:
The stock has been consolidating in a well-defined
SARDAEN: Triangle Breakout, Chart of the WeekWhy NSE:SARDAEN Triangle Breakout Could Signal the Next Big Move in it, let's analyze in "Chart of the Week" Post Strong Q1 FY26 Results
As per the Latest SEBI Mandate, this isn't a Trading/Investment RECOMMENDATION nor for Educational Purposes, it is just for Informational purposes only. The chart data used is 3 Months old, as Showing Live Chart Data is not allowed according to the New SEBI Mandate.
Disclaimer: "I am not a SEBI REGISTERED RESEARCH ANALYST AND INVESTMENT ADVISER."
This an
BLUE STAR LTD - Technical Analysis | Triangle Pattern ________________________________________
📊 BLUE STAR LTD – Beginner-Friendly Technical & Fundamental Snapshot
Ticker: NSE:BLUESTARCO | Sector: Consumer Durables
CMP: ₹1,827.50 ▲ (+3.23%) (as of August 7, 2025)
Chart Pattern: Symmetrical Triangle
Technical View: ⭐⭐⭐⭐ Neutral-to-Positive (Educational Purpose Only)
________________________________________
🔍 What’s Happening on the Chart?
BLUE STAR has formed a Symmetrical Triangle – a pattern where price moves within narrowing highs and lows 📉📈
Thi
NVDAPrice is consolidating in the form of a symmetrical triangle. 180 is an important zone. Sustaining above this is important to be bullish.
Buy above 180.5 with the stop loss of 179 for the targets 182, 183.5, 185, and 187.5
A symmetrical triangle can give a breakout in any direction. Price will become bearish below 177.
Always do your analysis before taking any trade.
JSWENERGY | Symmetrical Triangle Breakout in Progress?Description:
JSW Energy is forming a symmetrical triangle on the daily chart after a downtrend — resembling a potential bearish pennant, but price structure, sloping EMAs, rising momentum, and positive EFI hint at bullish strength.
📌 Breakout Level: ₹534
📉 Stoploss: ₹519 (ATR-based)
🎯 Targets: ₹563 → ₹597 → ₹694 (as per Fib projections)
🧭 Macro Context:
- Infra & Energy sectors improving
- Govt push for renewables
- Dollar weakening, risk-on tone aiding sentiment
Structure, volume, and ma
MAXHEALTH – Symmetrical Triangle Breakout________________________________________________________________________________
🧠 MAXHEALTH – Symmetrical Triangle Breakout
📌 Chart Overview
Symbol: `MAXHEALTH` (NSE)
Timeframe: 1D (Daily)
Pattern Identified: 🔺 Symmetrical Triangle
Breakout Confirmation: ✅ Bullish Engulfing
Volume on Breakout: 1.61M (above average)
________________________________________________________________________________
📊 Technical Breakdown (For Educational Use Only)
🔹 Between June and August, MAXHEALTH co
JSW ENERGY - SwingJSW Energy is transitioning aggressively toward renewables, with investments in solar, wind, energy storage, and green hydrogen.
P/E ratio stands at 46.36, indicating a premium valuation compared to the sector average of 32. While growth is underwhelming, the company maintains good asset quality. Debt levels are manageable, and promoter holding remains strong.
The stock recently showed consolidation between 510 - 530, with support near ₹500 and strong resistance around 540. Technical indicat
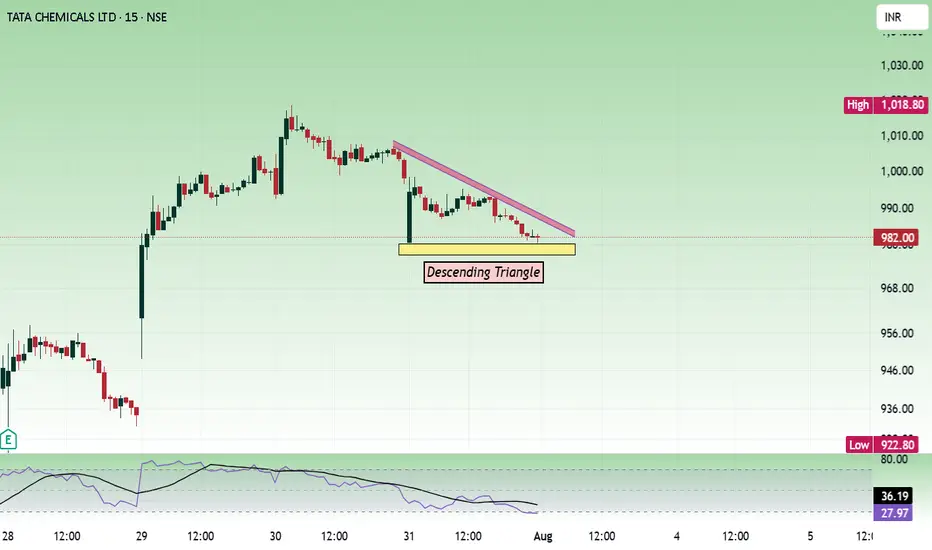
TatchemicalsPrice is consolidating in a narrow range and forming a triangle. 980 is a support zone and price can move up.
Buy above 980 with the stop loss of 972 for the targets 988, 996, 1004 and 1016.
Sell below 958 with the stop loss of 966 for the targets 950, 942, 936 and 928.
Always do your own analysis before taking any trade.
Nifty - Monthly Expiry Analysis July 31Price is facing resistance at 24900 zone. If price sustains above it, the next resistance is at 25000 psychological zone. 24900 to 25000 can be choppy if price can not gain strength to move up.
Buy above 24920 with the stop loss of 24870 for the targets 24960, 25000, 25060, 25120 and 25200.
Sell below 24800 with the stop loss of 24850 for the targets 24760, 24720, 24660, 24620 and 24560.
Always do your own analysis before taking any trade.
INTERARCH : Swing Pick (1-3 Months)#INTERARCH #vcppattern #chartpattern #ascendingtrianglepattern #breakoutstock #patterntrading #Swingtrading
INTERARCH : This will test Patience
>> VCP formation in process
>> Ascending Triangle forming
>> Breakout candidate
>> Good Strength & Volumes Dried up
>> Trending Stock in consolidation
Swing Traders can lock profits at 10% & Keep Trailing
Pls Comment , Boost and Follow for more such Analysis
Disc : Charts shared are for Learning Purpose and not a Trade recommendation, Consult your F
BALAJEE - Descending Triangle Meets Multi-Pattern ConfluenceOn the daily chart of Balajee, price action has formed a descending triangle right at the lower end of the trend:
🔻 Lower highs consistently pressuring horizontal support.
🟩 Price sitting within a clear demand zone, adding significance to the structure.
📊 Volume tapering off through consolidation, a classic triangle trait.
📐 Presence of a hidden counter-trend line (dotted) hinting at a potential broadening formation — showing a rare multi-pattern overlap.
Such setups are important not for pred
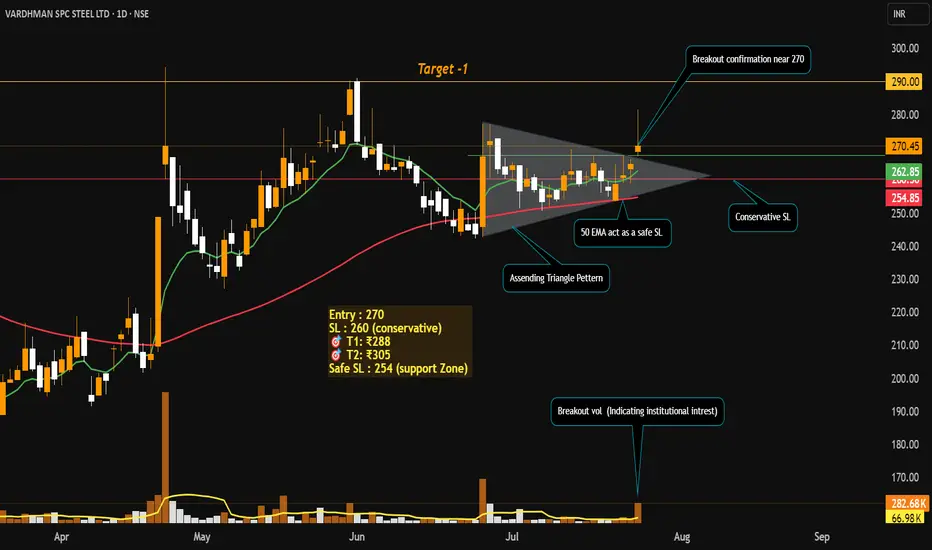
Swing Trade Idea: Vardhman Special Steels Ltd (NSE: VSSL)Technical Setup
Ascending Triangle Breakout on Daily Timeframe
Volume Spike 4x average volume on breakout day — strong institutional confirmation.
both the EMAs Bullish crossover (Price trading above both the EMAs).
RSI showing bullish momentum (60-65).
Price Action Strategy
Price broke out from resistance zone with strong bullish candle and closed near the high.
Previous resistance of ₹270 now acts as support.
Fundamentals
Promoter Holding: High, backed by Aichi Steel (Toyota Group).
Deb
Blackbuck = Zinka Logistics cmp 468.55 by Daily Chart view sinceBlackbuck = Zinka Logistics cmp 468.55 by Daily Chart view since listed
- Support Zone 429 to 450 Price Band
- Resistance Zone 480 to 500 Price Band
- Symmetrical Triangle Breakout been attempted
- Closely considerate VCP pattern formation seems done
- Volumes are in close sync with the average traded quantity
- Technical Indicators BB, EMA, MACD, RSI, SAR showing positive trend
Vimta Labs Ltd (Weekly Timeframe) - Potential BreakoutThis week, the stock has breached the resistance zone and made a new All Time High with huge volume. In Daily Timeframe, the stock has clearly been forming an Ascending Triangle Pattern which is a Bullish pattern. If the stock breaches the resistance zone with good volume, then it may reach new All Time Highs of 780 range.
Awaiting further Price Action.
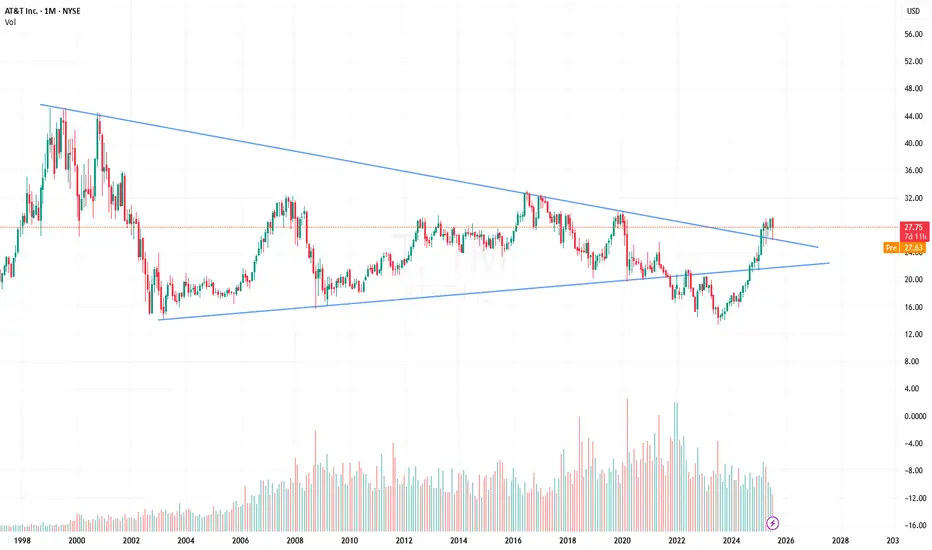
AT&T Inc BREAKOUTAT&T Inc Share has broken its previous pattern after a strong bullish move. It increased by 100% in two years, from 14 to 27, and now it’s breaking out with a big bullish monthly candle. Due to this strong upward momentum over the past few years, the stock might consolidate for a while before moving higher. This means the upward move could take some time or even a year, so we should keep that in mind when swing trading or investing.
The target and stoploss levels depend on each person’s risk ap
UPL LTD BREAKOUTUPL LTD has broken through its weekly trend line and is now showing bullish momentum after a short period of consolidation. The next target is the all-time high, which traders may aim for. A suitable stop-loss could be placed at either 650 or 600, depending on individual risk appetite.
On the financial front, UPL's latest quarterly results for the period ending March 2025 show solid performance. The company reported a revenue of Rs 15,573 crore, along with a net profit of Rs 1,106 crore. Its E