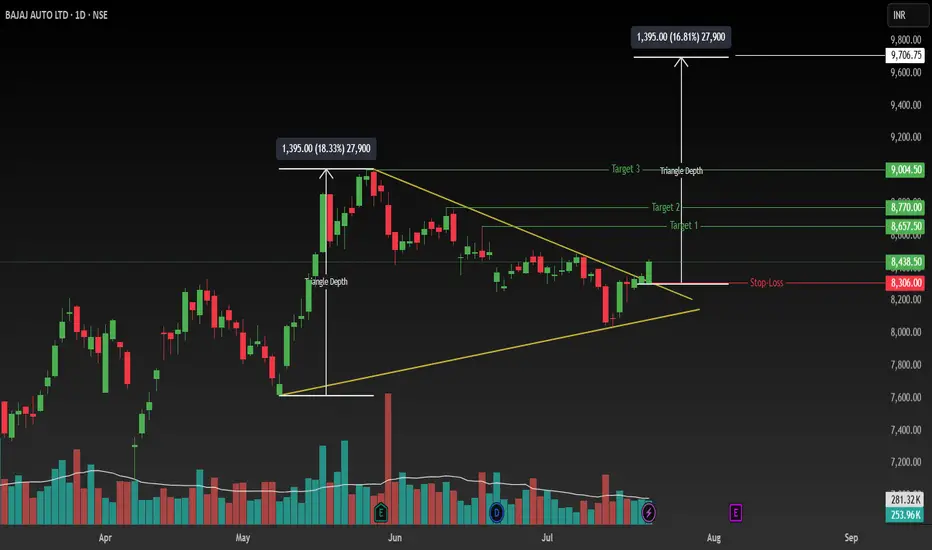
Bajaj Auto Ascending Triangle Breakout: ₹8,650 → ₹9,700🔎 Study: This analysis is based on the daily timeframe, focusing purely on price action and chart patterns—no indicators, no news.
📈 Pattern: Symmetrical triangle formed since May 2025.
🔹 Breakout Signal: Today’s daily candle closed decisively above the upper trendline, confirming the triangle breakout.
🔹 Entry:
• Buy around ₹8,420–8,450 once price sustains above the broken trendline.
🔹 Stop‑Loss:
• Place at ₹8,306 (today’s low) to invalidate the breakout on a downside close.
🔹 Profit Targe
Triangle
GOLD (XAUUSD) 4H Analysis – Breakout Imminent from Rising Wedge!Gold is currently trading at 3353.39 after completing a well-defined ABCDE rising wedge structure on the 4H chart. The market is showing signs of exhaustion near the 3353–3373 resistance zone, with a potential bearish rejection likely to follow.
🔍 Key Highlights:
Pattern: Rising Wedge (ABCDE complete) – a classic bearish reversal setup.
Sell Zone: 3353.88 to 3371.62 – Expect high volatility and sharp rejection.
Target: 3296.36 – Marked as the first major support zone.
Risk Management: Stron
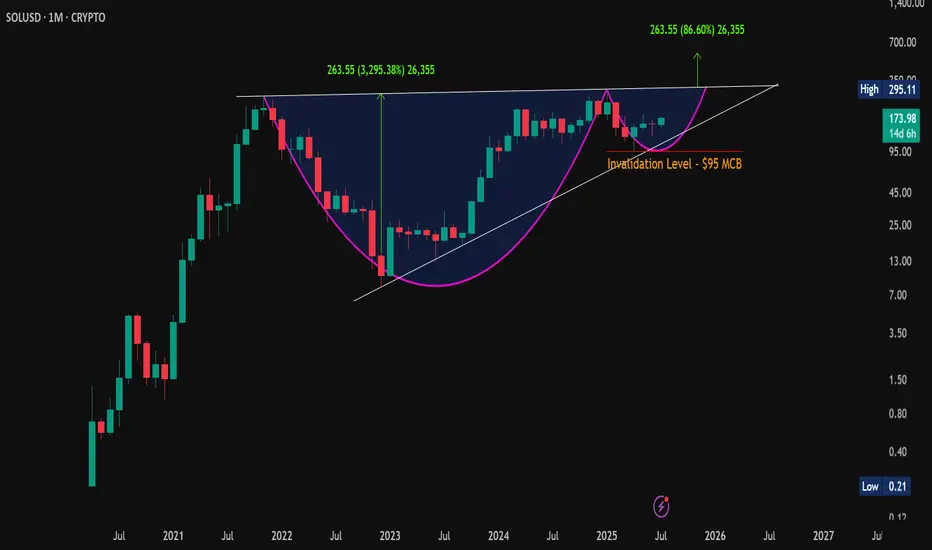
Solana Long-Term Cup & Handle | +300% Potential🔍 #OnRadar | #Crypto
#SOLUSD (#Solana)
Solana Long-Term Cup & Handle | +300% Potential
CMP: $174
Support Zone: $123.00 – $100.00
Pattern Invalidation Level: $95 (MCB - Monthly Closing Basis)
📊 Technical Overview:
Solana (SOLUSD) is showing signs of a long-term Cup & Handle pattern forming on the higher timeframes.
☕️ Cup formation appears complete.
📐 Handle is likely developing within an Ascending Triangle .
🔄 Neckline Resistance: ~$305
🎯 Potential Target on Br
ManOrg: Symmetrical Triangle Tightens – Big Move Ahead?🔎 #OnRadar
#ManOrg (Mangalam Organics Ltd.)
Symmetrical Triangle Tightens – Big Move Ahead?
CMP: 516.65
📈 Technical Outlook (Monthly Chart | For Educational Purpose Only):
#SymmetricalTriangle pattern appears to be forming on the monthly timeframe.
The price has faced repeated resistance near the falling trendline around 629 and is currently showing signs of a possible retracement towards the lower end of the triangle. The key support zone lies between 473–378 .
If this zon
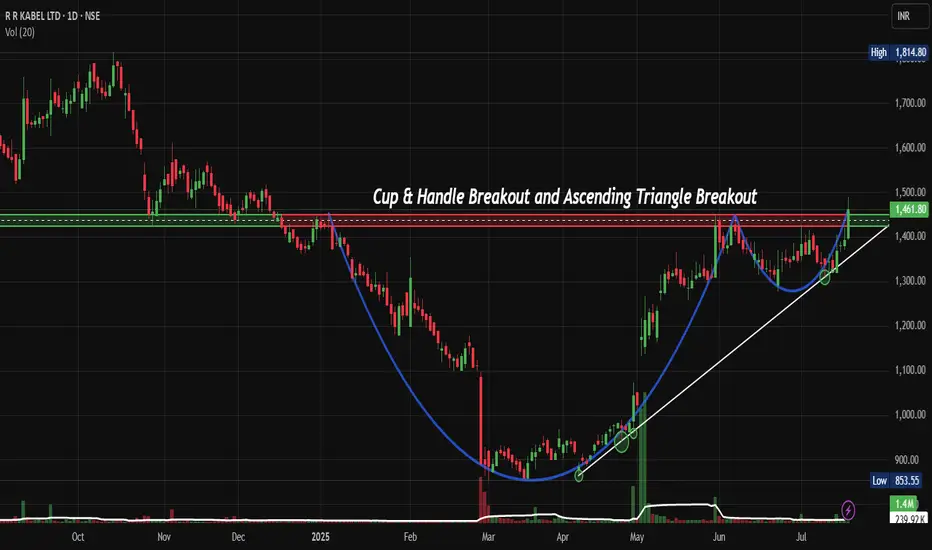
RRKABEL: Cup & Handle Pattern Could Trigger 30% Upside RallyNSE:RRKABEL Perfect Storm: How Cup & Handle Pattern Could Trigger 30% Upside Rally
Price Action Analysis:
Candlestick Patterns:
- Doji Formation: Multiple doji candles during handle formation indicate indecision and potential reversal
- Bullish Engulfing: Strong bullish engulfing pattern on breakout day, showing buying pressure
- Higher Highs/Lows: Clear pattern of higher highs and higher lows post-breakout
- Rejection Candles: Long lower wicks during handle formation show buying support
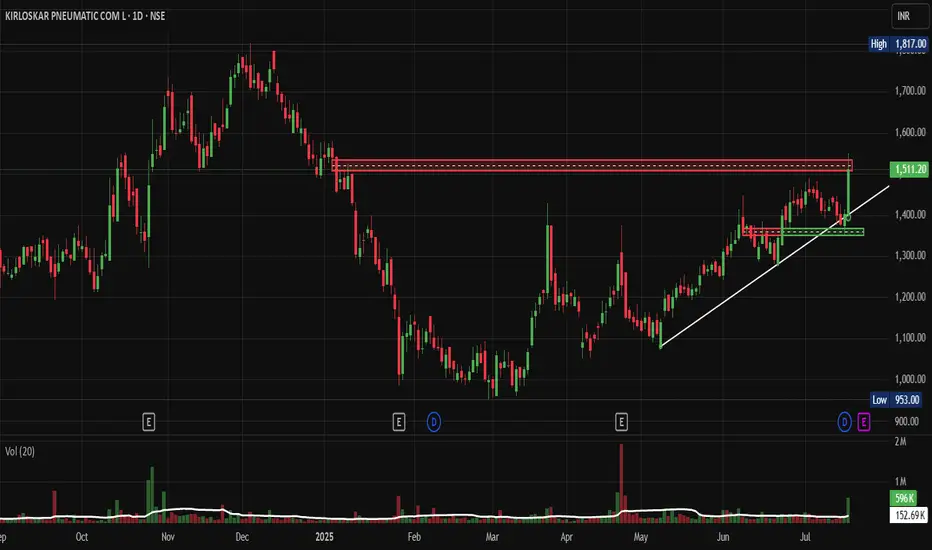
KIRLPNU: Technical Breakout Attempt That Could Deliver 25% ReturNSE:KIRLPNU : A Technical Breakout Attempt That Could Deliver 25% Returns
Price Action Analysis:
- Current Price: Rs 1,511.20
- Day's High: Rs 1,817.00
- Day's Low: Rs 953.00
- Volume: 152.69K shares
Volume Spread Analysis:
Volume Profile:
- Significant volume spike during recent breakout attempt
- Volume during consolidation was relatively lower
- Current volume suggests institutional buying
- Volume trend supports price movement authenticity
Volume Indicators:
- Volume surge abov
Massive Symmetrical Triangle on Kakatiya Cement – Eyes on 599?🔎 #OnRadar
#Kakatcem (Kakatiya Cement Sugar & Industries Ltd.)
CMP: 166.40
📈 Technical Outlook (Monthly Chart | For Educational Purpose Only):
A #SymmetricalTriangle pattern appears to be forming on the monthly timeframe.
📌 Price took support near the rising trendline (~130) and is now showing signs of recovery. If momentum sustains, the stock may head toward the falling trendline resistance of the triangle.
A monthly close above the falling trendline could indicate a potential
$SUI Daily Chart Analysis
Price is tightening within a large symmetrical triangle pattern on the 1D chart, signaling a major move brewing in the coming weeks.
🔹Price currently pushing toward upper trendline resistance near $4.00
🔸Upside Potential: Break above $4.20 could trigger a rally toward $5.00–$5.30+
🔹Pattern target (if breakout confirmed): roughly $6.00+ based on pole height
🔸Support at $3.20 is key triangle base
🔹Breakdown below = bearish continuation risk toward $2.50
#SUI is coiling within a triang
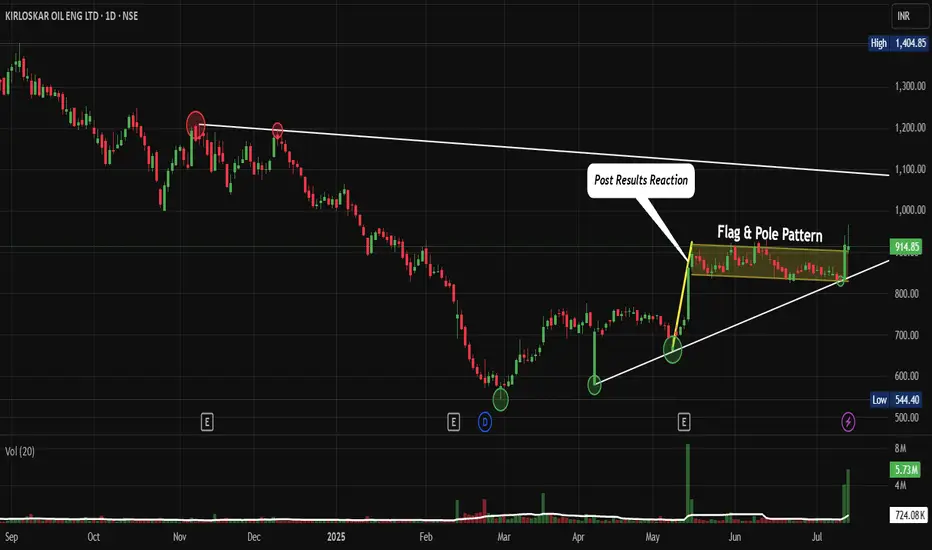
KIRLOSENG: Post-Results Breakout and Consolidation. F&P PatternNSE:KIRLOSENG : How This Hidden Gem Could Be Your Next Big Winner After Post-Results Breakout and Consolidation Let's Analyze in my "Chart of the Week"
Price Action:
- The stock shows a classic recovery pattern from March 2025 lows around ₹590-600
- Current price at ₹914.85 represents a significant 52% recovery from the March bottom
- The stock has been forming higher lows since March, indicating underlying strength
- Recent breakout above the ₹850 resistance level with strong volume confirm
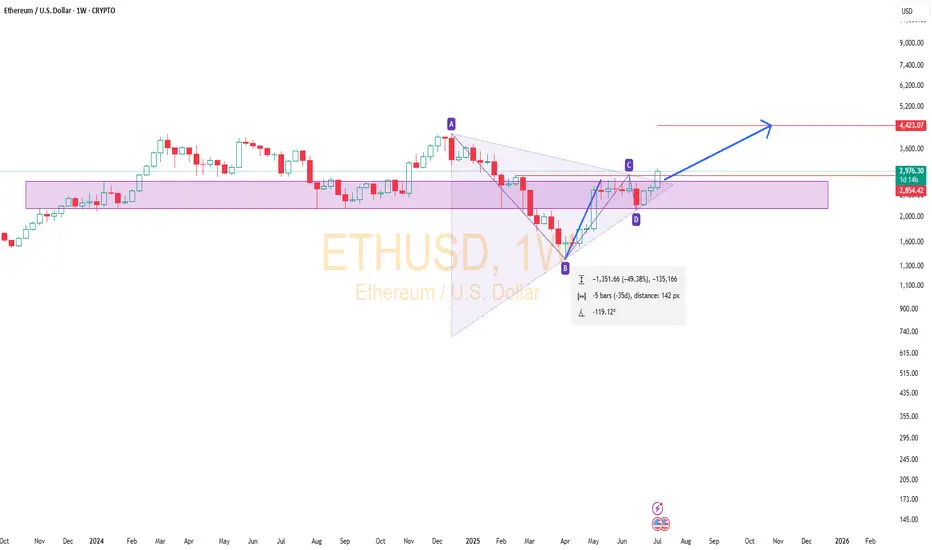
ETHUSD📈 BITSTAMP:ETHUSD Weekly Chart | CMP: $2975
✅ Flag breakout above $2750
✅ Triangle breakout confirmed
📉 Previous range: High $4105 (Dec 2024) – Low $1385 (Apr 2025)
With current breakout holding, if $2290 (weekly close) holds as stop loss,
🎯 Target: $4430 in 12–18 months
Structure looks strong for long-term upside.
#ETH #Ethereum #Crypto #Altcoins #ChartAnalysis
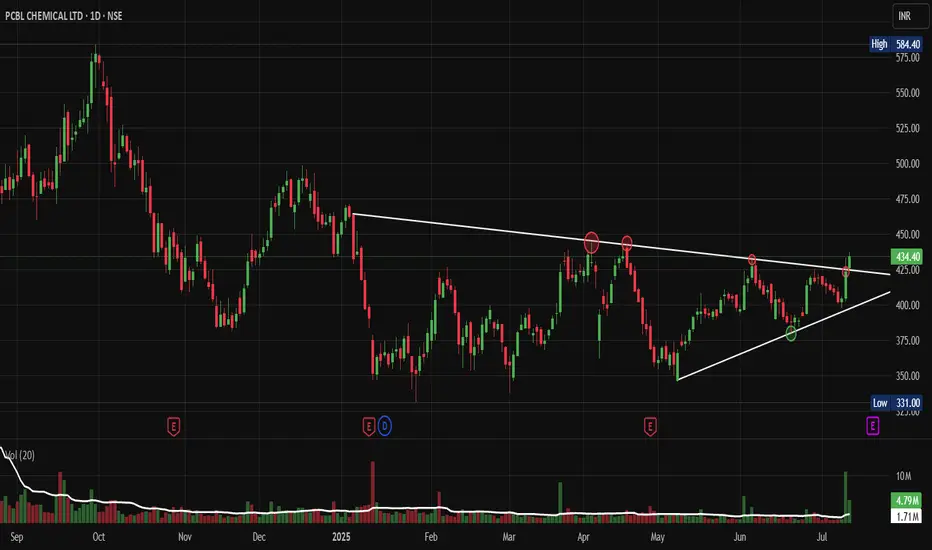
PCBL: The Sleeping Giant Ready to BreakOut of Its TriangleNSE:PCBL : The Sleeping Giant Ready to Break Out of Its Consolidation Triangle
Price Action Analysis:
• Stock has been trading in a well-defined ascending triangle pattern since early 2025
• Current price at ₹434.40 represents a +2.53% gain, showing bullish momentum
• The pattern shows a higher low formation with resistance around ₹450-460 levels
• Recent price action suggests an accumulation phase with controlled volatility
Volume Spread Analysis:
• Volume has been consistently above aver
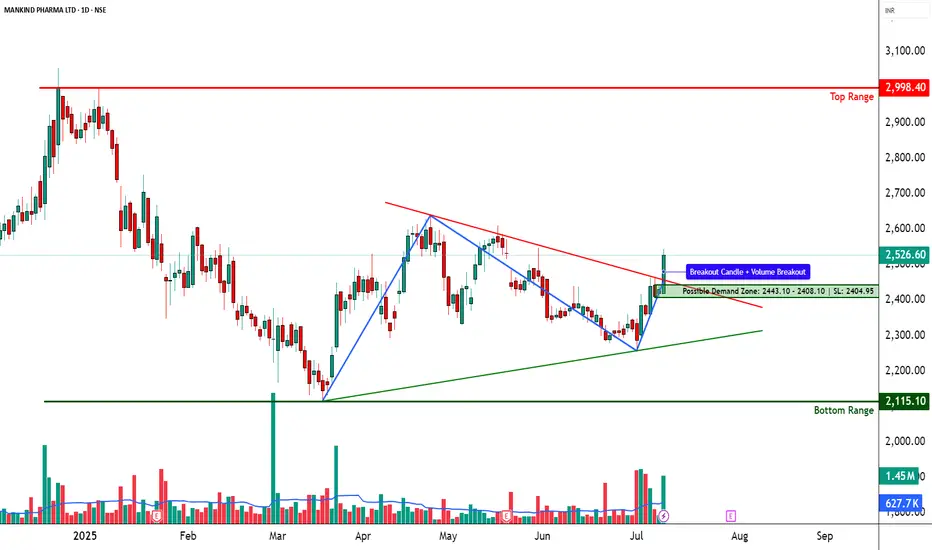
MANKIND PHARMA – Descending Triangle Breakout________________________________________________________________________________📈 MANKIND PHARMA – Falling Trendline Breakout | Strong Reversal Candle | Volume Spike
🕒 Chart Type: Daily Chart
📆 Date: July 9, 2025
________________________________________________________________________________
📌 Price Action:
MANKIND PHARMA has executed a decisive breakout above a falling trendline on the daily chart, breaking out of a multi-week descending structure. The price action had been consolidating withi
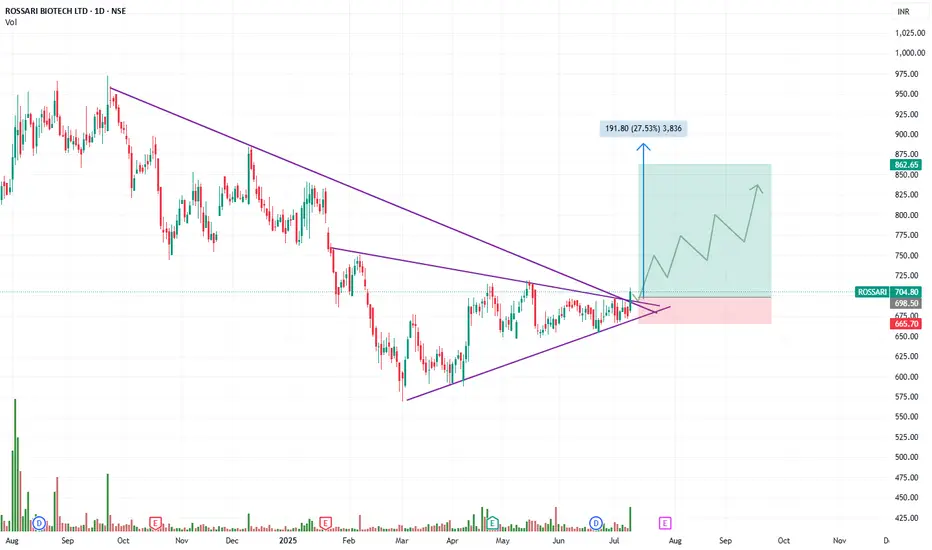
Rossari Biotech Long setup 1:5 RR (Textile chemical sector)
Buy Rossari Biotech long setup
Between 700-710
Stop loss: 665
Target 1: 765
Target 2: 830
Target 3: 862
Trade as per your risk-taking capacity.
Triangle Pattern and trend line breakout with volume
They are among the largest manufacturers of textile specialty chemicals in India.
If US-India trade deal benefits textile sector, this will start running.
PCBL – Breakout from Symmetrical TriangleNSE:PCBL
📈 PCBL – Breakout from Symmetrical Triangle | Bullish Momentum Building 🚀
📌 Symbol: PCBL CHEMICAL LTD – NSE
🕒 Timeframe: Daily
💰 CMP: ₹431.85 (+6.80%)
📆 Date: July 9, 2025
🔷 Technical Summary:
PCBL has given a strong breakout above a well-formed *symmetrical triangle* with significant volume support. Price action indicates trend reversal from a long-term falling channel.
✅ Key Bullish Signals:
• Symmetrical triangle breakout above ₹425
• Bullish engulfing candle with 271
Bajaj Auto: Wave 4 Triangle Nearing CompletionAfter completing a complex W-X-Y-X-Z correction earlier this year, Bajaj Auto appears to have started a fresh impulsive rally. The move from 7,089 to 9,004 looks like a 5-wave structure in progress, with the chart now suggesting Wave 4 is unfolding as a contracting triangle.
Wave E of the triangle seems close to completion near the lower boundary.
SMA100 is aligned with this support zone, potentially offering additional footing for price.
The Fibonacci retracement zone (Wave 1–3) lies betwe
MAHSEAMLES - Symmetrical Triangle Breakout📊 MAHSEAMLES – Symmetrical Triangle Breakout | RSI Bullish | Volume Surge | Daily Timeframe
📅 Chart Date: June 26, 2025
📈 CMP: ₹736.55 (+7.20%)
📍 Ticker: NSE:MAHSEAMLES
🔍 Technical Analysis Overview
🔺 Symmetrical Triangle Breakout
After months of consolidation within a symmetrical triangle pattern, MAHSEAMLES has broken out with a strong bullish candle
Breakout level: Above ₹725, confirmed with strong price momentum
Breakout marks potential trend reversal and beginning of new bullish phase
📊 V
JSW Energy - symmetric triangle chart patternJSW Energy - under the formation of symmetric triangle chart pattern, it is near to breakout level, one can go long (short term) here, stop loss and targets are mentioned in the chart.
Please note: I am not a certified stock analyst, this chart is purely for education purpose, request you to do your own financial assessment before investment/trade.
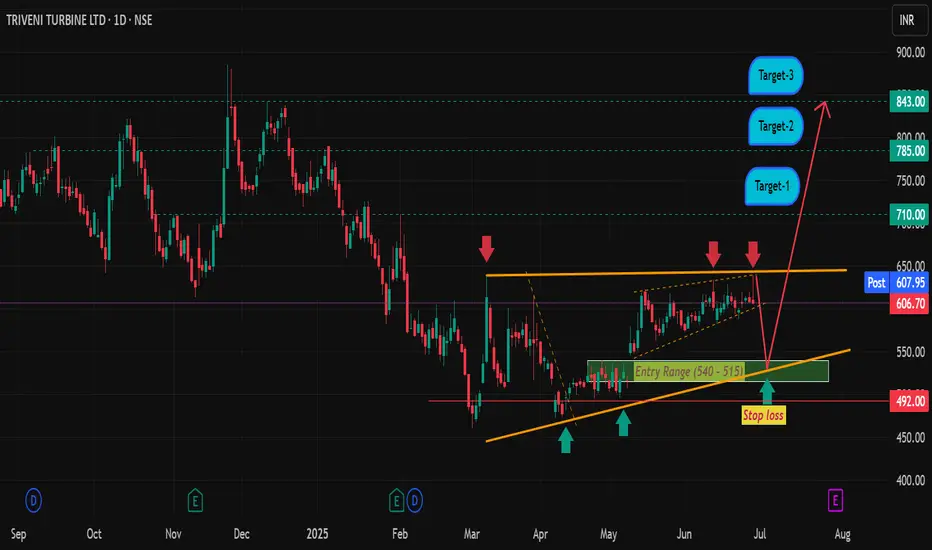
Triveni Turbine LtdTriveni Turbine specializes in the manufacturing and maintenance of steam turbines, particularly for industrial and power generation applications. They offer a range of steam turbines, including back-pressure and condensing types, designed for diverse pressure and flow requirements, up to 100 MW.
The company demonstrates strong profitability with a good profit growth of 25.1% CAGR over the last 5 years. They also have a healthy interest coverage ratio (64.45) and a good cash flow management.
Pro