Triangle
HINDZINC - NSE | Daily Chart Analysis📊 HINDUSTAN ZINC LTD (HINDZINC) – NSE | Daily Chart Analysis
📅 Date: May 30, 2025
📈 CMP: ₹464.75 (+2.68%)
📌 Ticker: NSE:HINDZINC
🧠 Technical Breakdown
🟢 Descending Trendline Breakout 🟢
The stock is showing early signs of strength as it approaches the apex of a long-term descending trendline. Price action is attempting a trendline breakout from a nearly year-long downtrend, suggesting the possibility of a bullish reversal.
🔍 Volume Confirmation
Steady volume buildup over the past few sessions,
GMDCLTD GMDCLTD seems very strong on weekly charts. Shown strong momentum in recent trading days. And closing above 200 MA since last 5-7 sessions. Now if it closes above 385 then again it may resume its uptrend and may go up to 460 levels from here. 350 is very strong support. So closing below this may change my view
OFSS | Symmetrical Triangle | BreakOut |DailyGot it! I see the **ORACLE FIN SERV SOFT LTD** chart.
Let’s break down what we’re seeing:
---
**🔍 Pattern Observed:**
✅ **Symmetrical Triangle / Ascending Triangle:**
The chart shows an **ascending triangle breakout** pattern — higher lows and horizontal resistance. Volume is starting to increase, suggesting an upcoming move.
✅ **Base Formation:**
* There was a **rectangle base** (accumulation zone) from March to April 2025, marked with a box.
* Post breakout from this rectangle (around 8,
Gold on it’s target - Next Move BullishOur yesterday analysis went TRUE . As expected after reaching high gold came down for correction. As you all know today there is PMI news today, so market will come down and after that take upward momentum. So do wait for it and after that execute the trade.
Key point.
Support - 3348, 3335, 3329
Resistance - 3354, 3362, 3371
Any Query Reach Us or comment down
Rudra Vasaikar Wishes You A Great And Very Amazing Trading Life. Trade Safe, Trade Right.
RISK WARNING 🔴 🔴 🔴
There is high risk
QPOWERQPOWER is recently listed IPO stock and now it has given triangle breakout with decent volume. 355-60 is very strong support. Closing below this may change my view. Upper side we may see momentum till 470-510. Risk reward is quite favorable. Another thing which i observed is today it is trading at all time high volume after listing day. So probability of holding and continuing momentum is quite high. keep it on radar.
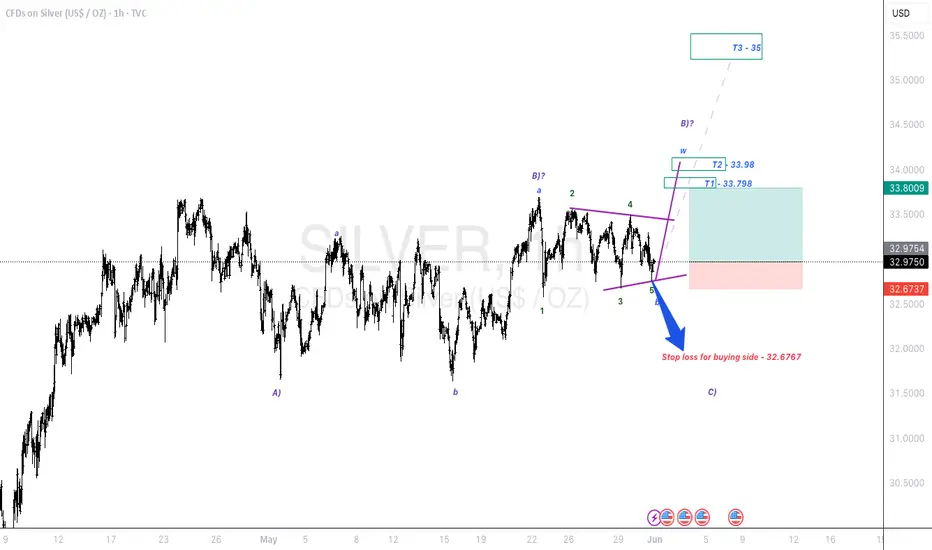
silver in triangle breakout. Two possibilities. one is impulisveElliott Wave Analysis:-
1st possibility:-
Silver is in a triangle breakout . if it is getting towards upside breakout then we have a nice opportunity of pullback and and we can add it if the pullback occurs. else we can enjoy this journey quietly.
2nd possibility:-
Silver had already made a pullback towards down side breakout. Once it start the way it will fly towards downside and then it will complete a C wave in whole B wave then upside C wave will be impulsive.
This type 2 will be
The buy position is better than the sell positionStick to your strategies
Given the formation of the ascending triangle pattern, it is very likely that long positions will bring more profit to traders than short positions in the coming days (currently, the pullback is completed to the chord of the triangle)
Emudhra Watchlist StockEmudhra's Triangle Breakout Drama: Why This Digital Security Stock Could Rally 15% from Current Levels
Price Action:
Looking at Emudhra's daily chart, we're witnessing a textbook technical setup that could offer substantial rewards for patient traders. The stock has been consolidating in a well-defined triangle pattern since late April, with price action compressed between converging trend lines around 720-780 levels.
The current price action shows Emudhra testing the upper boundary of this
HDFCBANK | Symmetrical Triangle | Daily |Watchlist### **Technical Analysis of HDFC Bank Ltd. (NSE)**
The **daily candlestick chart** of **HDFC Bank Ltd.** highlights key technical patterns, suggesting potential bullish momentum.
### **Key Observations:**
1. **Cup and Handle Formation:**
- A well-defined **cup and handle** pattern is visible, indicating prolonged accumulation.
- Breakout above **1,960.00 INR** confirms bullish sentiment.
- **Projected Target:** **2,057.30 INR**, a **11.62% upside** from breakout.
2. **Symmetri
PAYTM | Symmetrical Triangle | Daily ### **Technical Analysis of Paytm (ONE 97 COMMUNICATIONS LTD - NSE)**
The chart highlights a **symmetrical triangle breakout**, signaling potential bullish momentum.
### **Key Observations:
**Symmetrical Triangle Formation:**
- The price oscillated between converging trendlines, forming a tightening range.
- The breakout above the upper trendline confirms bullish continuation.
**Cup and Handle Preceding the Breakout:**
- The earlier **cup and handle** pattern reinforced accumula
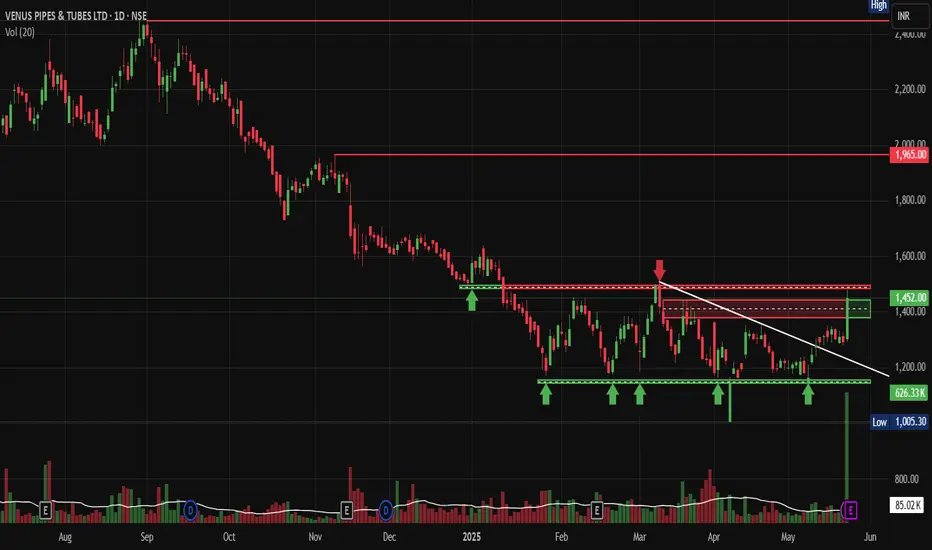
Venus Pipes Explodes 12% Breaking Out of 6-Month BaseNSE:VENUSPIPES Explodes 12%: Breaking Out of 6-Month Base Could Target ₹1,600 as it made a Beautiful Chart Structure Just Before Q4 FY25 Results.
Price Action Analysis
NSE:VENUSPIPES is experiencing a significant breakout moment, currently trading at ₹1,452.00 with an impressive 12.37% gain (₹159.80). The stock has decisively broken above a critical resistance zone around ₹1,400-1,420 after consolidating in a well-defined base for nearly six months. This breakout comes with strong momentu
AuropharmaDaily time frame shows price is testing trend line resistance, and lower time frame shows price consolidation in the form of symmetrical triangle.
Buy above 1210 with the stop loss of 1200 for the targets 1222, 1234, 1248 and 1264.
Sell below 1178 with the stop loss of 1188 for the targets 1166, 1152, 1138 and 1126.
Break out in these mentioned levels should have volume to reach the targets.
Always do your own analysis before taking any trade.
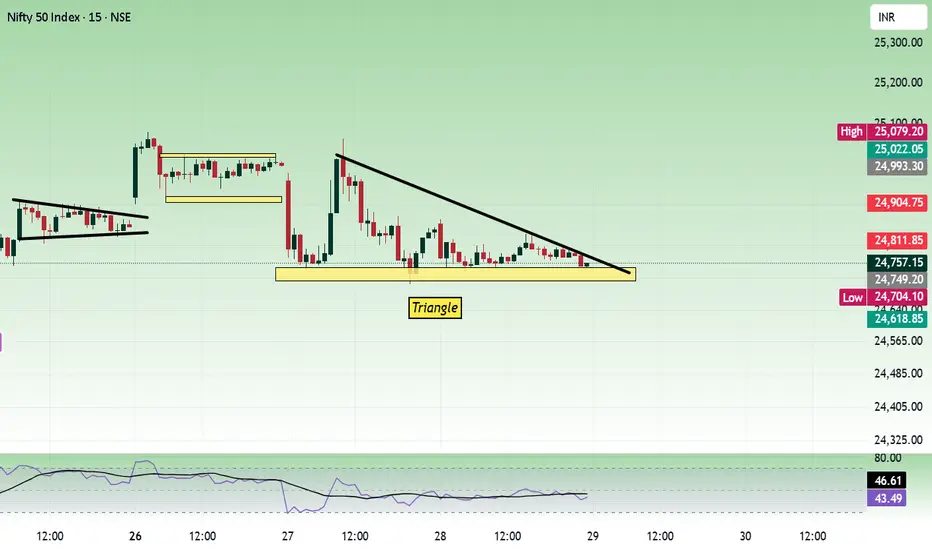
Nifty - May 29 Monthly Expiry analysisToday price moved in a very narrow range. No clear signal to buy or sell and option premium decayed. Consolidation leads to break out, if the range is broken. Resistance is seen at 24800 zone.
Buy above 24840 with the stop loss of 24800 for the targets 24880, 24920, 24980, 25020, 25060 and 25120.
Sell below 24680 with the stop loss of 24720 for the targets 24640, 24600, 24560, 24520, 24480 and 24420.
Expected expiry day range is 24500 to 25100.
Always do your own analysis before taking any trade
Aptus Rising Channel Pattern with Prior Triple Bottom PatternNSE:APTUS : Rising Channel Pattern with Prior Triple Bottom Pattern Signals Major Reversal - Could This Be the Next Multi-Bagger?
Pattern Recognition & Base Formation:
NSE:APTUS presents a compelling technical setup with a Triple Bottom reversal pattern formed at the ₹267-275 support zone. This pattern, completed over several months from late 2024 to early 2025, represents one of the most reliable bullish reversal formations in technical analysis.
The stock has also carved out a distinct
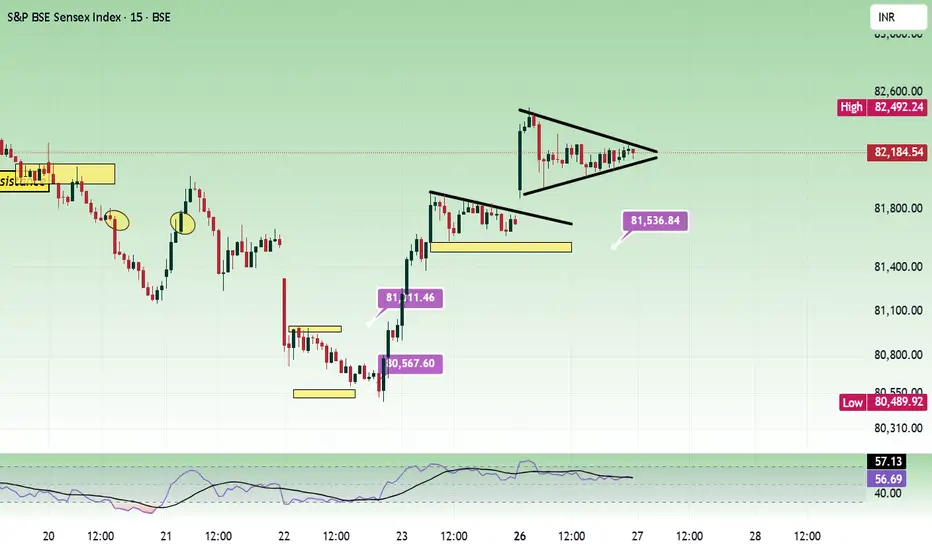
Sensex - Expiry day analysis May 27Last week price has formed a bull flag formation and we got the break out today. And today's move has formed a symmetrical triangle. Near by resistance is at 82500 and support is at 81900. Price have to gain strength to break this range.
Buy above 82140 with the stop loss of 82040 for the targets 82220, 82360, 82480, 82600, 82720 and 82840.
Sell below 81860 with the stop loss of 81960 for the targets 81780, 81700, 81560, 81460, 81340 and 81260.
Always do your own analysis before taking any trade
AMI ORGANICS: RANGE and TRIANGLE with strong Q results, ami organics is set to break the consolidation range with stong momentum, early setup has advantage.
keep your risk reward in check and can become a good script.
ALong
Multi-Month Triangle Breakout Can Signal Move to ₹750+NSE:TIPSMUSIC Made a Beautiful Chart Structure Today and Breaks Free of Multi-Month Triangle Breakout and Could Signal Explosive Move to ₹750+
Price Action Analysis:
NSE:TIPSMUSIC is currently trading at ₹676.80, up 3.68% (₹24.00) today. The stock has been consolidating in a narrowing range since January 2025, forming a classic symmetrical triangle pattern. After testing the lower support multiple times around ₹580-600, the stock is now approaching the apex of the triangle and showing si
AKUMSAKUMS seems stronger and given triangle breakout. Volume is also very decent as its just 1st hour of trading and almost nr previous day volume. We may see momentum rally nearing 12-15% from here as long as its closing above this trendline it may continue to outperform. Risk reward is quite good. Result is on 26th may. Keep it on radar
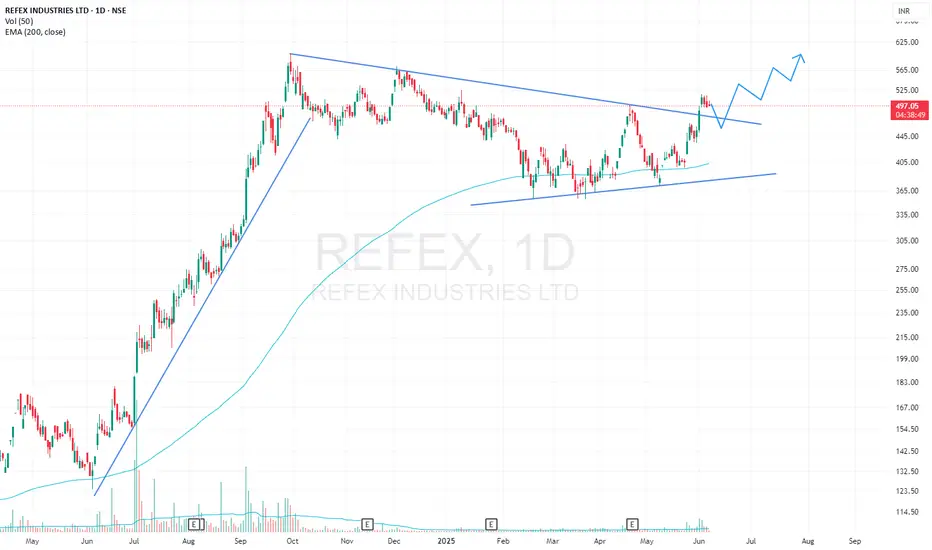
Flag and Pole in Styrenix what was the old INEOS StyrolutionOverall the pattern shows that a convergence is happening at this level
When we look at the stock over a long period of time, what I realise is that the patterns are repetitive and it has not participated in the bull market as much as the other stocks.
Looking at the shareholding pattern also we can understand that the no.l of shareholders in this counter are only 45,000 which means only savvy and old timers what knew this counter and IPO investors are there rather than catching the frenzy of F
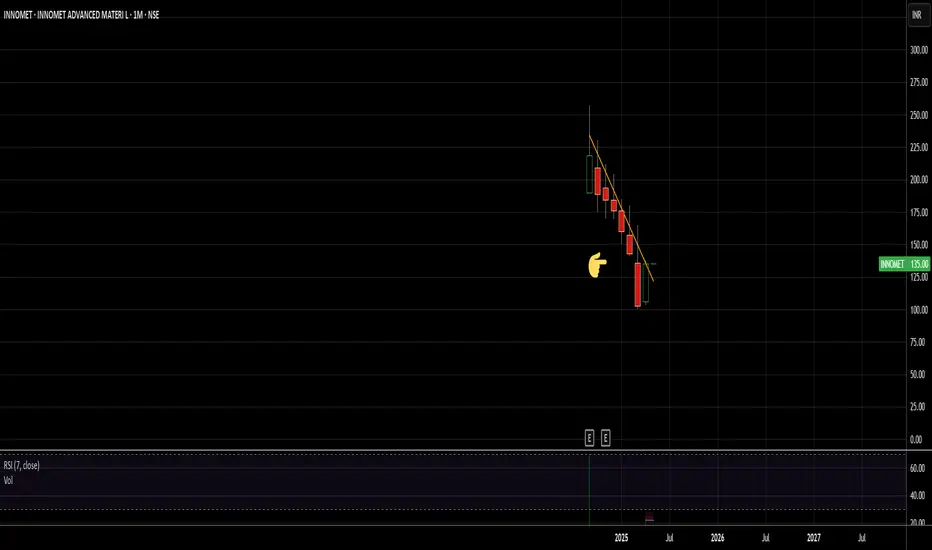
A leader in Powder MetallurgyNSE:INNOMET Innomatt Advanced Materials: Pioneering Excellence in Powder Metallurgy and Specialised Materials
As a metallurgist with a Ph.D. in Materials Science, I have always been fascinated by the transformative potential of advanced materials in cutting-edge industries. One company that stands out in this domain is Innomatt Advanced Materials, a Hyderabad-based leader in powder metallurgy, sintering, and precision casting. Their expertise caters to some of India’s most prestigious organisa