CONCOR – Triangle Breakout with Fib Targets in SightCONCOR After weeks of coiling inside a symmetrical triangle, CONCOR has finally broken out above key resistance near ₹705 — backed by strong volume and price action.
Current Price: ₹730.50
Highlights:
Triangle Breakout Zone: ₹702.15 (Fib 38.2%)
Next Key Levels: ₹764.70 & ₹809.25 (61.8% & 78.6%)
Strong Support Zone: ₹663–₹645 (Fib 23.6% & horizontal base)
Also reclaiming the 200 EMA powerful trend confirmation.
Structure + Breakout + Fib Confluence = High Probability Setup
A close ab
Triangle
TILL - Descending Trendline Breakout Watch📊 TIIL – Descending Trendline Breakout Watch | Key Fib Retest in Play
🕰️ Timeframe: 1D | 🧭 Pattern: Descending Triangle | 🎯 Fibonacci Reversal Setup
📈 Technical Analysis Summary:
TIIL is currently approaching a major trendline resistance, drawn from its all-time high. After a long downtrend, the stock is now testing the 50% Fibonacci retracement level at ₹2,731.35 with rising momentum.
The price is hovering near a breakout zone and consolidating just below resistance, hinting at potential bull
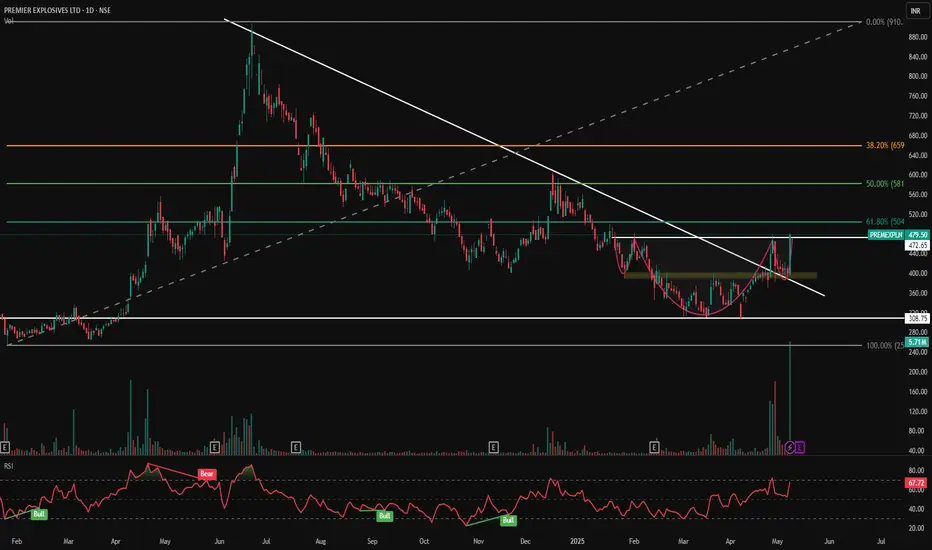
PREMEXPLN - Cup & Handle Breakout | Volume Surge📊 PREMEXPLN – Cup & Handle Breakout | Volume Surge + Key Fibonacci Confluence!
🕰️ Timeframe: 1D | 📐 Pattern: Cup & Handle | 📊 Momentum: Bullish
📈 Technical Chart Overview:
Premier Explosives has executed a clean breakout above a long-term descending trendline and a cup & handle base with a massive spike in volume, hinting at a powerful trend reversal.
Price surged nearly +19% intraday, confirming strength near the 61.8% Fibonacci retracement from the previous swing high at ₹910.30 to the swing
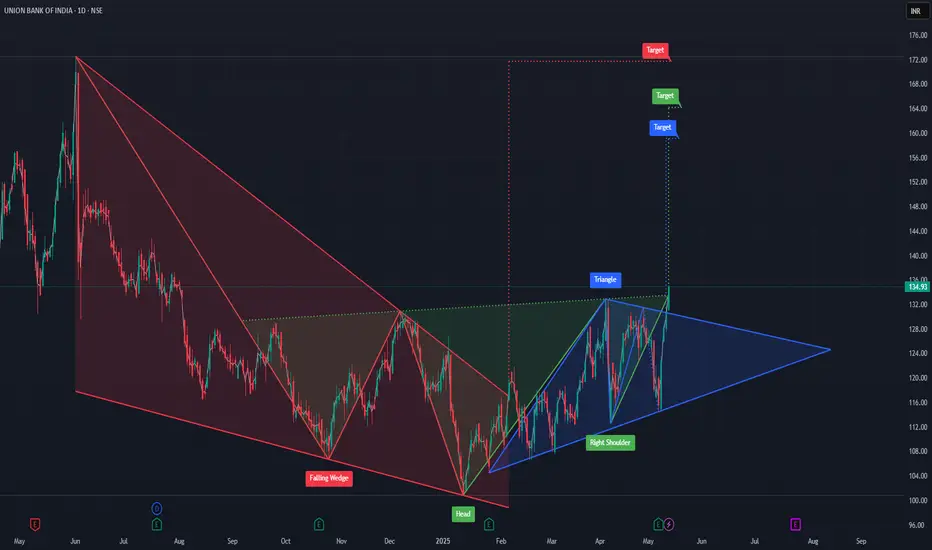
UNION BANK OF INDIA – TECHNICAL ANALYSISUnion Bank just flashed a powerful confluence of 3 bullish patterns and smart money could already be moving in. Let’s break it down simply, but sharply
1. Falling Wedge Breakout (Aug ‘24 – Feb ‘25)
Falling Wedge is one of the strongest bullish reversal signals in technical analysis.
✔️ Price kept dipping but volume dropped — a sign of seller exhaustion.
✔️ It broke out with power in Feb, confirming buyers are gaining control.
2. Inverse Head & Shoulders (Smart Money Footprint)
This classic
Shree Rama Multi Tech - Ascending Triangle - Buy above 37
Shree Rama Multi Tech posted excellent results and forming potential Ascending triangle breakout.
Best to Add above 37. Strict Stop Loss of 31.50. Target 50+
#SHREERAMA Q4
NET PROFIT AT 36.3 CR V 3.3 CR YOY
REVENUE AT 59.16 CR V 46.6 CR YOY
EBITDA AT 10.78 CR V 4.60 CR YOY
MARGINS AT 18.22 % V 9.87 %
Disclaimer : Educational content. Please do your own research.
Nifty - Weekly Review May 11 to May 16We had a gap down and consolidation move on Friday. Consolidation has formed a descending triangle. 24000 is an important support zone and the price is sustaining above it so far.
Buy above 24120 with the stop loss of 24070 for the targets 24160, 24220, 24300, 24380, 24420 and 24480.
Sell below 23960 with the stop loss of 24000 for the targets 23920, 23880, 23820, 34780 and 23720.
23950 to 24100 is a slow moving zone where bulls and bears will fight to hold 24000.
Always do your own analysis bef
Nifty - May 8 Expiry day analysisToday also we had a narrow range movement day. Price has formed an ascending triangle in that process. Sustaining above 24400 is important to be bullish.
Buy above 24440 with the stop loss of 24400 for the targets 24480, 24520, 24580 and 24620.
Sell below 24340 with the stop loss of 24380 for the targets 24300, 24260, 24220 and 24160.
Always do your own analysis before taking any trade.
Bank NiftyLower time frame shows, price has broken the descending triangle and falling towards 54000 support zone. Near by resistance is seen at 54600.
If price takes support from 54000, buy above 54100 with the stop loss of 54020 for the targets 54200, 54280, 54400, 54520, 54620 and 54740.
Sell below 53900 with the stop loss of 54000 for the targets 53800, 53720, 53600, 53520, 53400, 53320, 53200 and 53060.
Daily time frame looks interesting.
Descending triangle or bullish flag? 🤔
Always do your analysi
Sensex - Weekly expiry analysis May 6We had a very narrow range movement between 80660 to 81060 today. 81160 - 81220 is also a temporary resistance. Price have to sustain above 81000, then break 81200 to move towards 81600. Price movement is choppy when there are near by support/resistance zones.
Buy above 81060 with the stop loss of 80960 for the targets 81160, 81220, 81340, 81460 and 81660.
Sell below 80840 with the stop loss of 80940 for the targets 80740, 80660, 80540, 80440, 80300 and 80180.
Always do your own analysis befor
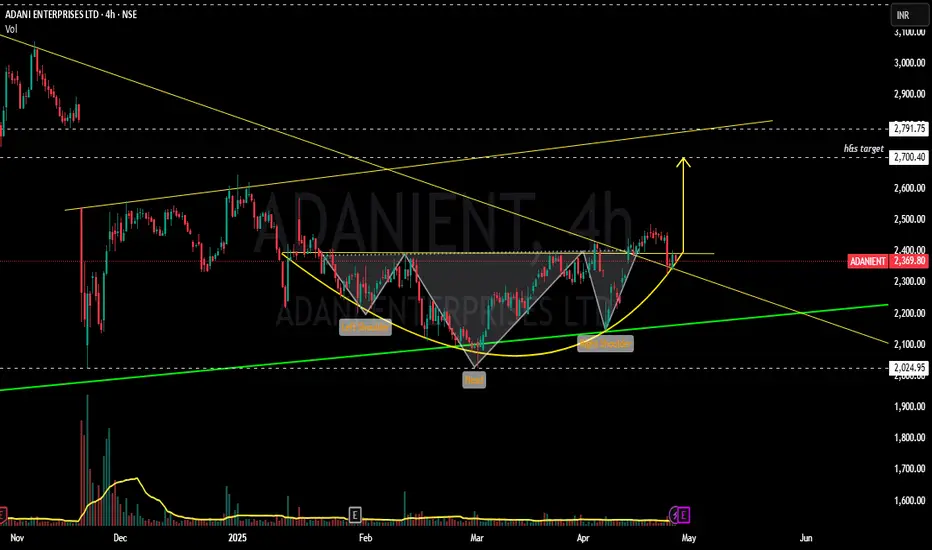
ADANIENT - Bulls getting ready to bump up ?????!!!Y essss!!! !
Chart patterns inculcating me the above titled opinion.
1. Monthly timeframe shows the symmetrical triangle pattern from 2020 till now, now the stock at support line(chart image shown below)
2. Weekly time frame shows us the INSIDE BAR candlestick pattern(mother baby pattern) with good volumes....with the low umtested till now.(made the low of 2025 on 22 nov 2024)
3. Daily time frame shows the Breakout attempt out of the 11 month old trendline.
4. Now, with the result
RelianceAs per the daily chart, price is moving up for many days. It can give some pull back. 1400 is an important zone to decide the trend direction. Price have to sustain above this to be bullish.
Buy above 1415 with the stop loss of 1402 for the targets 1432, 1454, 1470, 1486 and 1498.
Sell below 1390 with the stop loss of 1402 for the targets 1376, 1360, 1344, 1330 and 1312.
Always do your own analysis before taking any trade.
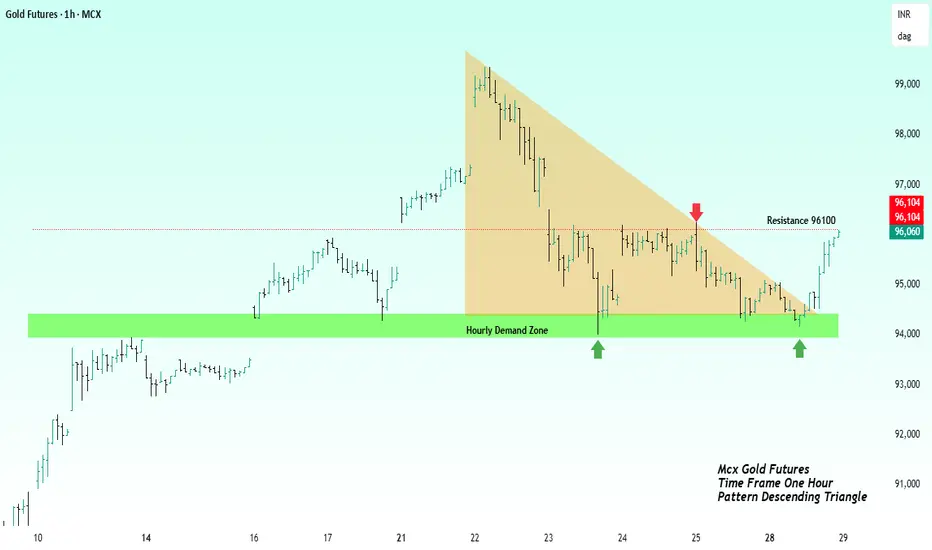
Gold Futures Charging at ResistanceHello Traders hope you are fine and doing well. Gold Futures are approaching a breakout above 96100 after strong demand zone defenses. This idea outlines a potential bullish setup awaiting confirmation for a momentum driven move.
Gold Futures (MCX) is currently forming a bullish setup with multiple rejections from a strong hourly demand zone and compression below the 96100 resistance level. A confirmed breakout above 96100 on the 1-hour timeframe will indicate renewed buying interest and a pote
HEROMOTOCO-Positional Short Trade Stock upside taking support from trendline. Friday's session 25'th April The stock has shown weakness potential trend reversal.
There are two possibilities:
1)Head and Shoulder Pattern
2)Descending Tringle Pattern
For both the possibilities it the neckline/Support zone 3800 needs to break. If that happens it may test 3680.
If opens gap up Above 3960 Avoid!
Please don't forget click on follow button so you won't miss any upcoming ideas.
Any confusion, feel free to drop msg. Happy to help :)
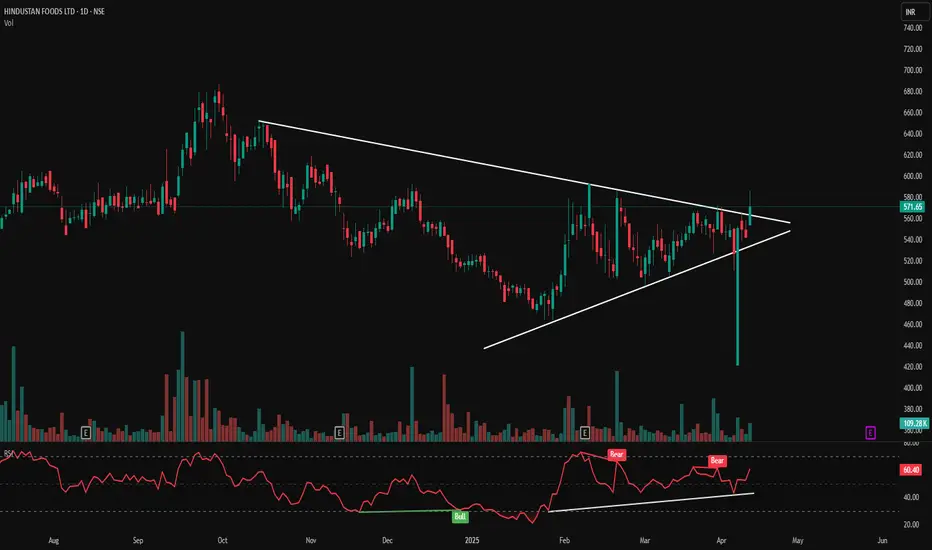
Hindustan Foods Ltd-Symmetrical Triangle Breakout!Hindustan Foods Ltd.—Symmetrical Triangle Breakout! 🚀📈
📅 Published on: April 12, 2025
📊 Chart Insight:
HNDFDS has broken out of a well-formed symmetrical triangle pattern on the daily chart, signaling a potential bullish continuation. The breakout is accompanied by a solid green candle and volume surge, hinting at strong momentum ahead.
🔍 Key Technical Highlights:
🔺 Pattern: Symmetrical Triangle (Lower highs + Higher lows)
📏 Breakout Level: ₹560
📈 Current Price: ₹571.65 (+4.03%)
📊 Volume Spike
SbinPrice is testing the trend line in lower and higher time frame. Also price is having at 760 zone.
Buy above 763 with the stop loss of 758 for the targets 768, 774, 780 and 788.
Sell below 754 with the stop loss of 759 for the targets 749, 744 and 738.
Always do your own analysis before taking any trade.
HCLTECH-INTRADAY-LONGStock is forming Ascending tringle in 1hr chart. Good opportunity to go long if it opens flat.
Ignore if it opens below 1405, if gap up wait for retest at 1426.
Please don't forget click on follow button so you won't miss any upcoming ideas.
Any confusion, feel free to drop msg. Happy to help :)
This is only for educational purpose, please manage your risk accordingly.