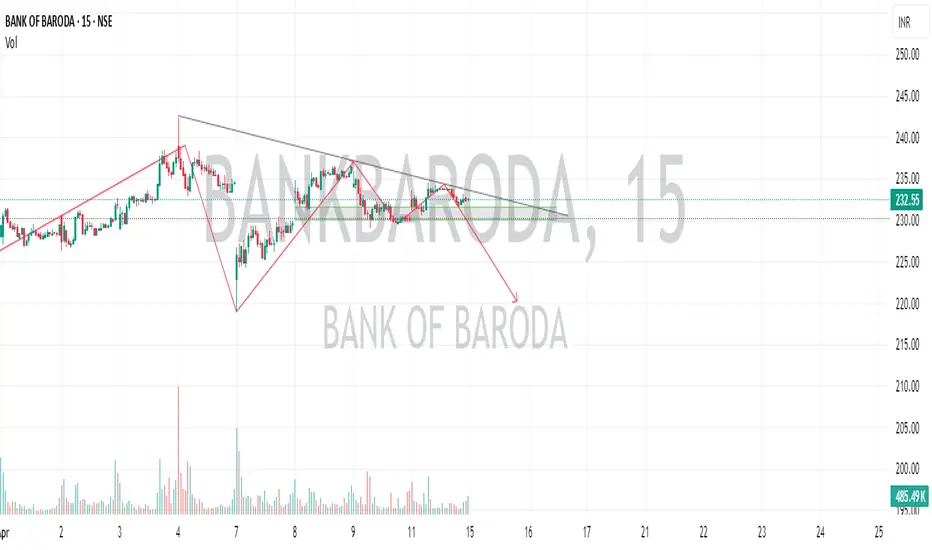
BANKBARODA-Intraday- Short tradeBANKBARODA has formed Descending tringle in 15minute timeframe.
The key level to watch on 15th April trading session would be 230 if breaks It would be in downtrend for short term till 223 to 220.
If it opens gap up please avoid.
Please don't forget click on follow button so you won't miss any upcoming ideas.
Any confusion, feel free to drop msg. Happy to help :)
This is only for educational purpose, please manage your risk accordingly.
Triangle
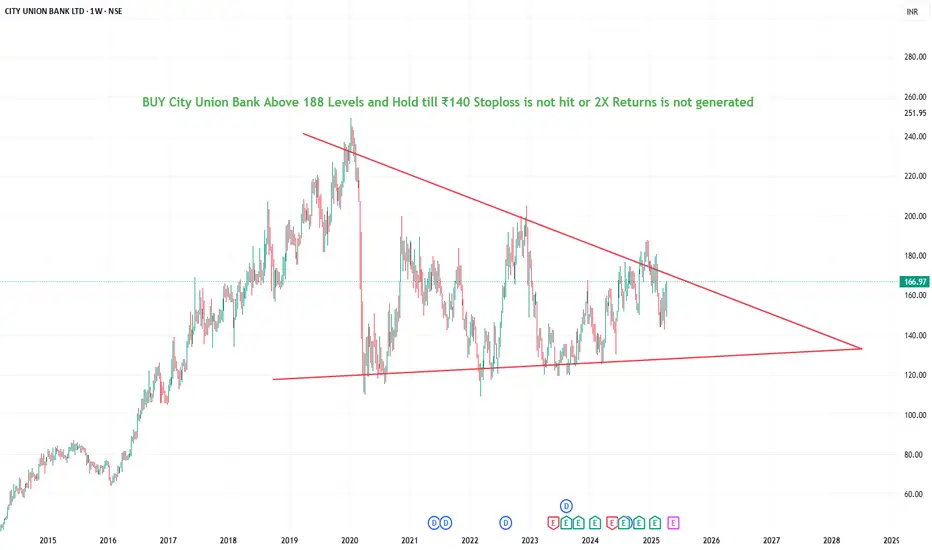
CITY UNION BANK - Buy above 188₹BUY BUY BUY CUB - Dont miss opportunity if 188₹ levels are broken
Ascending triangles tend to be bullish as they indicate the continuation of an upward trend. In some cases, they may point to the reversal of a downtrend. A descending triangle is bearish. That's because it points to the continuation of a downtrend or the reversal of an uptrend.
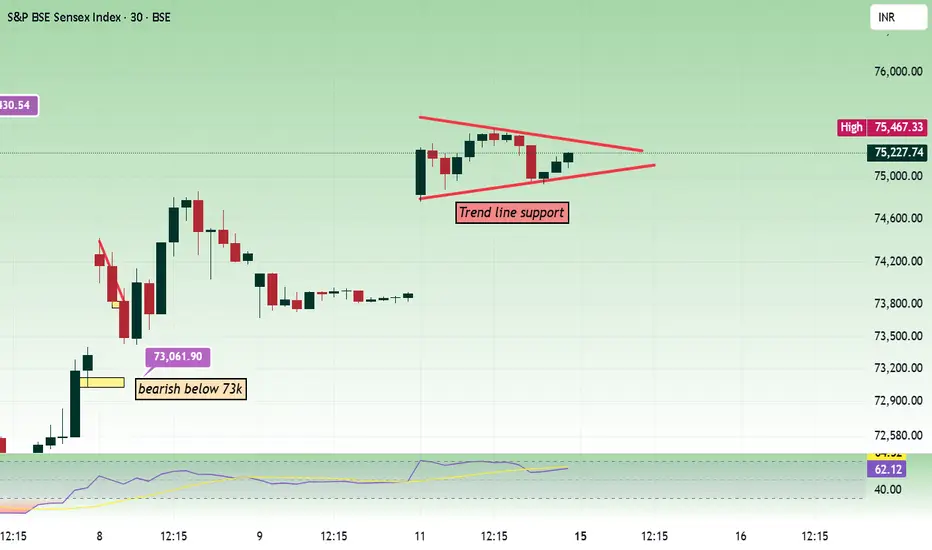
Sensex - Apr 15 expiry day analysisPrice moved in a range in the last trading session. 75400 - 75500 is important to decide the trend direction now.
Buy above 75520 with the stop loss of 75420 for the targets 75600, 75720, 75800, 75920, 76000 and 76120.
Sell below 75300 with the stop loss of 75400 for the targets 75200, 75120, 75020, 74900, 74780, 74660 and 74520.
Always do your analysis before taking any trade.
INDUSINDBK-Intraday/short term positional After the big fall, stock is consolidating from last month.
It has formed Ascending tringle pattern. From past 2 days i.e. 8th and 9th April 2025. It is trading in range. which states that buyers are accumulating.
It has potential to move if it opens between 692-700. It may go sideways for one more day it is a good opportunity for Long Intraday/short term positional trade.
If it opens 666, avoid.
Any confusion, feel free to drop msg. Happy to help :)
This is only for educational purpose,
Descending triangle-DailyFIVESTAR-Descending triangle-Daily timeframe
Good Opportunity for short term trade above 737-741, Target-762, 803, 855.
Avoid-Opens gap down 685.
Any confusion, feel free to drop a msg. Happy to help :)
This is only for educational purpose, please manage your risk accordingly.
Patanjali - Ascending Traingle BreakoutPatanjali has given a BO of ascending triangle and has taking support of 200EMA. Given the FMCG space, this is looking for a good run. Other factors:
1. Turnaround story from a dead loss making Rushi Soya to a big name in FMCG sector
2. Venturing into unexplored insurance business by acquiring Magma General Insurance
3. LIC increased stake to 7%
4. Tax reduction from 1 April 2025 onwards will result in high disposable income and FMCG sector which is more dependent on domestic demand and hence
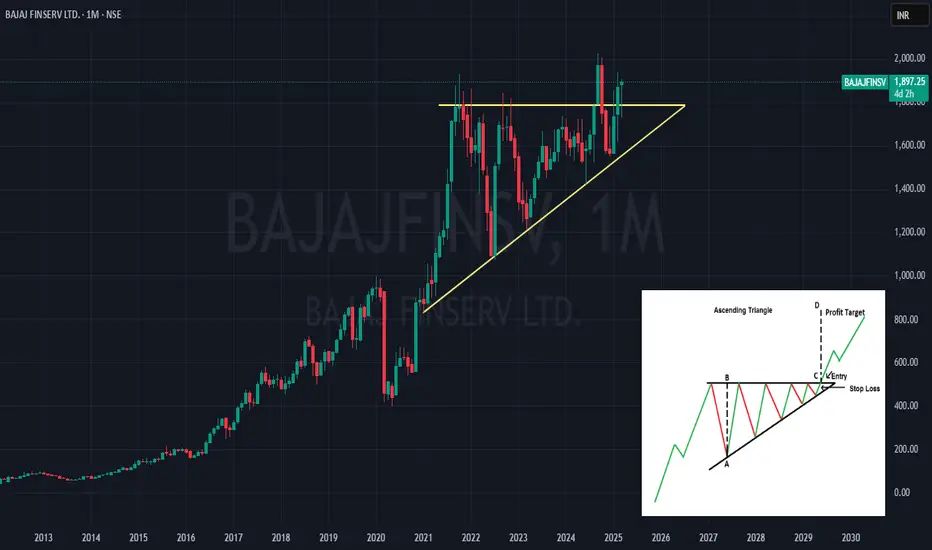
Bajaj Finserv in a bullish trend; Watch and trade?Bajaj Finserv has been in a good trend even when overall market remained negative, the stock has been trading around the recent highs.
There has been a Break out of the resistance zone but the market has formed a Tweezer top after the break out on the weekly charts.
If there is trend reversal of the indices, high chance of it forming new high while be there.
YTD the stock has posted 17% positive returns while the markets are down by the approximately the same percentage.
Major Resistance le
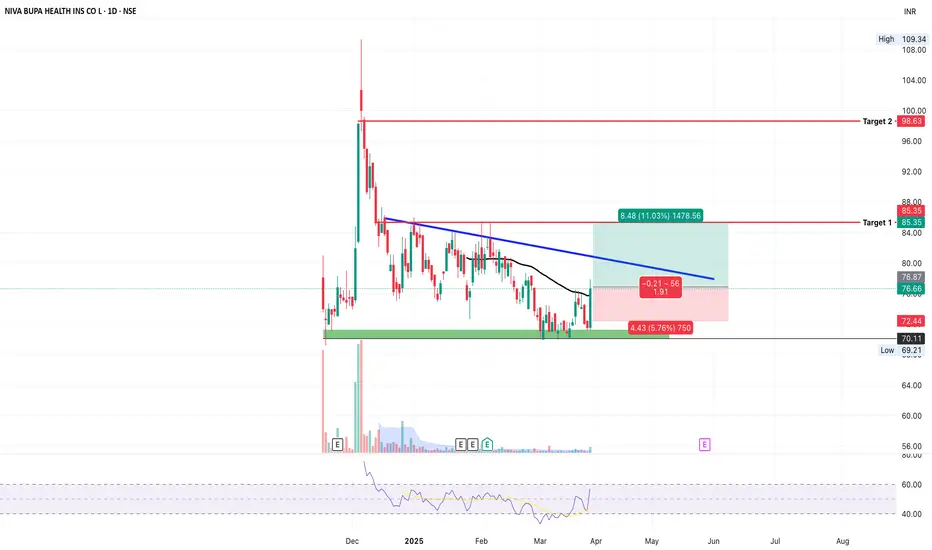
NIVA BUPA HEALTH (NSE: NIVA) – Breakout PotentialRight now, it is completing a descending triangle breakout, which is a bullish pattern.
The stock has been consolidating for the past 4 months in a tight range, building strength for a breakout.
All important levels have been marked on the chart.
Looking at the chart, we can say that if the price breaks to the upside, there is a high probability that the stock will reach the ₹98.63 target.
For the past few days, volume has also been quite good. If we enter the stock at ₹76.66, we can achie
Bajaj Finserv (BAJAJFINSV) forming an Ascending Triangle patternBajaj Finserv's stock is currently forming an Ascending Triangle pattern, which is often considered a bullish continuation pattern. This marks the second time the stock has broken above its September 2021 highs. The first attempt occurred in September 2024, but it failed to maintain momentum above that level and eventually found support within its channel. However, in February 2025, the stock successfully broke through the resistance and closed above it, which had previously acted as a strong re
Ramco Cements: A triangle pattern is emergingRamco Cements is developing a triangle pattern, which occasionally offers support and resistance points that can create trading opportunities. I've highlighted these levels on the chart, and I hope this might be useful for anyone looking to navigate these price movements.
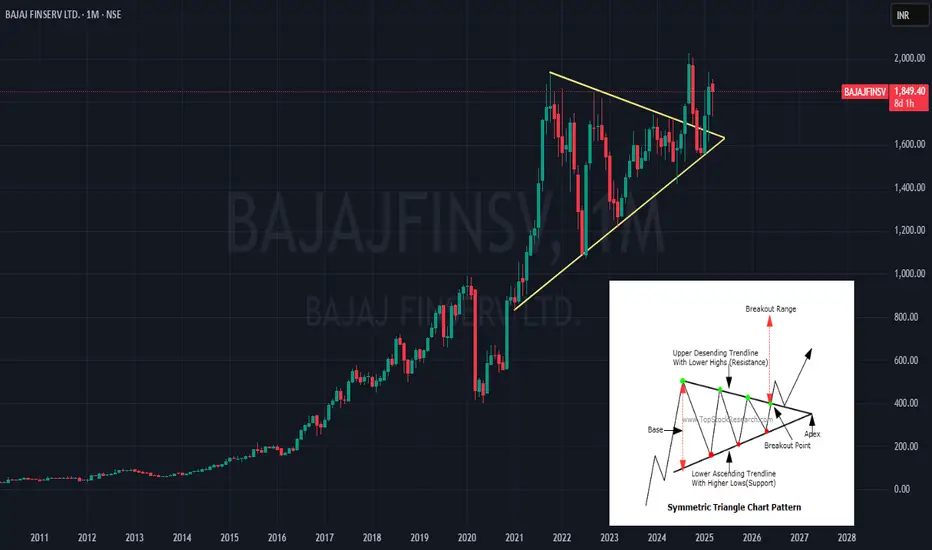
Bajaj Finserv (BAJAJFINSV) – Symmetrical Triangle BreakoutBajaj Finserv has formed a symmetrical triangle pattern on the monthly time frame, indicating a potential strong breakout. This pattern is often seen as a sign of consolidation, and with the recent breakout, it could lead to significant price movement.
Bajaj Finance (BAJFINANCE) – Ascending Triangle Pattern FormingBajaj Finance's stock is currently forming an Ascending Triangle Pattern, which is often seen as a bullish continuation pattern. For the first time, BAJFINANCE has closed above the September 2021 highs, which was previously a strong resistance level. This indicates that the stock might be gearing up for a potential breakout!
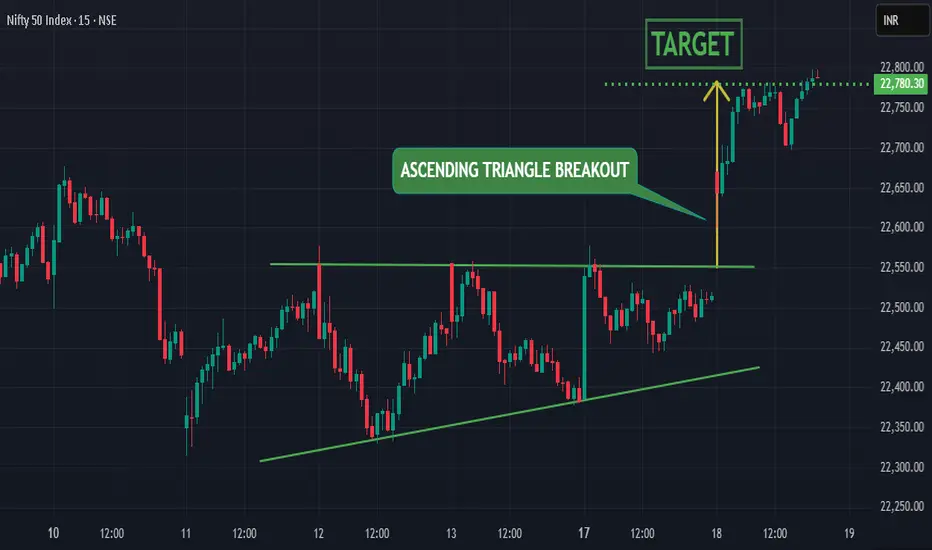
Nifty broke out of Ascending Triangle pattern
ASCENDING TRIANGLE BREAKOUT -
nifty had recently broken out of strong ascending triangle pattern indicating strong upward potential for the index
50D & 100D SMA CROSSOVER -
50D sma had recently crossed over 100D sma and took multiple support on 50D sma repeatedly indicating strong potential of upward momentum for the index
Symmetrical Triangle Pattern Identified: BHARTI AIRTEL LTDThis weekly candlestick chart highlights a symmetrical triangle pattern, a classic signal of potential breakout opportunities. With key points marked (1, 2, 3), traders can analyze possible breakout directions for informed decisions.
harti Airtel Ltd., incorporated in the year 1995, is a Large Cap company (having a market cap of Rs 9,93,885.70 Crore) operating in Telecommunications sector.
Bharti Airtel Ltd. key Products/Revenue Segments include Service Revenue and Sale of Products for the year
Ramco Cements at a Crossroad: Big Breakout or Breakdown Ahead?This chart shows The Ramco Cements Ltd on a monthly timeframe, with price action forming a clear structure.
Analysis:
Pattern: A symmetrical triangle pattern, where the price is trading within a narrowing range.
Resistance (Red Line): Around ₹1000, where the price has faced multiple rejections.
Support (Green Line): Higher lows, indicating that the long-term uptrend is still intact.
RSI: Currently around 49.71, sitting in a neutral zone — neither overbought nor oversold.
Deception Point:
(AVANTIFEED)Avanti Feeds Ltd. (AVANTIFEED)
Weekly report 🍁
Ascending triangle breakout
Volume ✔️
Here are some key fundamentals:
- *Market Capitalization*: ₹10,884 Cr
- *P/E Ratio*: 22.62 ¹
- *P/B Ratio*: 4.10
- *Dividend Yield*: 0.85%
- *EPS (TTM)*: ₹35.31
- *52 Week High*: ₹822
- *52 Week Low*: ₹472
EURUSD - PRE BREAKOUT CONSOLIDATION - ASCENDING TRIANGLESymbol - EURUSD
CMP - 1.0485
The EURUSD pair continues to display bullish signals, suggesting the potential for sustained upward movement. However, significant resistance lies ahead, and the market is currently undergoing a pre-breakout consolidation phase. The U.S. dollar is experiencing a corrective phase, influenced by economic data, domestic political developments, and indications from both President Trump and Federal Reserve Chairman Jerome Powell regarding the possibility of an imminent