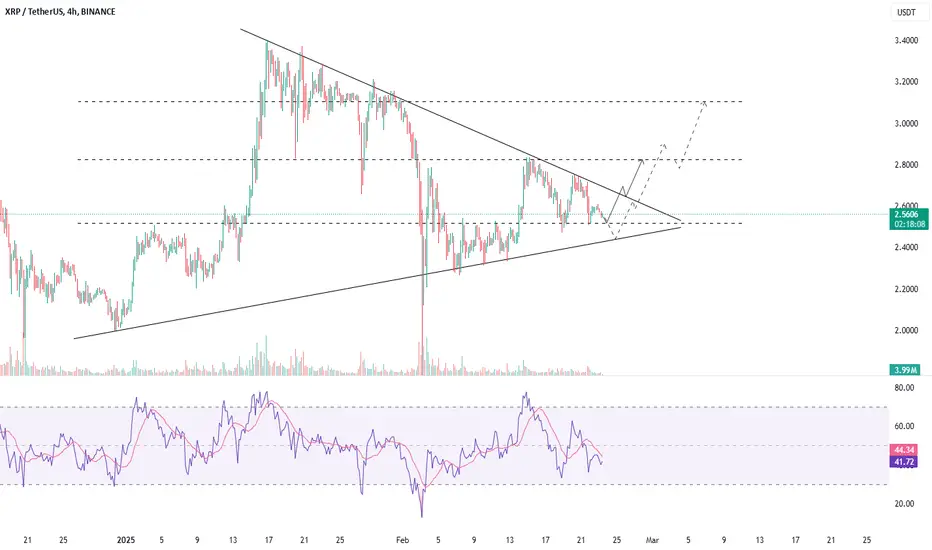
XRPUSDT - FORMING A BULLISH STRUCTURESymbol - XRPUSDT
CMP - 2.5500
XRPUSDT has been exhibiting a range-bound behavior recently, currently trading within a symmetrical triangle formation, indicating potential for a breakout in either direction. This pattern suggests that there is a convergence of support and resistance, and the price could move decisively once it breaks out of this range. Price is also forming a support area, suggesting a strong foundation for a potential upward move, especially if key levels are breached.
While
Triangle
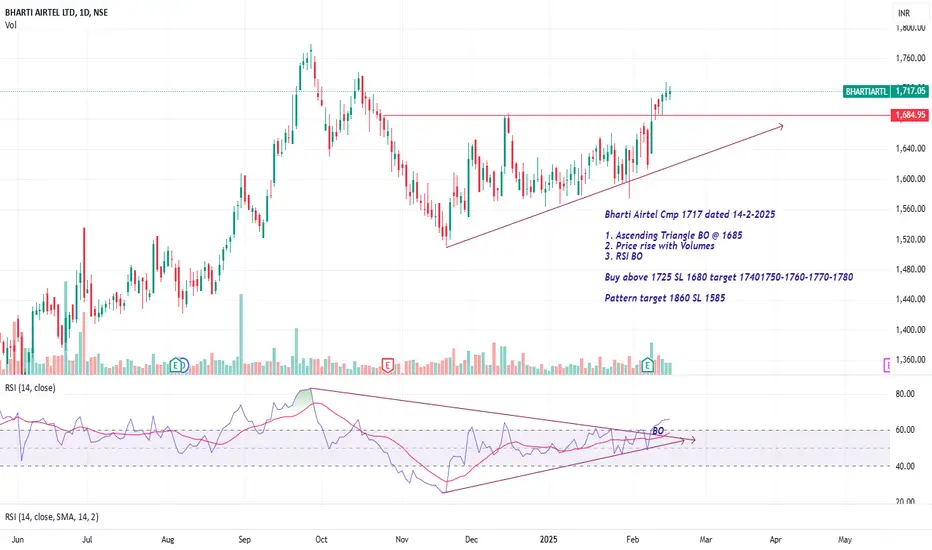
The Ascending Triangle Pattern: A Bullish Continuation GuideHello Traders!
In today's post, we’ll explore the Ascending Triangle Pattern , one of the most reliable bullish continuation patterns that traders look for during uptrends . It’s an important tool for identifying potential breakout points in trending markets. If you want to learn how to trade these breakouts effectively, mastering the Ascending Triangle is essential.
Chart Pattern: The Ascending Triangle is a strong bullish continuation pattern. In the case of ASIAN PAINTS LTD , we
Nifty - Expiry day analysis Feb 20Price was moving in a range for the past few days and in that process has created a channel pattern. Also I can see a triangle inside the channel.
Buy above 22920 with the stop loss of 22880 for the targets 22960, 23000, 23040, 23100 and 23160.
Sell below 22840 with the stop loss of 22880 for the targets 22800, 22760, 22700 and 22660.
As per daily chart price is at support.
Always do your own analysis before taking any trade.
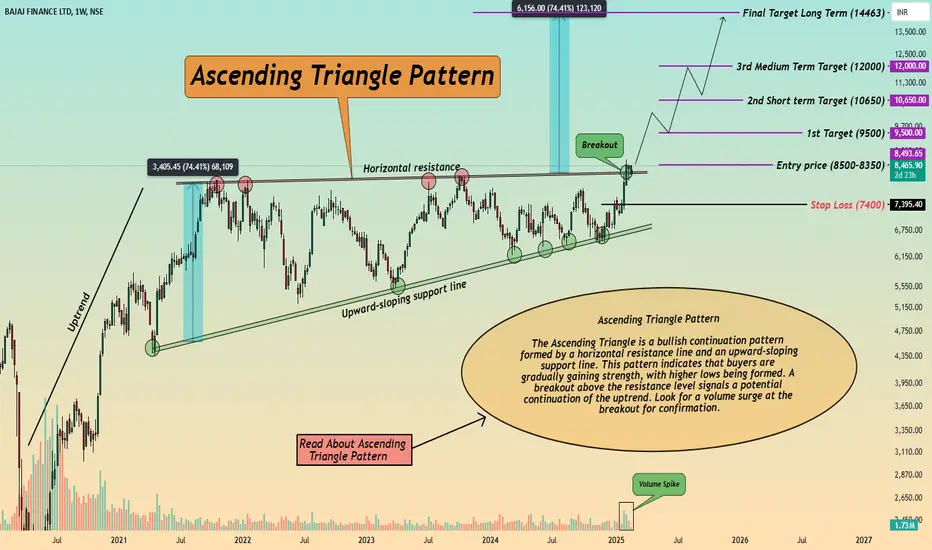
Finance Sector Leader on Breakout with Huge Volume--What’s Next?Hey Traders!
Hope you're all doing great! There’s an exciting trading idea setting up with Bajaj Finance , and I couldn’t wait to share it with you. The stock is forming a classic Ascending Triangle Pattern , and based on this setup, we're expecting a nice breakout soon. Let’s break it down.
Technical Analysis: Ascending Triangle Pattern
The Ascending Triangle is a bullish continuation pattern that indicates strong buyer interest and a potential breakout. Bajaj Finance has formed a cl
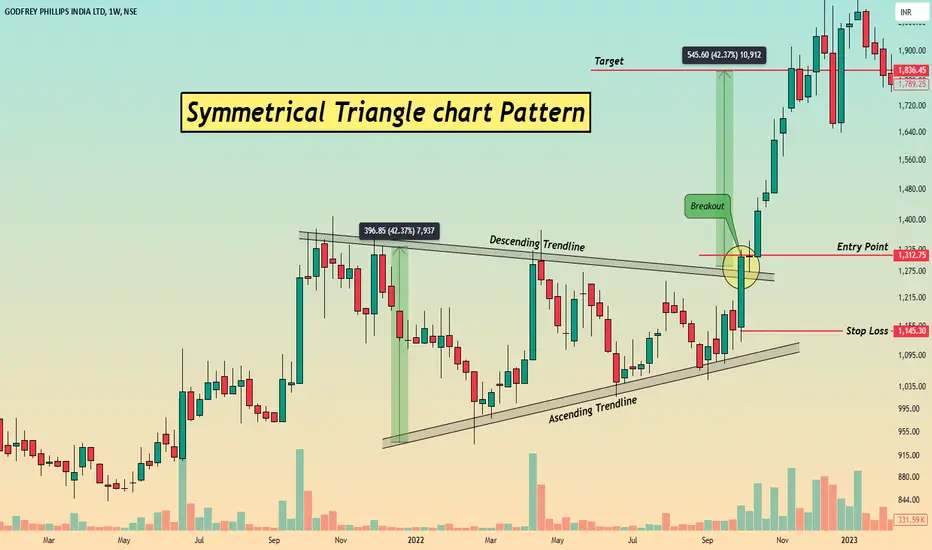
Unlocking Breakouts with the Symmetrical Triangle PatternUnderstanding the Symmetrical Triangle Chart Pattern
Hello Traders!
Today, we’ll discuss one of the most powerful chart patterns used to predict breakout opportunities — the Symmetrical Triangle . This pattern is a sign of market consolidation, where price is moving within a narrowing range, and a breakout is expected once the price escapes from this converging trend.
The Symmetrical Triangle consists of two trendlines:
Ascending Trendline : Connecting the rising lows.
Descending Tre
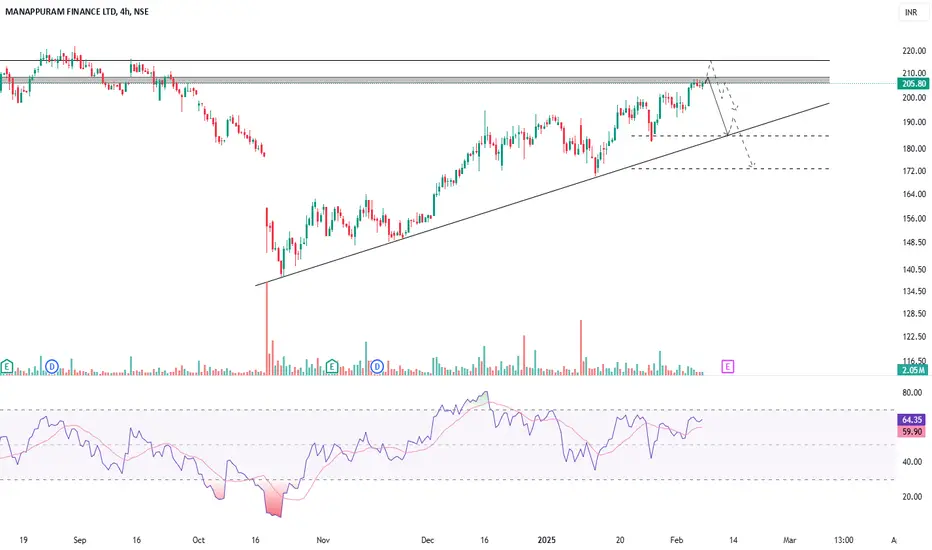
MANAPPURAM FINANCE LTD - APPROACHING RESISTANCE AREASymbol - MANAPPURAM
Manappuram Finance Ltd. has been experiencing a recovery from lower levels in recent weeks. The stock has bounced back from support zones and is now testing key resistance areas. However, it faces considerable challenges at higher levels, showing signs of consolidation as it approaches its resistance zones.
The overall trend appears to be in recovery, following a significant dip. However, the stock is facing resistance at higher levels, indicating a potential pause or conso
Ascending Triangle Pattern Breakout in Bajaj FinanceThe chart of **Bajaj Finance Ltd. (NSE: BAJFINANCE)** on the **weekly timeframe** shows a **recent breakout from an ascending triangle pattern**.
### **Ascending Triangle Pattern Breakout:**
1. **Structure of the Pattern:**
- The **horizontal resistance** zone (highlighted in blue) was previously tested multiple times, around **7,768 - 8,000**.
- The **ascending trendline** (in purple) has consistently provided higher lows, forming the base of the triangle.
- The price was **squeezing
ONDOUSDT - TRIANGLE PATTERN BREAKOUT - BULLISH OUTLOOKSymbol - ONDOUSDT
ONDOUSDT continues to demonstrate an upward trend, with periodic cyclical counter-trend corrections. The chart is currently indicating a potential conclusion of the correction phase, suggesting a readiness for further upward movement. A significant consolidation pattern has developed within the context of the prevailing uptrend. In this regard, the price is attempting to break above the consolidation resistance (triangle) and surpass the next key resistance level at 1.538. Thi
Ascending Triangle Pattern in BAJAJ FINANCEChart Analysis & Trade Setup
Stock: Bajaj Finance Ltd (NSE)
Timeframe: 1W (Weekly Chart)
Technical Analysis:
Resistance Zone (Orange Region):
The price has faced multiple rejections in this zone historically.
The stock has now broken above this resistance, signaling a potential breakout.
Support Levels:
Purple Trendline: Long-term ascending trendline acting as dynamic support.
Blue Zones: These levels indicate past significant buying areas.
Breakout Confirmation:
Trade Plan:
Entry: Around ₹7
Paytm - CMP 950 - Monthly - Symmetrical Expanding TrianglePaytm has created Symmetrical Expanding Triangle in Monthly time frame
RSI going up continuously, still not in overbought zone
MACD is looking good
Price is above 20 Months EMA
volume is good for past 4-5 months
Crossed 930 resistance with good volume
DII has increased holding in June and Sep 2024, FII has decreased holdings
Target 1 : 1160++
Target 2 : 1350 , This could be next Resistance
if price sustain at 1350 and give breakout from triangle with good volume t
KAYA LTD - Symmetrical Triangle - MonthlyKAYA LTD formed Symmetrical Triangle pattern on Monthly chart.
Formed symmetrical triangle and given breakout with very huge volume and retest done .
RSI is looking good and taking support
ROCE going minus every year since last 5-7 years :(
poor sales growth since last 5 years :(
FII's and DII's has increased their holding little bit since last 2 quarter.
What will happen next quarter ? will it go sideways or downtrend will start ?
Resistance1 : 505-511
Resistance 2 :
Piramal Enterprises Limited (PEL) !! Ready to ride trend ?? A symmetrical chart pattern on PEL ??
From a broader perspective, the stock has been consolidating at these levels, considering the overall market structure and bearish sentiment in the Indian market and quarterly results show a decline in PEL profits.
Moreover, it raises the question—how many of you have opted for loans from PEL? "KON hain ye log, Kaha se atte hain!!" Compared to other loan providers, PEL doesn’t seem to stand out as a major player in the personal loan space or offer part
PShort
Nifty Breakdown: A Retest of 21,300-21,000 on the Cards?Nifty has decisively broken out of a Falling Wedge + Descending Triangle, confirming a Lower High-Lower Low (LH-LL) pattern. If this bearish momentum sustains, we could see the following levels:
Immediate downside toward 22,500
In the worst-case scenario, a retest of 21,300-21,000—the lows last seen during the election volatility of June 2024.
🚩 What’s Adding Pressure?
1️⃣ Midcap, Smallcap, and Microcap indices have also broken down from their bases, intensifying the bearish sentiment.
2️⃣
Wipro Looking for SupportHello friends good evening, I have prepared a chart for one of my trades in Wipro which I am sharing with you all. So as we can see the Wipro ADR ( American Depository Receipt) listed in the American market is trading down by 4 to 5 percent. In such a situation we can expect that we may see a similar decline in the price of Wipro shares tomorrow or in the coming session. Therefore I have marked a demand zone on its weekly chart and hope that the price will get a bounce from this demand zone, whi
DLFPrice is at triple bottom support, which is a bullish pattern. At the same time it is consolidating in the formation of descending triangle which is a bearish pattern.
So how to trade? Let us decode it.
Buy above 738 with the stop loss of 731 for the targets 746, 752, 760 and 768.
Sell below 724 with the stop loss of 731 for the targets 718, 712, 704 and 696.
Do your own analysis before taking any trade.
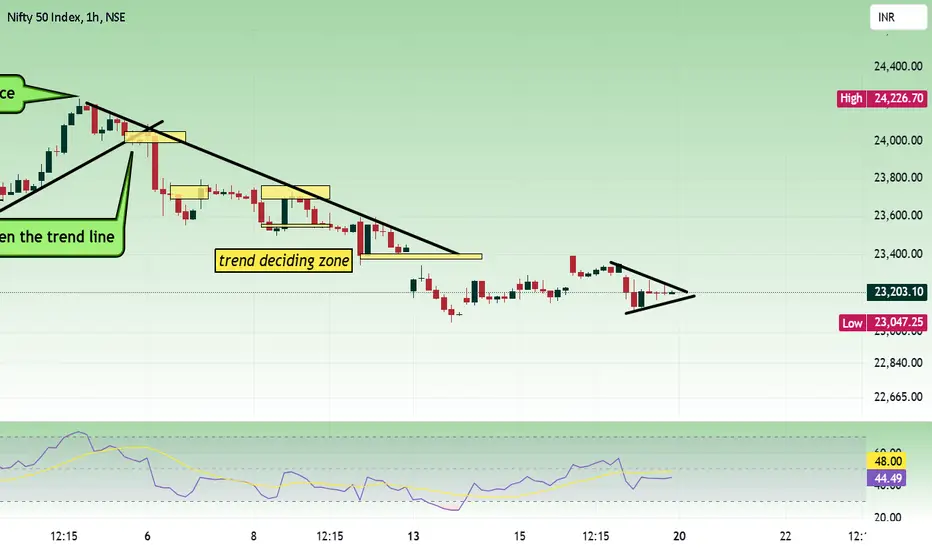
Nifty weekly review - Jan 20 to Jan 24Movement was bit choppy last weak and price tested the patience of option buyers. Still 23400 zone acts as an important zone to decide the direction.
Buy above 23220 with the stop loss of 23180 for the targets 23260, 23320, 23380, 23420 and 22460.
Sell below 23140 with the stop loss of 23180 for the targets 23100, 23060, 23010, 22960 and 22900.
As per the daily chart, price is still testing the support zone. Once the test is over, we can expect good move.
Do your own analysis before taking any