GOLD Triangle BreakoutGold has given a breakout from Triangle Pattern on 1D timeframe. It had been consolidating since November 2024.Longby Khwaish8
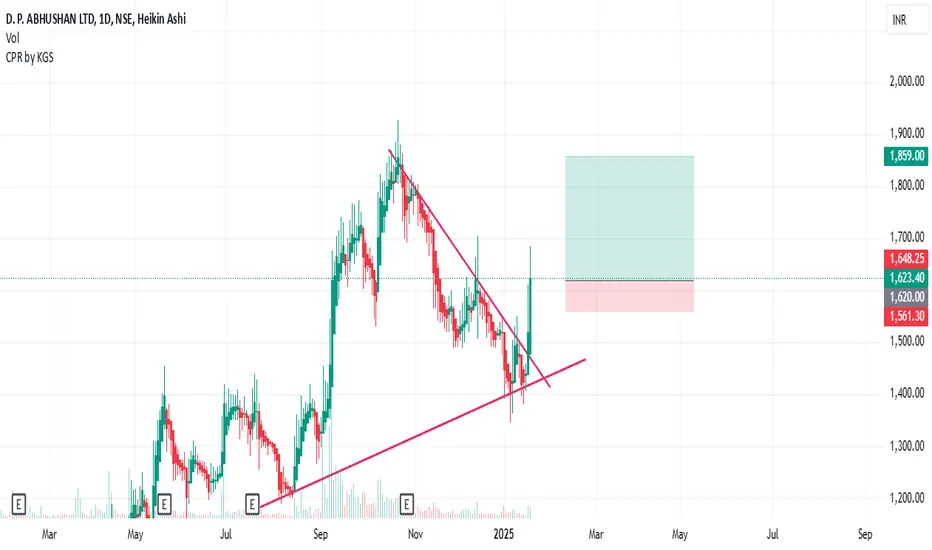
DPABHSHAN | Ascending Triangle Breakout | Swing TradeDPABHSHAN | Ascending Triangle Breakout | Swing Trade Stock giving a good breakout Chart Analysis: 1) Ascending Triangle Breakout 2) Market Structure Breakout 3) Breakout - Consolidation - BreakoutLongby Bigfoot_Academy1
$NSE:GSPLNSE:GSPL : Gujarat State Petro Ltd 🚀 I've spotted several key technical patterns and points of interest 📊: Descending Triangle Pattern 🔺 A clear descending triangle has formed from September 2023 to January 2025 Upper resistance line is descending from around ₹470 to ₹370 levels Lower support line has been relatively flat around ₹350-₹360 levels Price Action & Trend 📈 Currently showing a strong bullish candle with a +9.16% gain 📊 Price has broken above the descending triangleGLongby vkj1236
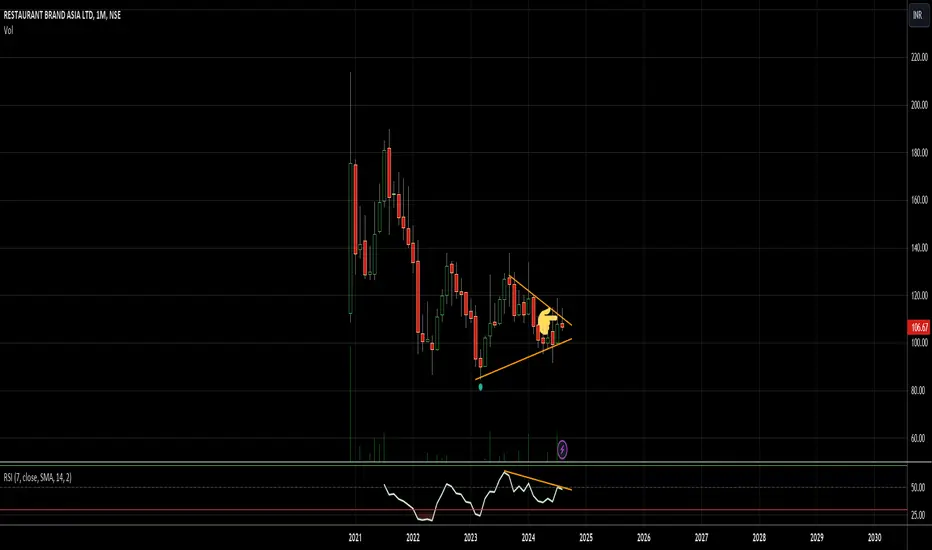
The Q.S.R. space is all heated up and they left of this poor oneLooking at Devyani at 200+ P/E Sapphire at 150+ P/E Jubilant Foodworks at 130+ P/E all the other players like Westside and others also playing at high valuations I feel recently listed RSA and BBQ nation are pretty cheapLongby liondewarangalUpdated 2
Birlasoft Ltd : Ready for a BreakoutBirlasoft Ltd is a company engaged in computer programming, consultancy, and related activities. It provides software development and IT consulting services. Pro: Almost debt-free Good profit growth of 18.2% CAGR over the last 5 years Healthy dividend payout of 28.3% Technical Analysis: \ The stock is forming a Descending triangle pattern , indicating a potential breakout. Volume is also building up from the last swing low. Expecting a good profit for the upcoming quarters Stop LossLongby Vikrant_MightyUpdated 311
Cesc double topMade double top at 209 broke trendline , broke 200 dma, bearish triangle breakout and retest or pullback to 200 dma is shorting opportunity closing above 200 dma can be taken as SL however rsi is little over sold ,short term might have pull back so pefer lower time frames to trade , usually triangle broader length would be target Disclaimer- Just my view and opinion trade at your own risk not an investment advice these are only for educational purposesShortby techno_funda_guy0
canfinhomescanfinhomes took 5 times support at 700 zone now broken before breaking formed a triangle retested around 860 now can go to 600 strongly bearish also below 200 dma, a strong down trend in between pullbacks might happen but is still sell on rise Disclaimer- Just my view and opinion trade at your own risk not an investment advice these are only for educational purposesShortby techno_funda_guy0
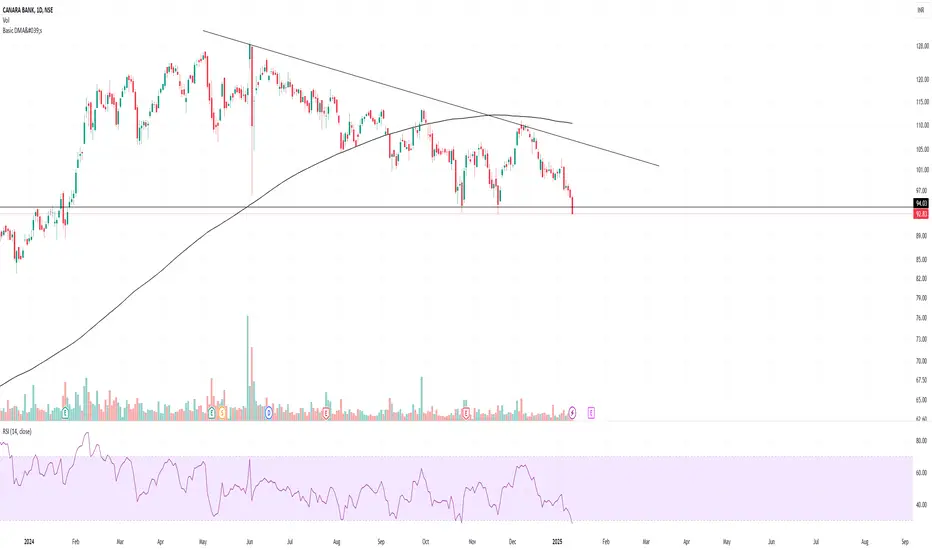
CANARABank took two times support at 92 what next ?canarabank bounced two times at 92 around ,more times the support is tested it will be broken however we can see it did made lower highs and is below 200 dma i think this time it will continue to be bearish every time on closing basis did not close below support we can see in past two points but this time closed almost at days low strongly bearish Disclaimer- Just my view and opinion trade at your own risk not an investment advice these are only for educational purposesShortby techno_funda_guy1
BSOFT Below 200 dmayou can see already below 200 dma, if broke below 530 first support and first tgt would be 60 points lower 470 second 390-410 Disclaimer- Just my view and opinion trade at your own risk not an investment advice these are only for educational purposesShortby techno_funda_guy1
SAGA Scending Triangle near SupportSAGA has formed a ascending triangle near Support and is currently following support and resistance. Any breakout above resistance may lead to trend reversalLongby LSN_86Updated 2
ICICI Bank Shorting Opportunity Confirmed: Multiple Bearish SignThe broader market has entered a bearish trend, and ICICI Bank, a less-moved stock compared to other banks, is now showing signs of catching up. Technical Confirmations: Trendline Break Ascending Triangle Breakdown Lower Lows Entry for Short : 1245-1243 Range (Can Take 1240/1260 PUT Option Current Month Expiry and/or Next Month Expiry to avoid Volatility) Target : Open/Mentioned. STOP Loss : 1275/Swing High How do you find this analysis? Follow for more actionable trade Shortby Vikrant_Mighty490
Double Symmetrical Triangle Breakout Plan in Navine FluorineI daily make educational content videos for swing / positional trading Long04:33by Apoorv-Dubey_SEBI-RA11
SWING (OBSERVATION) - SRF SRF - Script supported by huge volumes opened Gap up bouncing from demand zone now trading at major supply area (rejection zone) around 2660. Keep watch for sustained momentum to give new highs. Entry in 15m HH HL formation with last swing high as SL (150p) Longby CompoundingWithSwingNSESTOCKS0
Morepen Lab Near Key Support – Big Move Ahead?Morepen Laboratories (NSE: MOREPENLAB) - A Critical Technical Setup In-Depth Chart Analysis 1. Descending Trendline Resistance: • The stock is moving within a descending triangle pattern, with a clear downward trendline acting as resistance since the peak around ₹120. • Currently, the stock is approaching this trendline near ₹80. A breakout above this level, supported by strong volume, could trigger bullish momentum. 2. Key Moving Averages: • 200-Day EMA (Exponential Moving Average): The by Veersoni10811
SAGA_Target- In ascending triangle and is expected resume upward trend considering prior trend is up - Consolidation phase following trend line, Targets- Expected to reach prior highest high (1.6845) and next target is expected around reach (1.8085) in coming daysLongby LSN_86Updated 0
Detailed Price action analysis and swing trading ideas for 8 JanI make educational content videos for swing / positional trading Long07:16by Apoorv-Dubey_SEBI-RA412
CYIENT Cmp 1998 Triangle BOCYIENT Cmp 1998 dated 6-12-2024 1.Triangle BO @ 1995 (done) 2. Good Volumes Buy above 2002 target 2035-2050-2075-2100-2125-2150 SL 1940 It is just a view, please trade at your own risk. Longby ABC_XYZ1234Updated 10
Bharti Airtel Cmp 1682 Triangle BO with VolumesBharti Airtel Cmp 1682 dated 13-12-2024 1. Ascending Triangle BO @ 1685 2. Price rise with Volumes 3. RSI BO Buy above 1685 SL 1630 target 1700-1715-1730-1745-1750-1760-1770-1780 Pattern target 1860 SL 1585 It is just a view, please trade at your own risk.Longby ABC_XYZ1234Updated 5
FSL breaking out of a ascending triangle FSL is breaking out of ascending triangle with increased volume. Stoploss:370.00 Target:442.00 NSE:FSL Longby Punit1900
FSL breaking out of a ascending triangle FSL is breaking out of ascending triangle with increased volume. Stoploss:370.00 Target:442.00 NSE:FSL Longby Punit1900
Positional Long/Reversal Setup: PVR Inox PVR has given a correction of ~40% from its latest High and is trading at a important make or break level. Current price structure is following a Descending triangle pattern, supported by the golden ratio zone based on swings from 2020 onwards. The daily RSI is at 28.41, indicating the stock is approaching oversold territory, which may precede a potential reversal. Also the CCI is at -131.31, placing it in the oversold range, which could indicate a potential price reversal. PVR is cuLongby DebasisT1
Praj Industries big breakout expected triangle pattern.More upside expected after the breakout from this triangle Pattern and range consolidation. Easy and great fundamentals.by gupta_96196614
Tilak Nagar triangle pattern breakout expectedWinters are here and liquor sales are going rocket. Tilaknagar allied blenders united spirits all are expected to go high next quarter numbers will give more boost to this rallyLongby gupta_9619665
SBICards-Can it finally make a comeback?SBICards has been underperforming since last few years. 700-730 has proven to be a strong demand zone for the stock historically and looks like history is getting repeated. 950-1000 is a strong supply zone. Once it is broken, we can see this stock fly to new highs. Currently, stock is a perfect example of buy low, sell high.Longby chartistameyUpdated 13
 LongLong
 Long
 Long
 Long
 Short
 Short
 ShortShort
 Long

 Short
 Long
 Long
 Long
 Long
 Long
 Long
 LongLong
 Long

 Long
 Long