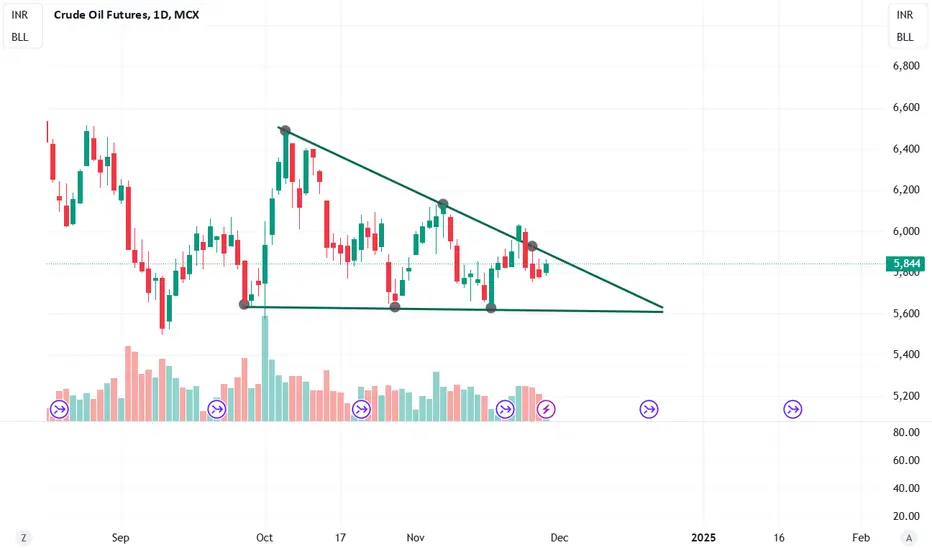
Triangle
CHALET 1D1. Pattern Breakout: Ascending triangle breakout on the daily chart.
2. Volume Confirmation: High volume (6.16M) supports the breakout.
3. Price Action: Current price at ₹1,013.85, up 9.28%.
4. Resistance Turned Support: Previous resistance at ₹900 now acts as support.
5. Target Projection: Potential upside target around ₹1,100 based on the breakout.
6. Trend: Strong bullish momentum indicating trend continuation.
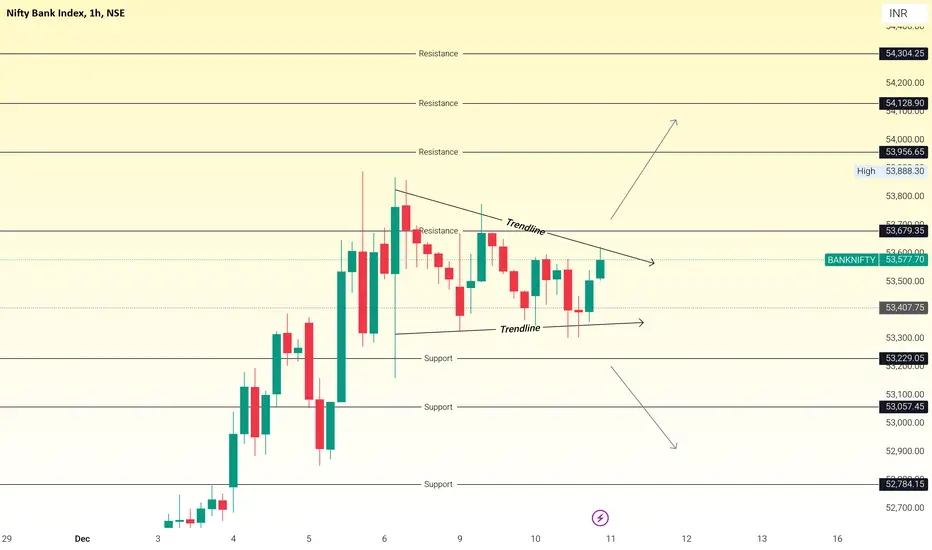
#banknifty -11th December!NSE:BANKNIFTY1! NSE:BANKNIFTY
Understand the chart, observe the analysis, implement while trading:
Key Observations:
1. Trendlines:
- Resistance Trendline: A descending trendline (sloping down) marks the area where the price faces selling pressure. This indicates a pattern of lower highs.
- Support Trendline: An upward-sloping trendline beneath the price indicates where the price finds buying interest. This suggests a slight upward momentum at the support level.
2. Consolidation Z
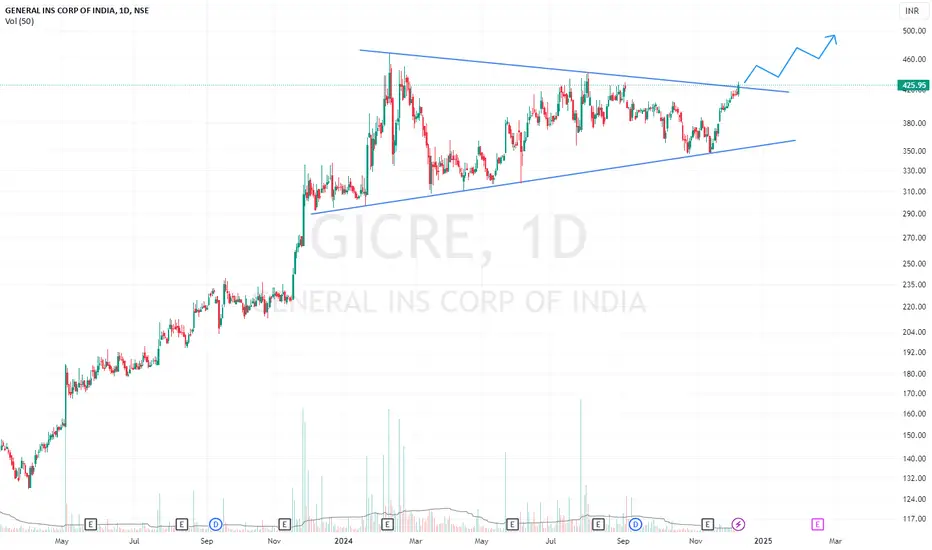
Triangle pattern breakout Please look into the chart for a detailed understanding.
Consider these for short-term & swing trades with 2% profit.
For BTST trades consider booking target for 1%-2%
For long-term trades look out for resistance drawn above closing.
Please consider these ideas for educational purpose
Please note that, if there are some big targets, those are drawn thinking for long term.
Triangle Double bottom breakoutPlease look into the chart for a detailed understanding.
Consider these for short-term & swing trades with 2% profit.
For BTST trades consider booking target for 1%-2%
For long-term trades look out for resistance drawn above closing.
Please consider these ideas for educational purpose
Please note that, if there are some big targets, those are drawn thinking for long term.
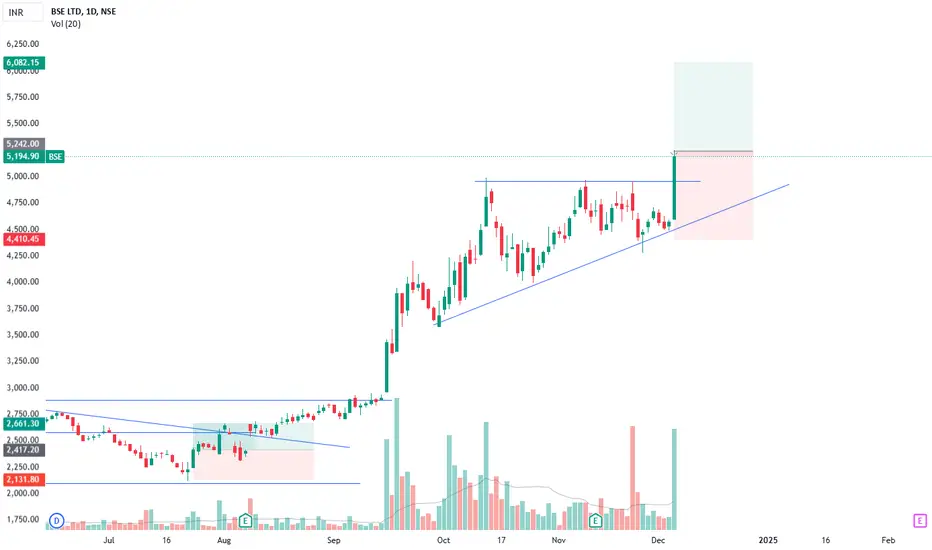
Triangle pattern breakout BSEPlease look into the chart for a detailed understanding.
Consider these for short-term & swing trades with 2% profit.
For BTST trades consider booking target for 1%-2%
For long-term trades look out for resistance drawn above closing.
Please consider these ideas for educational purpose
Please note that, if there are some big targets, those are drawn thinking for long term.
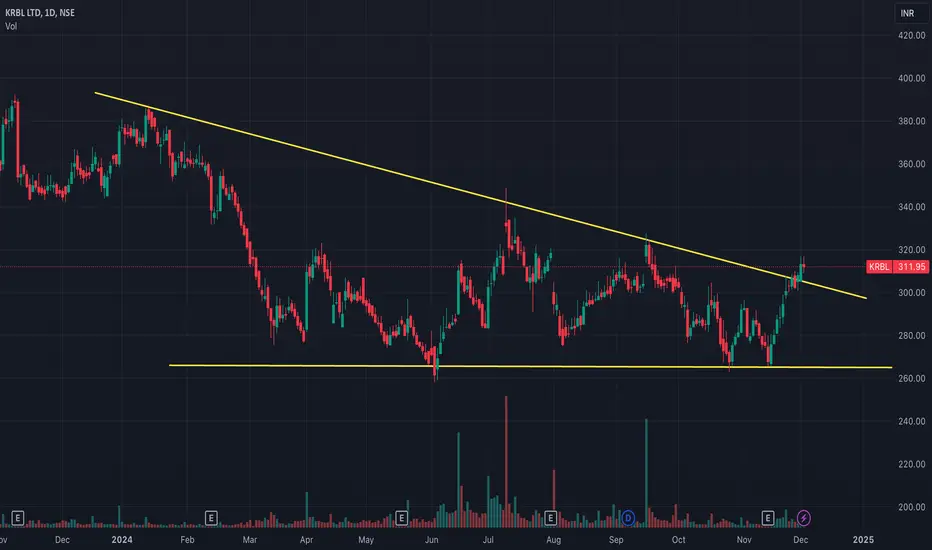
Union Bank of India Triangle BreakoutThe stock is breaking out of a descending triangle pattern and has successfully retested the breakout level. A bullish momentum is expected as the retest holds strong, supported by rising volume and favorable technical indicators.
Trade Setup:
Entry: ₹126.06 (current price near breakout zone)
Stop Loss: ₹117.50 (below key support level)
Target: ₹159.88 (measured move based on triangle height projection)
Technical Observations:
200 EMA Support: The price has reclaimed the 200
PREMIERENE - ascending triangle - WatchlistThis chart show a technical analysis for Premier Energies Ltd.
The two panels display price action with candlesticks on the right and line chart on the left.
The yellow lines suggest a pattern analysis, likely an ascending triangle, as indicated by the higher lows and horizontal resistance around ₹1,267.95.
Key observations:
Resistance Level: ₹1,244 is acting as a major horizontal resistance.
Support Trendline: The yellow ascending trendline is connecting the higher lows, indicating bullish
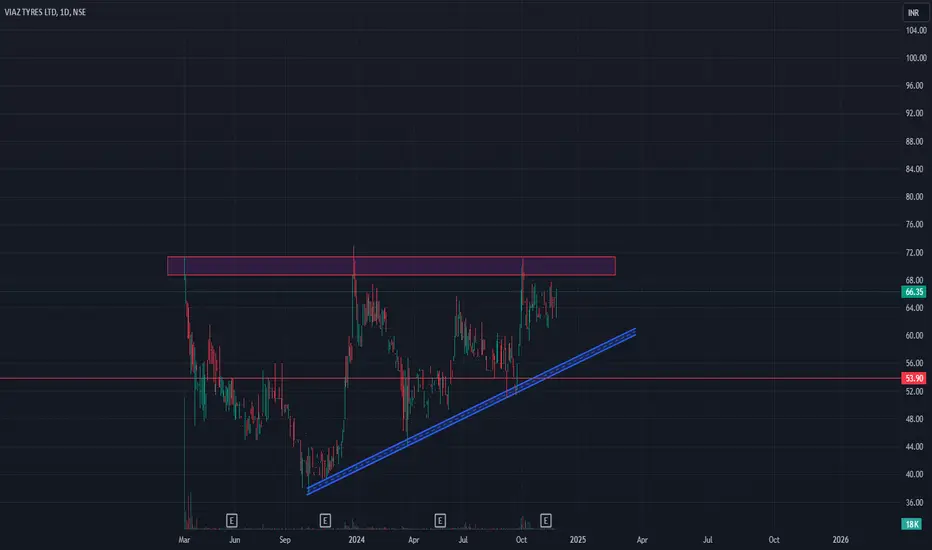
Viaz Tyres Ltd: On the Verge of a Major Breakout or ReversalKey Highlights:
Resistance Zone (₹70-₹72):
The chart shows a well-defined resistance zone marked in red. This level has been tested multiple times without a breakout, making it a critical hurdle for the stock.
Ascending Trendline Support:
The blue trendline indicates a steady upward movement, with the stock consistently making higher lows. This trendline is currently acting as a strong support level, near ₹63.
Critical Support Level (₹53.90):
A red horizontal line at ₹53.90 highlight
RCF Limited: Triangle Breakout & Double Bottom FormationTechnical Analysis:
RCF Limited showcases a triangle chart pattern breakout supported by the formation of a double bottom pattern, a powerful bullish reversal signal. This dual pattern alignment strengthens the bullish case, with the breakout above 176 marking a key entry point for traders.
Trade Setup:
Entry: Above 176
Stop Loss (SL): 158
Target: 274
Pattern Highlights:
The triangle breakout confirms a shift in momentum, with increased buying pressure at critical levels.
The d
ISEC - Price is near breakoutThis stock form triangle pattern from September 2024 in day time frame. This camer near breakout and bock wick formed over resistance. We can wait for tomorrow confirmation and then decide about entry or wait.
ILong