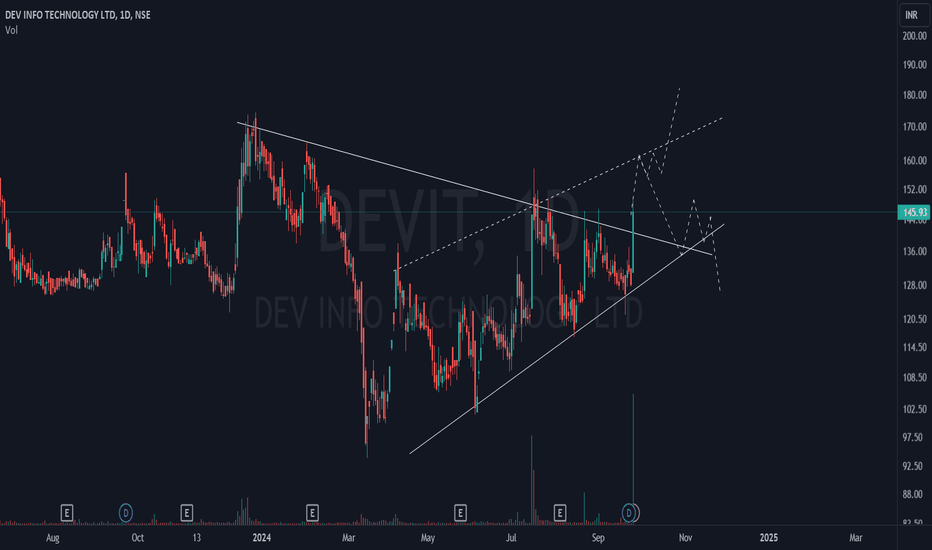
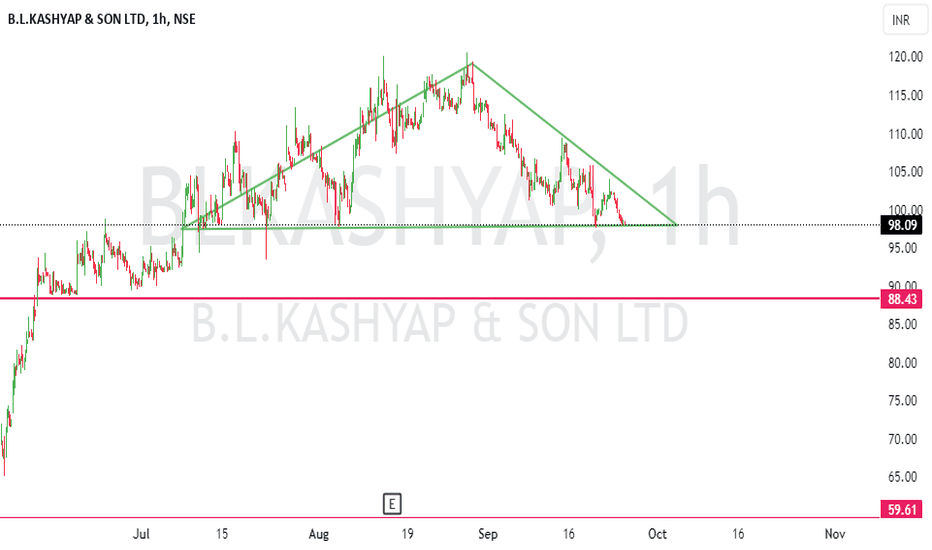
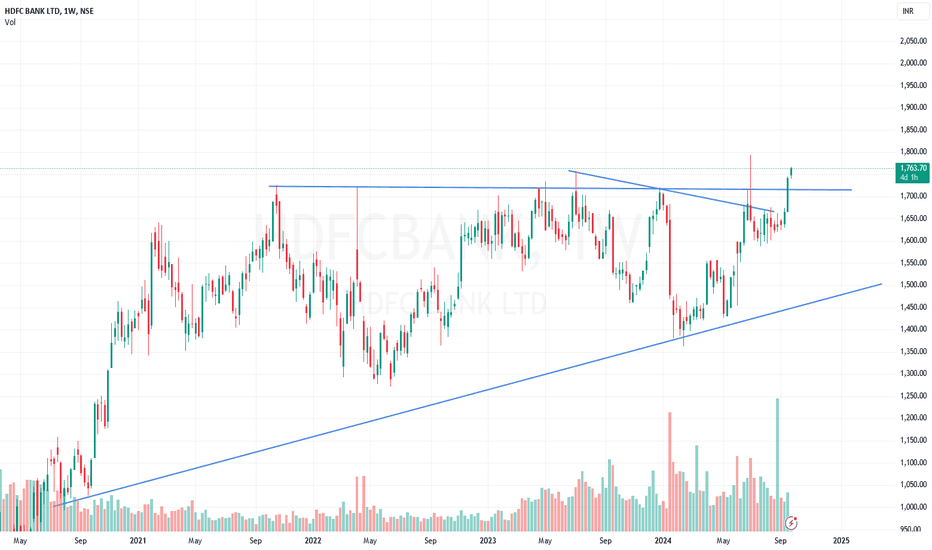
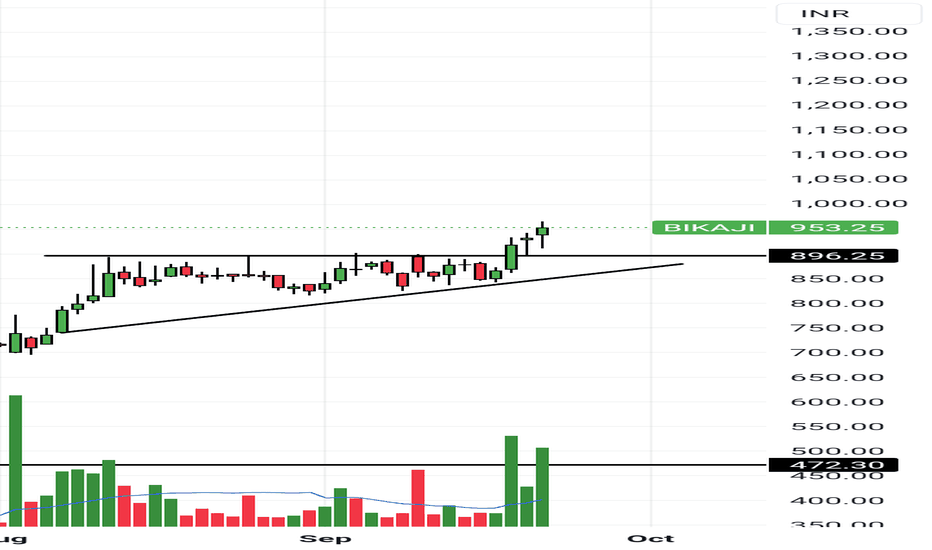
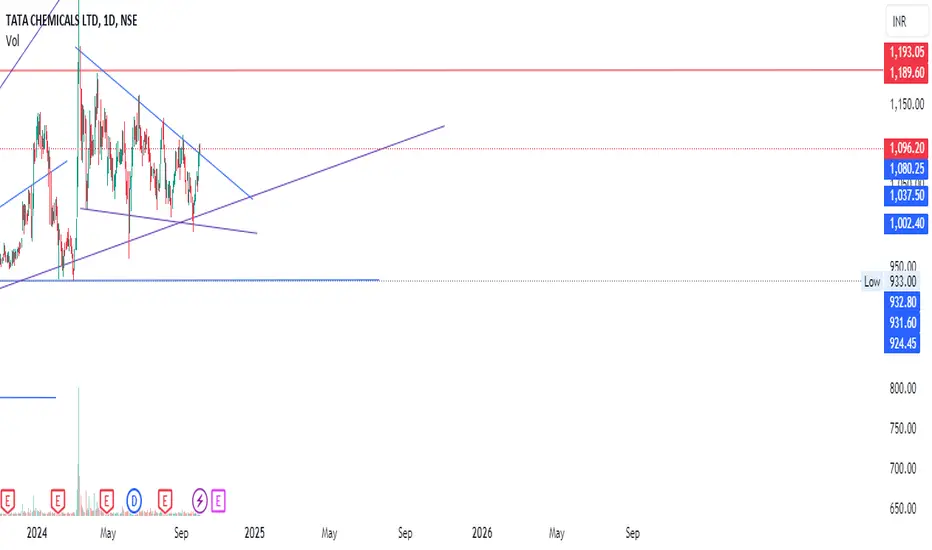
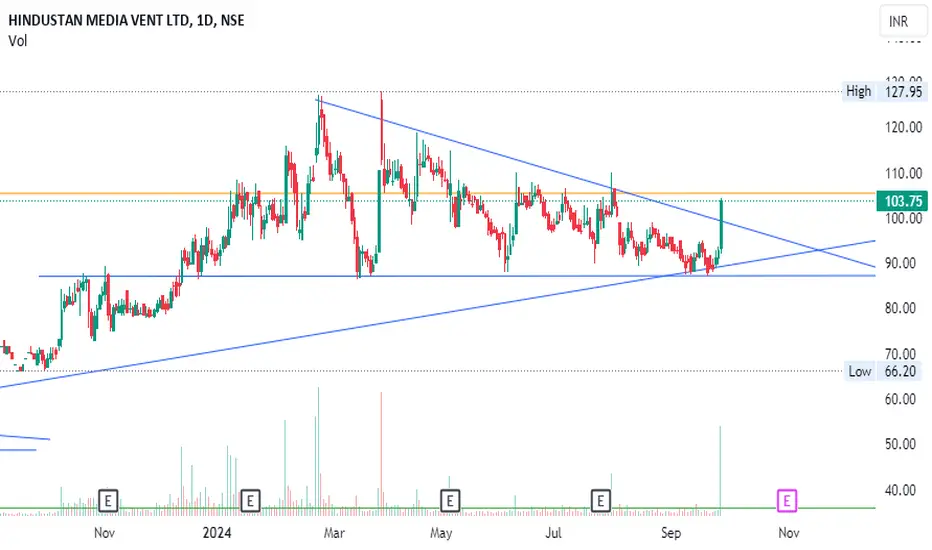
Triangle
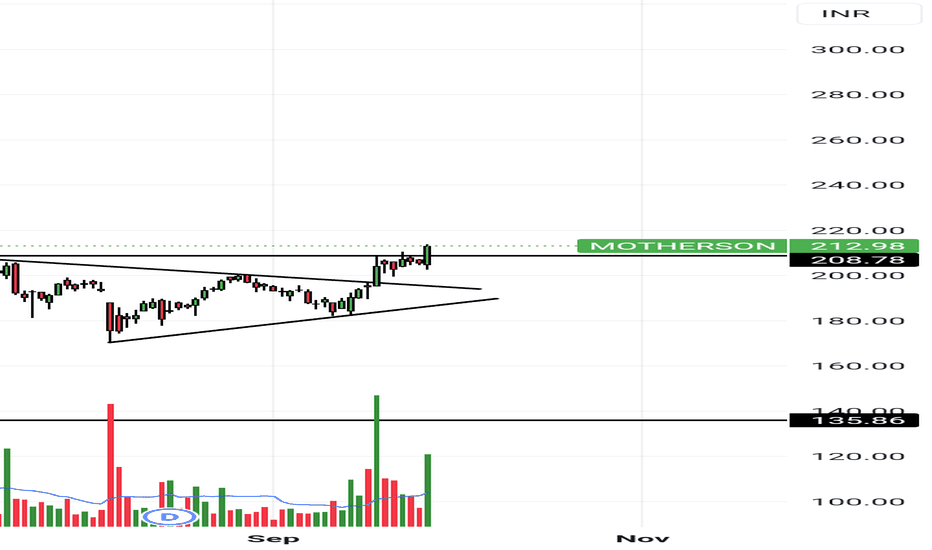
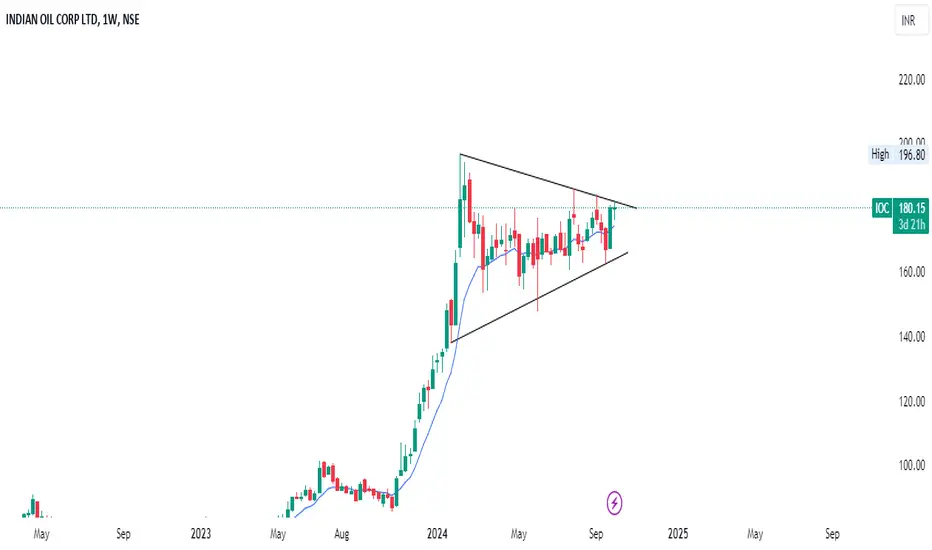
IOCIOC - Need to Break the range for move upside
Hello traders,
As always, simple and neat charts so everyone can understand and not make it too complicated.
rest details mentioned in the chart.
will be posting more such ideas like this. Until that, like share and follow :)
check my other ideas to get to know about all the successful trades based on price action.
Thanks,
Ajay.
keep learning and keep earning.
Tata Steel Swing Idea (Long)Tata steel might give breakout due to following technical reason's:
1. Double bottom formation
2. Trading above 200 & 20 EMA's
3. Symmetrical Triangle formation
4. Swing Low's are not broken
5. On Monthly pin bar formation, weekly double
pin bar break out on progress
(Note: Author not responsible for anyone profit or loss, nor a sebi registered RA, this only for educational purpose. Please do your own due diligence before taking any trades.)
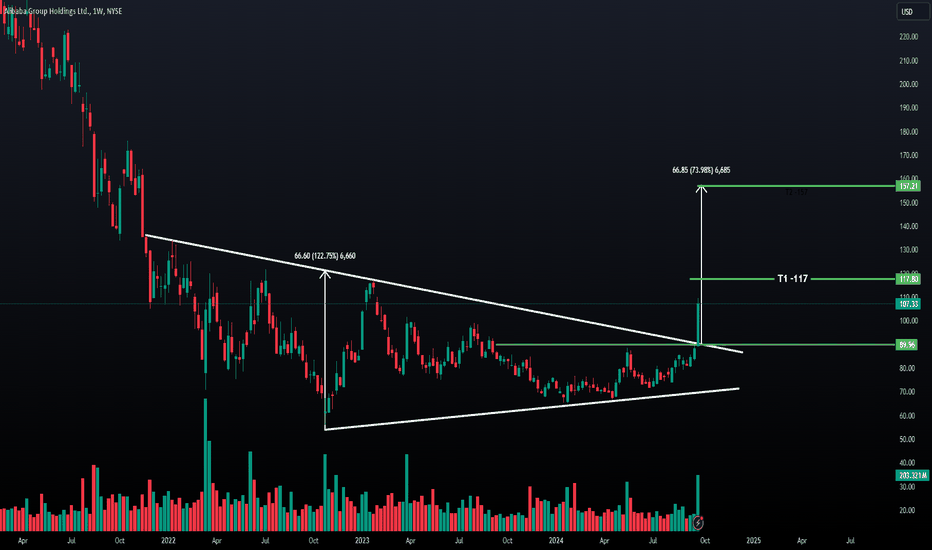
BABA - Symmetrical triangle breakout -Daily - LongThe pattern in the Alibaba (BABA) chart looks like a symmetrical triangle breakout, not a descending wedge. Here's how it aligns:
Symmetrical Triangle: This pattern consists of converging trendlines, where both the highs and lows are moving towards a point, forming a triangle. It typically indicates a period of consolidation before the price breaks out, either upward or downward.
Breakout: In this case, the price has broken out upwards from the symmetrical triangle, which is often a bullish signal when seen in an uptrend or after a prolonged period of price consolidation.
Measured Move: The target price is calculated by measuring the height of the triangle and adding it to the breakout point. This gives a potential target around $157.21 as marked on the chart.
Volume Confirmation: The breakout is supported by a surge in trading volume, which helps validate the breakout's strength.
In summary, the symmetrical triangle breakout suggests a continuation of the bullish momentum, with key targets around $117 (first target) and $157 (second target).
GOLD - LongThe chart analysis for Gold (CFDs on Gold, US$/Oz) shows a breakout pattern indicating a strong upward movement. Key observations include:
Long-term Ascending Triangle: The chart depicts a long-term ascending triangle, a bullish continuation pattern, indicating a potential further rise.
Breakout and Target: A breakout from the triangle suggests a target price of approximately $3,142.47, which represents a move of about 45.60% from the recent level of $2,648.66.
Support Levels: Historical support levels are clearly visible, with $720.67 and $250.23 as key areas where price consolidated in past decades.
This suggests that gold is in a strong upward trend with bullish sentiment, especially following the breakout from the long-term triangle. The price target and volume indicate possible further gains.
For deeper analysis, one could evaluate macroeconomic factors, such as inflation, central bank policies, and demand for safe-haven assets like gold.
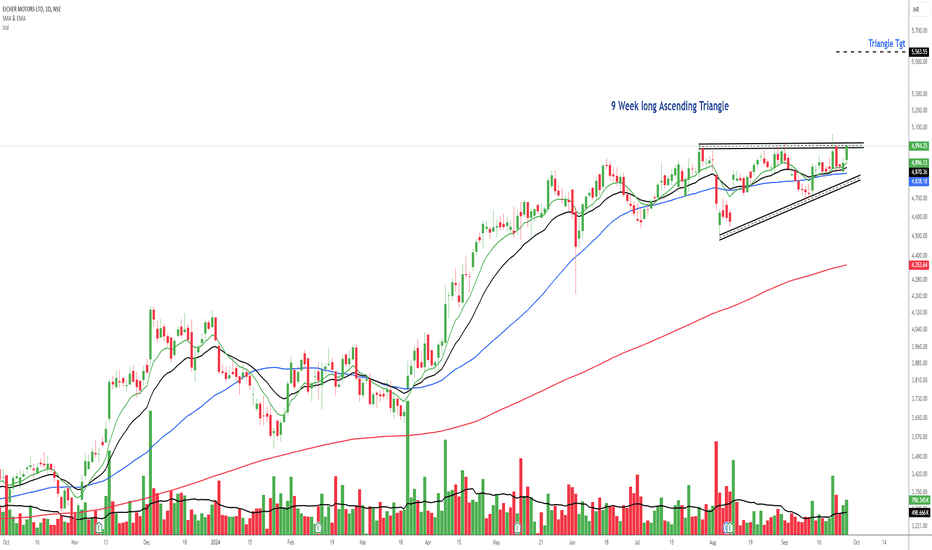
Eicher Motors Ltd: Ascending Triangle PatternEicher Motors Ltd: Ascending Triangle Pattern
Breaks out soon stock
12% upside potential
9 Week long base.
Plan your trade accordingly.
Views are for ‘’EDUCATIONAL PURPOSE ONLY’’,trade at your own risk.
"Trade what you see, Not what You Think"
Happy Trading(:)
Accelya Kale Triangle + RSI breakoutAccelya Kale solutions is a software solutions provider for airline and travel industry which has good fundamentals and stellar OPM, ROE & ROCE with reduction in debtor days and increase in operating cashflow.
Technicals:
Stock has made RSI breakout in weekly timeframe. Price yet to make move strong. 30-40% potential to rise
Cons:
Working capital days increased
Dividend payout ratio above 70%
Stock trading 9 times the book value
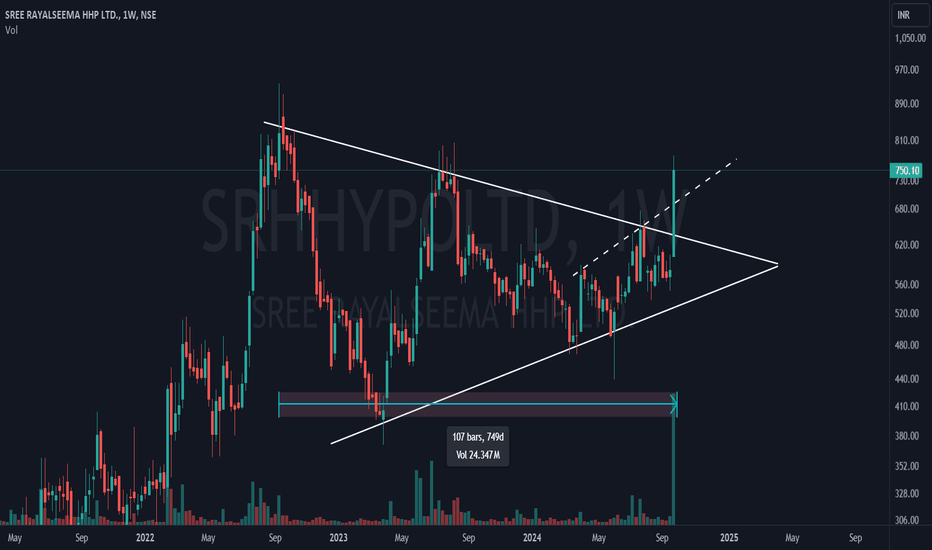
Sree Rayalaseema Hi-Strength Hypo Ltd Ready for TrianglebreakoutSree Rayalaseema Hi-Strength Hypo Ltd witnessing good volume this week. 87% rising potential. Company has reduced debt and debt free. Reasonably good financials. Technicals looking good. Triangle breakout with target as 779.50 and 1258.25
Skipper Ltd - Triangle Pattern Breakout FormedFundamental Overview of company :
Skipper is the market leader in the manufacture of T&D structures and distribution poles. It is positioned among the 10 largest global T&D structure manufacturers. It is India’s largest and world's only Integrated T&D company having its own Structure rolling, manufacturing, Tower Load Testing Station & Transmission Line EPC.
Technical Analysis :
1. Bullish closing candle above recent resistance line gives confidence to show further momentum on the top side.
2. In terms of chart pattern, NSE:SKIPPER formed triangle chart pattern breakout starting from June 2024 to Sept 2024.
3. Price struggled to close above 463.8 almost 4 consecutive days from 21 aug 2024 - 25 aug 2024 but failed to cross the resistance. but today stock price successfully closed above the resistance gives confidence for further swing.
4. Strong volume indicates the presence of heavy transactions happened at this price point indicating interest among the market participants
Risk Reward Ratio :
We can focus 1:1 risk reward ratio on this trade considering support and resistance.
Exit points :
One can consider to exit from this stock on 2 factors
1. Day candle closure below trendline
2. Day candle close below Stop loss
MidCap Nifty - Sep 23Price is consolidating in the form of triangle and also it is at support.
Buy above 13100 with the stop loss of 13060 for the targets 13140, 13180, 13220 and 13260.
Sell below 12980 with the stop loss of 13020 for the targets 12940, 12900, 12860 and 12820.
Check the live market updates.
Hit the like button to Rock !! Show some energy !!
Note : This is my pre market analysis and my trading journal. Not a suggestion to buy or sell.
You are responsible for whatever you do.