ARBUSDT: Will This Key Support Hold or Trigger a Reversal?Yello, Paradisers! ARBUSDT has formed a descending triangle pattern accompanied by bullish divergence, and the current price rests within a key support zone, heightening the potential for an upward move.
💎If ARBUSDT shows an I-CHoCH (internal change of character) or develops bullish formations like a W-pattern or inverse head and shoulders from here, the likelihood of an upward move increases significantly.
💎A more secure signal would be a breakout with a candle close above the resistance zon
Triangle
Pidilite Industries - Descending TriangleThe descending triangle chart pattern in Pidilite Industries Ltd. suggests a potential bearish trend. It forms with a horizontal support level and a downward-sloping resistance line. As price consolidates, if breakdown below the support may signal a further decline, indicating possible weakness in the stock. Traders often watch for a breakout confirmation.
Descending Triangle 60% continuation and 40% reversal.
MN HOLDINGS - Potential of making Bullish Symmetrical Triangle ?MN HOLDINGS - Current Price RM0.920
In long term the stock is still UPTREND as it is above 200-day EMA. In short and medium term, the stock is in sideway/consolidation.
The declined from 12 Aug 2024 (high RM1.12) to 29 Aug 2024 (low RM0.820) is due to weak market sentiment and profit taking activity. At current situation, the stock have a potential of making Bullish Symmetrical Triangle. If price made a breakout above the pattern, then it will trigger a buy signal (as it is viewed as Bullis
The Symmetrical Triangle: Real Success Rates + Breakout.The Symmetrical Triangle: Real Success Rates + Breakout.
The symmetrical triangle is an important chart pattern in technical analysis, deserving special attention from professional traders.
This formation is characterized by a convergence of prices between two trendlines, one descending and the other ascending, creating a consolidation zone where indecision between buyers and sellers is palpable.
Statistical Analysis
Empirical data reveals that the success rate of the symmetrical triangle for
BALKRISIND Descending Triangle Pattern NSE:BALKRISIND
Chart Patterm : Descending Triangle pattern.
📉 Descending Triangle Pattern 📉
The Descending Triangle is marked by a series of lower highs and a relatively flat support level. It’s typically a bearish continuation pattern, suggesting the price might break below the support level after the consolidation phase.
Possible Targets Based on the Pattern:
🔻 Breakdown Target: If the stock breaks below the support level around ₹2779.00, the target can be estimated by measuring the he
Private Banks looks goodA triangle breakout might be possible
The Bank from East India is the owner of the then famous Gruh Finance that was a multibagger
But, this has been behaving like a beggar till now
Lets see if this breakout gives investors a chance to make bucks.
NSE:IDFCFIRSTB is another good bank in Private space.
CDSL - Descending TriangleNSE:CDSL
📅 Date : 14-10-2024
📉 Chart Pattern : Descending Triangle
🕒 Time Frame : Daily Chart
💹 CMP : 1518
Buy Above : 1525
🎯 Targets : 1840 (3 Months)
🔻 Stop Loss Level : Closing Below 1465
How does the descending triangle pattern form?
A descending triangle pattern shows the behavior of sellers. It describes sellers as more aggressive than buyers, causing prices to fall and make continuous lower highs. This trend indicates weakening demand for the security, but a horizonta
Symmetrical Triangle Setup With Consolidation about to BlastNSE:INDIGOPNTS on the Weekly timeframe is making a Symmetrical Triangle setup that can break on the upside because the price has been consolidated for the past 14 weeks in a Narrow Range after Getting Accumulated Near the Key Zone, Followed By a Volume Blast.
A Close or Breakout of the Setup Next Week will be confirmed if Followed by Similar Volumes.
Keep this on your Watchlist. Meanwhile, Check out my other stock ideas below until this trade gets activated. I would love your feedback.
D
SAIL Bullish setup for 1:4 risk reward Metal sector is near reversal, it has retested breakout level of 9493.
SAIL Also retested the breakout and made reversal with strong volume candle.
SWING TRADE
Buy SAIL
Above 131
Stop Loss: 125
Target 1 (1:2) 142
Target 2 (1:3) 148
Target 3 (1:4) 153
Duration 3-4 months
Trade as per your risk-taking capacity
VERANDA - Breakout and RetestPrice breakout triangle and came back inside the triangle and it formed hammer like candle now (Weekly Timeframe). We should consider entering a trade only if a strong green candle forms in the next session. On the daily timeframe, it appears to be forming a morning star-like structure.
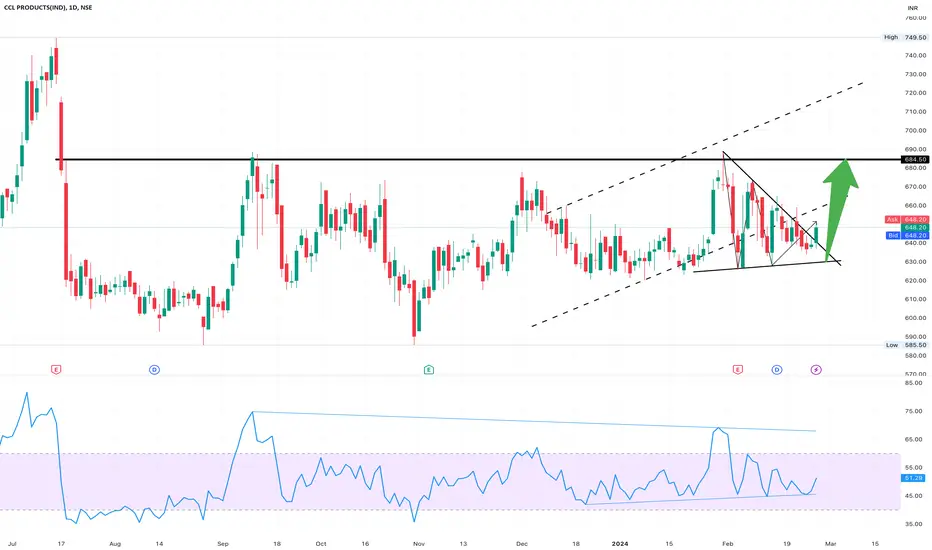
CCL Products (India) Ltd Looks Good!Script - NSE:CCL
Pattern: Symmetrical Continuation Triangle
The recent price movement indicates a breakout from a consolidation phase, signaling a probable continuation of the previous uptrend.
In a Bullish Symmetrical Continuation Triangle, there are two trendlines converging as prices form lower highs and higher lows. During this consolidation, trading volume typically decreases as the price fluctuates within a tightening range, reflecting uncertainty among market participants.
However,
DMART for 35% (approx..) Potential GainAvenue Supermart is showing a potential breakout on symmetrical triangle pattern. its sales also increasing QOQ and PBT as well.
( www.screener.in )
All data is available in public domain..
CMP : 4300
TG : 5600
SL : Below 21 day EMA
Stock's selection based on 5 Point Analysis:
1: Idea : Breakout.
2: Support : Volume, Delivery & VWAP.
3: Technical : 9/21/55/200-EMA, RS>0, MACD, RSI & Super trend up.
4: Fundamental : PE, PAT, Industry & peer PE and sector performance.
5: Timing : Entry T
fifth idea .descenging triangle on matic . if it breaks support line then can reach to .2145 and continue bearish trend . Otherwise continuee itself.
MShort
Nifty karo ya maro zone..Nifty hourly tringle pattern zone.. any side closing big move expected .downside limited just becoz of oversold zone. Risky player initiate buy signal nd sl will hourly candle close below lower line ..safest bat risk reward will b too big . Upside first target 25000/25100/25200/25396.
Actual Success Rates of Ascending and Descending TrianglesActual Success Rates of Ascending and Descending Triangles
Here is an analysis of the actual success rates of ascending and descending triangles in trading, based on the information provided:
Success Rates
Ascending and descending triangles generally have fairly high success rates as continuation patterns:
-The ascending triangle has a success rate of approximately 72.77%.
-The descending triangle has a slightly higher success rate of 72.93%.
These numbers come from a study that tested over