LTF : Symmetrical Triangle Breakout🚀 L&T Finance Ltd : Symmetrical Triangle Breakout 📈
- Date: 12/09/2024
- Symbol: LTF
- Chart Pattern : Symmetrical Triangle Breakout
- Time Frame : Daily Chart
- CMP : ₹177
- Targets : ₹219 (3-4 Months)
- Stop Loss Level : Closing Below ₹165
🔔 Disclaimer:
I am not a SEBI registered analyst. The charts and levels are posted for educational purposes only; they are not recommendations. Please consult your financial advisor before trading or investing. I am not responsible for any gains
Triangle
RELIANCENSE:RELIANCE
**Date:** 30/09/2024
**Chart Pattern:** Triangle Breakout
**Time Frame:** Daily Chart
**Buy at CMP:** 3020, add more on dips until 3000
**Target:** 3340 (within 4 months)
**Stop Loss Level:** Close below 2995
---
**Disclaimer:** This trade idea is for informational purposes only and does not constitute investment advice. Investing in financial markets involves risk, including the potential loss of principal. Please consult with a qualified financial advisor before making any in
Diverse Trading Strategies for UGRO Capital LtdUGRO Capital Ltd is currently exhibiting a symmetrical triangle pattern, characterized by converging trend lines drawn in black. This technical formation is indicative of a potential continuation or reversal pattern, often signaling an impending breakout, either upward or downward.
Within this chart pattern, the upper trend line serves as a short-term resistance zone, while the price action has encountered difficulties in surpassing this level. A counter-trendline, represented by a dotted blac
LUPIN - Symmetrical Triangle - Breakout -Daily The chart for **Lupin Ltd.** shows a **Bullish Ascending Triangle** pattern, a continuation formation that often leads to a breakout to the upside. Below is a comprehensive breakdown of both the technical and fundamental analysis for Lupin Ltd.
### **Technical Analysis:**
1. **Symmetrical Triangle Pattern**:
- The stock price formed an **Symmetrical triangle** where the resistance level near **2,298.00 INR** was tested multiple times, while the lows were rising, creating higher lows over ti
Finnifty - Oct 8Morning session was trending and afternoon session was choppy today. We have a big consolidation zone now.
Buy above 23440 with the stop loss of 23400 for the targets 23480, 23520, 23560 and 23620.
Sell below 23360 with the stop loss of 23400 for the targets 23320, 23280, 23240, 23200 and 23160.
Check the live market updates.
Hit the like button to Rock !! Show some energy !!
Note : This is my pre market analysis and my trading journal. Not a suggestion to buy or sell.
You are responsible for
Stock Analysis: CARE Ratings Ltd (Daily Time Frame)Pattern Identified: Bullish Symmetrical Triangle
A bullish symmetrical triangle has formed on the daily chart of CARE Ratings Ltd, indicating that the stock is consolidating and may be poised for an upward breakout.
1) Last Candle: The most recent candle is significant, showing a large bullish move with a noticeable volume spike. This is often a signal of strong buying interest.
2) Breakout Strategy: A potential breakout trade can be considered once the stock breaks above the high of the pre
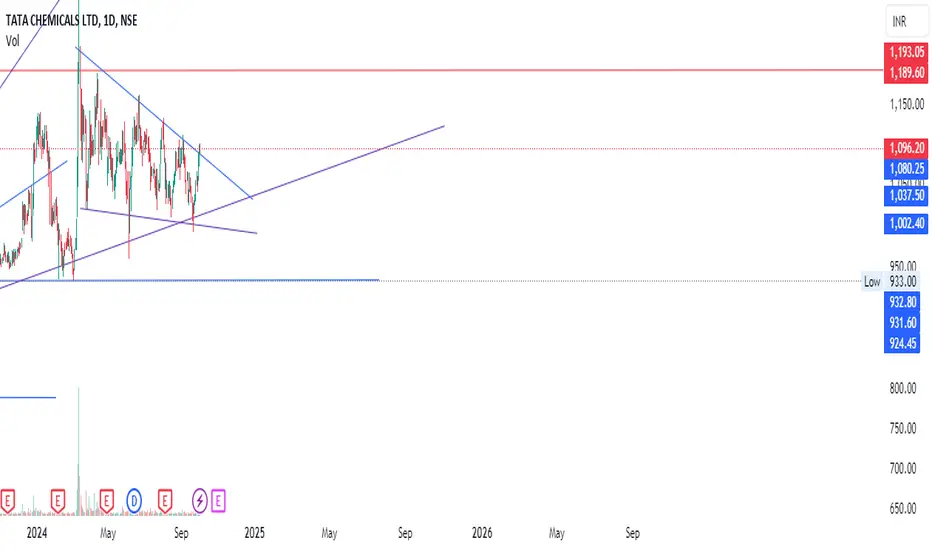
TATA CHEMICALS Swing Idea (Long)Tata chemical is preparing for breakout in upcoming weeks due to following technical reason:
1) Breakdown failure of M pattern
2) Previous resistance for breakdown will act as support now
3) Asymmetrical tringle pattern formation
4) On Daily candlestick chart trading above 20,50&
200 ema
On Weekly candlestick chart trading above 20 &
50 EMA
On Monthly candlestick chart dragonfly doji
formation indicating buyers in control
(Note: I am neither responsible for anyon
Cummins India Swing Idea (Long)Cummins India is looking for breakout due to following reason :
1) Swing Low are shifting upper side
2) Double Bottom pattern / W pattern
3) Ascending Triangle pattern formation
4)Trading above 20,50 & 200 EMA on daily chart
(Note: I am neither responsible for anyone's profit or loss nor I'm a sebi registered RA, this only for educational purpose. Please do your own due diligence before taking any trades.)
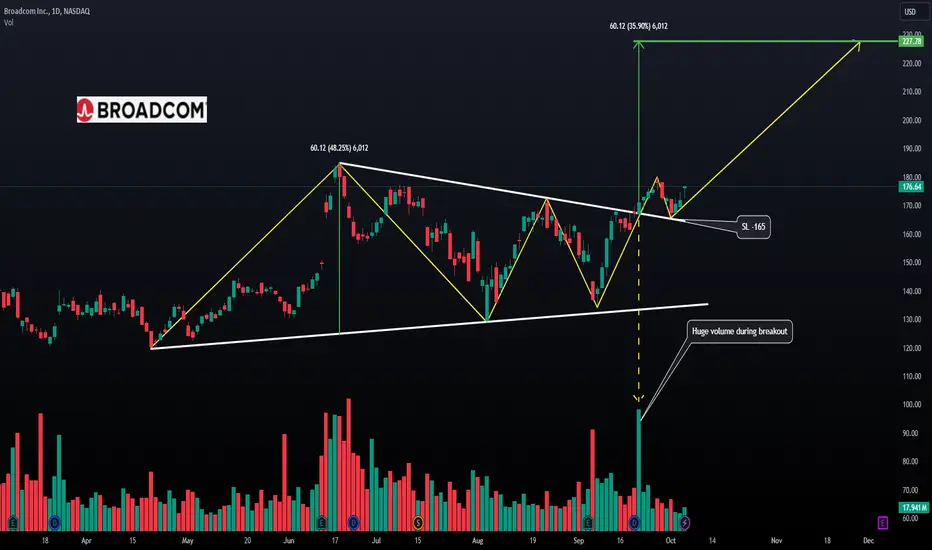
AVGO -Symmetrical triangle -Daily - Unusual volume **Broadcom Inc. (AVGO)** chart and presents a technical analysis of the stock on a daily timeframe.
Key highlights:
1. **Bullish Pattern**: The chart seems to show a series of bullish moves with higher highs and higher lows, which are connected by yellow lines. This pattern may be interpreted as an symmetrical triangle, a bullish continuation pattern.
2. **Breakout**: A breakout is indicated on the right side of the chart, which seems to have occurred on **high volume**, further supporting t
SAKHTISUGSAKHTISUG - market fall but stock stand positive
Hello traders,
As always, simple and neat charts so everyone can understand and not make it too complicated.
rest details mentioned in the chart.
will be posting more such ideas like this. Until that, like share and follow :)
check my other ideas to get to know about all the successful trades based on price action.
Thanks,
Ajay.
keep learning and keep earning.
JPPOWER - Risky - Triangle BO -Wkly- Near Multiyear BOJPPOWER -Risky bet -
The Jaiprakash Power Ventures Ltd. (JP Power) weekly chart shows significant bullish momentum after a prolonged period of accumulation. Here’s an analysis based on the chart you provided:
### 1. **Cup and Handle Formation**
- **Cup Formation (2017-2023)**: The chart clearly shows a large **cup pattern**, which is a bullish continuation pattern. It started forming around 2017 and completed in 2023. The depth of this cup indicates a long consolidation phase, with strong
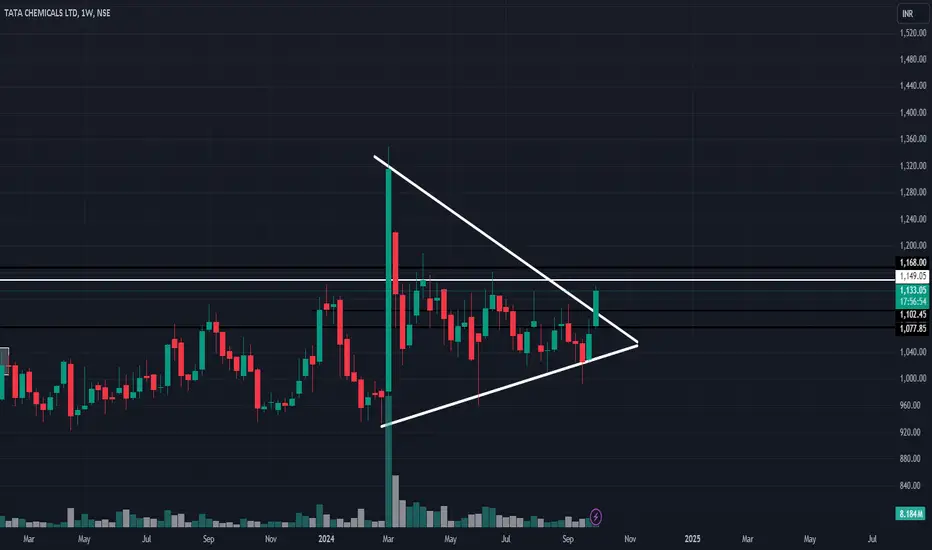
TATA CHEMICAL WEEKLY TRIANGLE BREAKOUT A triangle breakout is a significant event in technical analysis, indicating a potential continuation or reversal of a trend. Here’s a concise overview:
Types of Triangle Patterns
Ascending Triangle: Characterized by a horizontal upper trendline and an ascending lower trendline. A breakout above the horizontal line is typically bullish.
Descending Triangle: Features a horizontal lower trendline and a descending upper trendline. A breakout below the horizontal line is usually bearish.
Symmetrica
Vedanta Stock :- Vedanta
Trend:- positive
Setup :- symmetrical traingle breakout and all time high breakout
Timeframe:- daily
Buy :- at current price with split capital form
Stoploss:- 486
Target :- 10 % from entry price
NOTE :- PLEASE CONSULT YOUR ADVISOR BEFORE INVESTING IN STOCKS WHICH I RECOMMENDED
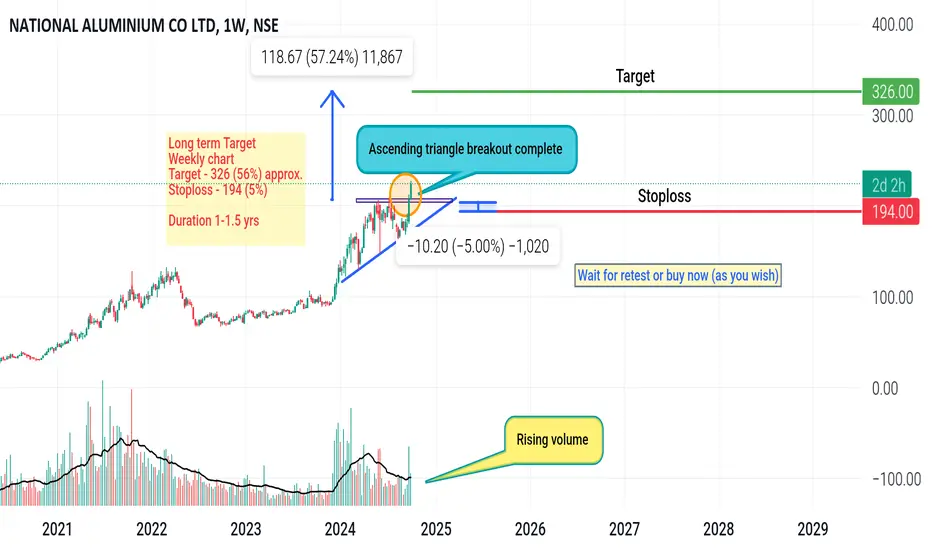
National aluminium co. Ltd ascending triangle breakout completeNSE:NATIONALUM Ascending triangle breakout complete
Do as directed
Weekly chart uptrend chart. Trading near strong support zone
Rising volume breakout
This is not trading recommendation or advise 🚨
Do your analysis before taking any step.
ARIHANTSUPARIHANTSUP - The stock has formed a triangle pattern and breakout
Hello traders,
As always, simple and neat charts so everyone can understand and not make it too complicated.
rest details mentioned in the chart.
will be posting more such ideas like this. Until that, like share and follow :)
check my other ideas to get to know about all the successful trades based on price action.
Thanks,
Ajay.
keep learning and keep earning.
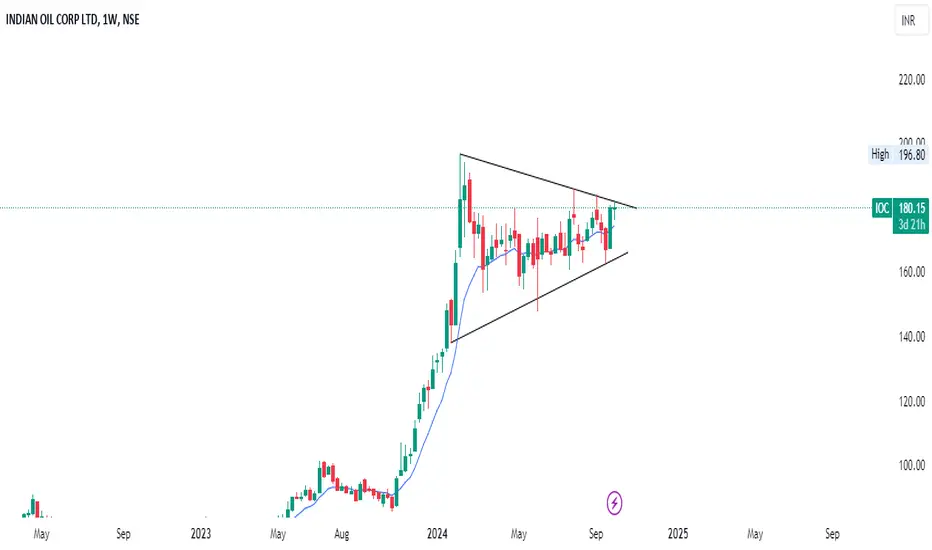
IOCIOC - Need to Break the range for move upside
Hello traders,
As always, simple and neat charts so everyone can understand and not make it too complicated.
rest details mentioned in the chart.
will be posting more such ideas like this. Until that, like share and follow :)
check my other ideas to get to know about all the successful trades based on price action.
Thanks,
Ajay.
keep learning and keep earning.