Long
Long
 Long
Long
 Long
Long
 Short
Short
 Long
Long
 Long
Long
 Long
Long
 Long
Long
 Long
Long
ADANIGREENADANIGREEN
Resistance Line (Red):
The upper red dashed line is acting as a resistance line, where the price has previously struggled to break through (as indicated by the red arrows).
Support Line (Red):
The lower red dashed line is the support level, where the price has bounced back up (as indicated by the green arrows).
Possible Breakout Scenarios
Bullish Breakout (Scenario 1): If the price breaks above the resistance line, the stock could potentially move higher towards the next resistance level around ₹3,050, as indicated by the dashed blue line with label "1".
Bearish Breakdown (Scenario 2): If the price breaks below the support line, it could drop significantly, potentially moving towards the lower level around ₹400, as indicated by the dashed blue line with label "2".
Scenario 1: Bullish Breakout
Breakout Level: Around ₹2,000 to ₹2,050.
1First Target: ₹2,400 - This is the first level of resistance, where the stock previously faced selling pressure.
Second Target: ₹3,050 - The upper resistance level, marked as "High" on the chart. This could be a medium-term target if the bullish momentum continues.
Extended Target: ₹3,600 - If the momentum is strong and supported by increasing volume, the stock could potentially reach this level, which would be a measured move based on the height of the triangle pattern.
Scenario 2: Bearish Breakdown
Breakdown Level: Below ₹1,750.
First Target: ₹1,400 - This is a key support level from the previous swing low, and it might act as a buffer before further decline.
Second Target: ₹800 - This is a more substantial support level that aligns with previous significant lows in 2022.
Extended Target: ₹400 - This is the lower extreme marked by the chart, which could be reached in a severe bearish scenario, possibly driven by a market-wide correction or negative news specific to the company.
Stop-Loss Strategy:
Bullish Trade: Place a stop-loss just below the breakout point, around ₹1,750, to protect against a false breakout.
Bearish Trade: Place a stop-loss just above the breakdown point, around ₹2,050, to safeguard against a false breakdown.
for MORE check in my Tv-id " in.tradingview.com "
If You LIKE👌👌 MY Idea ......Boost.🔥🔥🔥.. its.
"Disclosure : I am not Sebi-registered." This channel is for only educational purpose. Any profit/loss, I am not responsible.
Before taking any trade on our charts / calls, please consult your financial advisors. Thanks🙏
epro-bullswings dt02/09/24
 Long
Long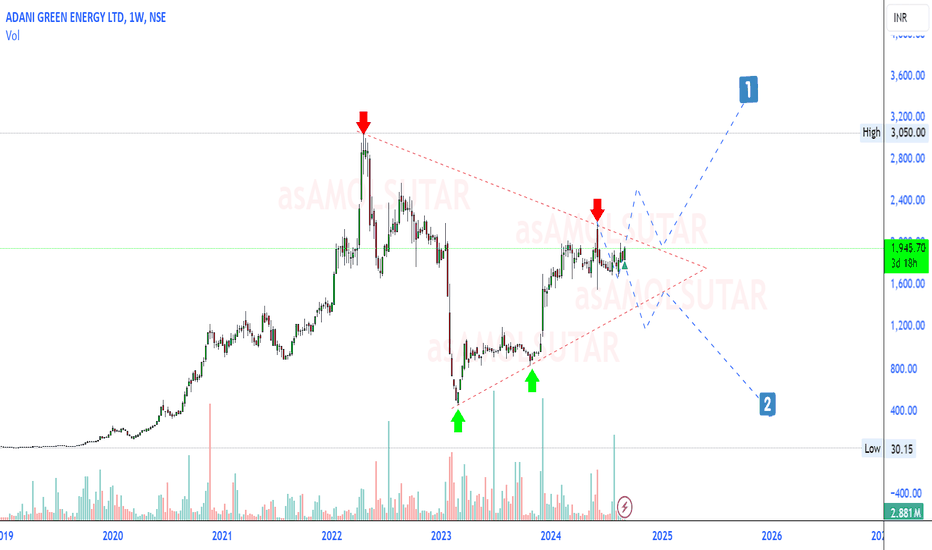
 Long
Long
 Long
Long
 Long
Long
 Long
Long
 Long
Long
 Long
Long
 Long
Long
Digital Technologies Co. Stock given Breakout with huge VolumeHello everyone, i hope you all will be doing good in your life and your trading as well, today i have brought a stock which has given a breakout of symmetrical triangle pattern with huge volume spike , generally whenver you see huge volume on the same day of breakout you can consider that as a healty breakout of that perticular company. Stock name Datamatics global services Ltd, and it is a Digital Technologies, Digital Operations, and Digital Experiences company that enables enterprises to go Deep in Digital to boost their productivity, customer experience and competitive advantage. Datamatics enables enterprises to combine various relevant Digital Technologies to improve productivity and customer experience to build sustainable competitive advantage.
Technically stock has given breakout of symmetrical triangle pattern and stock is sustaining above to breakout levels and currently it is above to 200-DEMA , which is a good sign of bullish reversal. MACD also suggesting a bullish crossover.
Note:- I have not placed MACD & 200-DEMA on chart to make chart crytal clear.
Fundamentally stock is really awesome, companies management is very good, they understand the business very well, as there is too much competitions in their business but still they are surviving like a leader in sector. It is really a good bet for long term as welll as short term . if you are planning to invest for long term, then i will suggest you to go and start SIP in this. For short term to medium term targets and stop loss, i already have mention on chart above. Please follow stricly.
Market Cap
₹ 4,088 Cr.
Current Price
₹ 693
High / Low
₹ 792 / 450
Stock P/E
21.7
Book Value
₹ 208
Dividend Yield
0.72 %
ROCE
21.2 %
ROE
16.6 %
Face Value
₹ 5.00
Industry PE
40.7
Debt
₹ 17.4 Cr.
EPS
₹ 31.6
Promoter holding
66.4 %
Intrinsic Value
₹ 382
Pledged percentage
0.00 %
EVEBITDA
14.3
Change in Prom Hold
0.00 %
Profit Var 5Yrs
20.8 %
Sales growth 5Years
6.46 %
Return over 5years
57.3 %
Debt to equity
0.01
Net profit
₹ 186 Cr.
ROE 5Yr
15.6 %
Profit growth
-4.54 %
Earnings yield
6.08 %
Disclaimer:- Please always do your own analysis or consult with your financial advisor before taking any kind of trades.
Dear traders, If you like my work then do not forget to hit like and follow me, and guy's let me know what do you think about this idea in comment box, i would be love to reply all of you guy's.
Thankyou.  Long
Long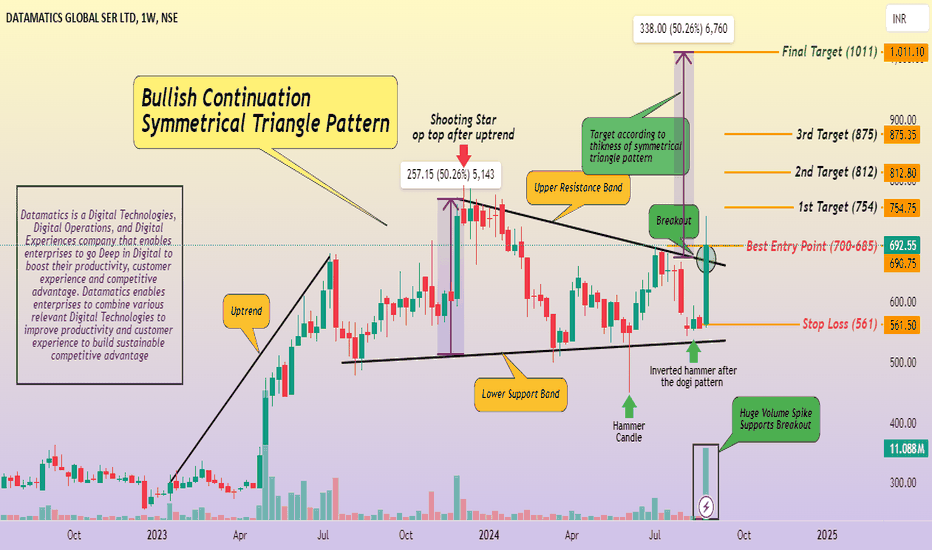
 Long
Long
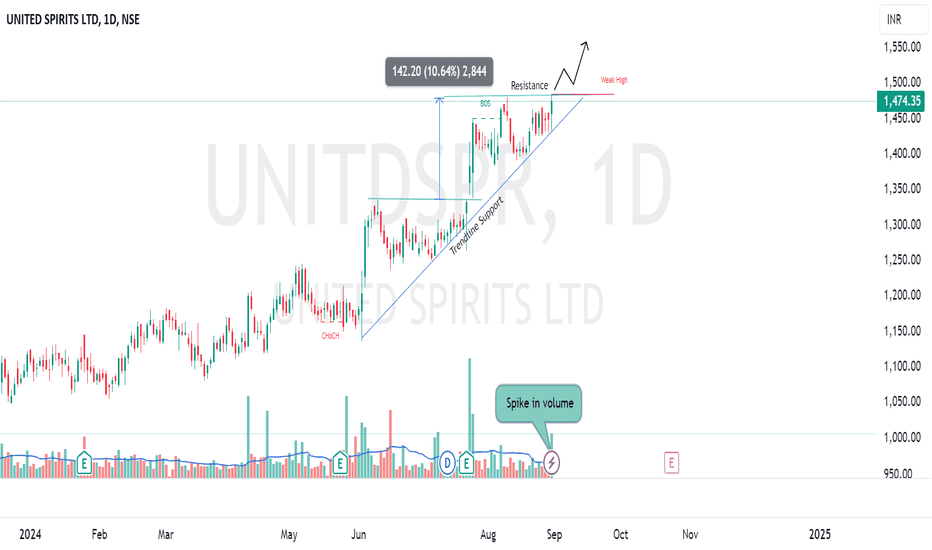
UNITED SPIRITS : Bullish Setup with Ascending Triangle FormationPrice Action Overview:
UNITED SPIRITS LTD is showing a promising bullish setup with an Ascending Triangle Pattern. This is a continuation pattern, often signaling a potential breakout in the direction of the prior trend. Here's a detailed analysis:
Ascending Triangle Formation: The stock is forming higher lows, creating an ascending triangle pattern, which typically indicates buying pressure and the likelihood of a bullish breakout.
What is an Ascending Triangle Pattern?
The Ascending Triangle is a bullish continuation pattern often seen in an uptrend. It is formed when the price makes higher lows while the highs stay at a similar level, creating a triangle shape. This pattern reflects the strength of buyers, as they continue to push the price higher at each dip, leading to a likely breakout above the resistance level.
How to Trade the Ascending Triangle:
Entry Point: Traders typically look to enter a long position once the price breaks above the horizontal resistance line, confirmed by increased volume.
Stop Loss: A stop-loss order can be placed below the most recent low or just below the ascending trendline to manage risk.
Price Target: The target is often set by measuring the height of the triangle and projecting it upwards from the breakout point. This gives a potential upside target.
In this specific setup for UNITED SPIRITS LTD:
Breakout Potential: The stock is approaching the upper boundary of the triangle, and a breakout could lead to a strong upward move.
Weak High: The current weak high near the top of the triangle suggests that buyers are still in control and pushing for higher levels.
Price Targets: Based on the height of the triangle, a potential upside target could be around ₹1,600.
NSE:UNITDSPR
This setup provides an opportunity for traders to capitalize on a potential breakout, supported by technical indicators and volume patterns.  Long
Long