ITC - Symmetrical TriangleITC - Symmetrical Triangle
Name - ITC
Pattern - Symmetrical triangle
Timeframe - Wkly
Status - Breakout with good volume
Cmp - 501.9
Target - 602
SL - 463
Fundamentals :
ITC Limited is a diversified conglomerate with strong fundamentals. Here are some key financial ratios and highlights:
Key Financial Ratios
Price-to-Earnings (PE) Ratio: 30.861
Price-to-Book (P/B) Ratio: 8.821
Debt-to-Equity Ratio: 0.0011
Return on Equity (ROE): 28.69%1
Net Profit Margin: 26.13%1
Enterprise Value to EBITDA: 18.171
Highlights
Profit Growth: ITC has shown a good profit growth of 16.15% over the past three years2.
Return on Capital Employed (ROCE): 36.42% over the past three years2.
Debt-Free: The company is virtually debt-free with a healthy interest coverage ratio of 347.532.
Strong Margins: ITC maintains high margins, with an EBITDA margin of 36.76%1.
Business Strengths
Diverse Portfolio: ITC operates in various sectors including FMCG, hotels, paperboards, packaging, agribusiness, and information technology3.
Strong Brand: The company has a robust brand-building capability and extensive distribution network.
Sustainability: ITC has a good ESG score relative to its sector4.
These fundamentals indicate ITC’s strong financial health, profitability, and growth potential. Are you considering investing in ITC, or do you need more detailed information on any specific aspect?
Pattern :
A symmetrical triangle pattern is a common chart pattern in technical analysis that indicates a period of consolidation before the price breaks out, either upward or downward. Here are the key features:
Structure
Converging Trendlines: The pattern is formed by two trendlines that converge towards each other. One trendline connects a series of lower highs, and the other connects a series of higher lows12.
Volume: Typically, volume decreases as the pattern progresses, indicating a reduction in trading activity and volatility.
Interpretation
Neutral Pattern: The symmetrical triangle is considered neutral, meaning it can signal either a continuation of the existing trend or a reversal, depending on the breakout direction.
Breakout: A breakout above the upper trendline suggests a bullish move, while a breakout below the lower trendline indicates a bearish move12.
Trading Strategy
Entry Point: Traders often enter a position when the price breaks out of the triangle with increased volume.
Price Target: The price target is typically estimated by measuring the height of the triangle at its widest point and projecting that distance from the breakout point.
Stop-Loss: A stop-loss order is usually placed just below the breakout point to manage risk1.  Long
Long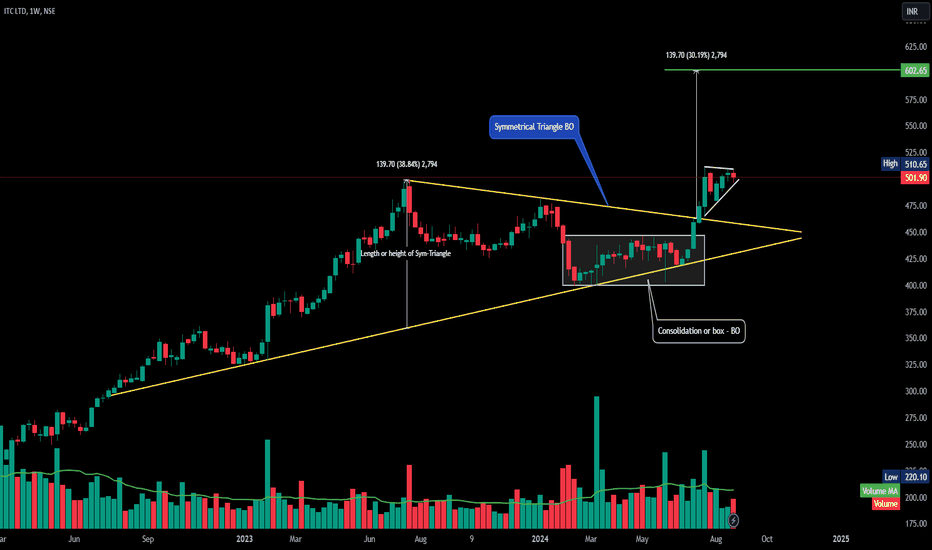
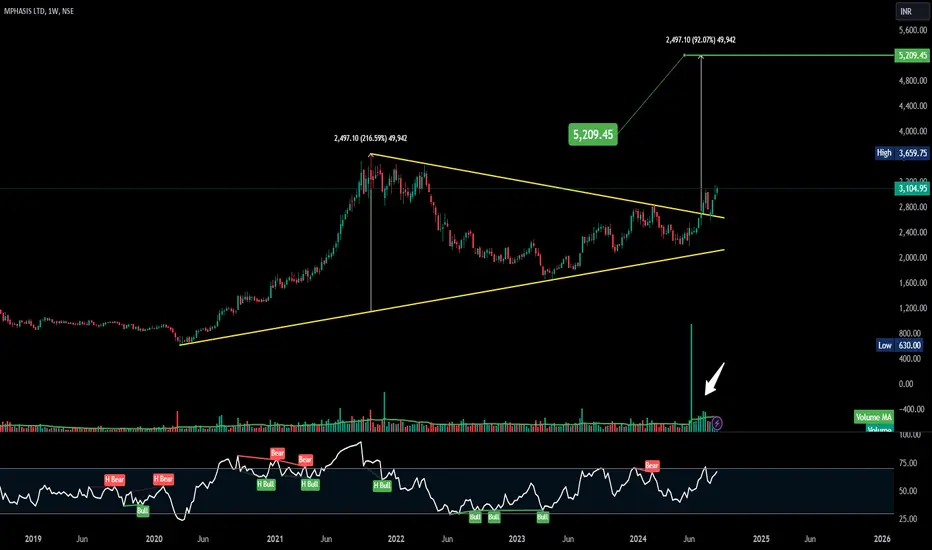
MPHASIS - Symmetrical Triangle MPHASIS
Name - MPHASIS
Pattern - Symmetrical triangle
Status - Breakout
Cmp - 3104
Target - 5209
SL - 2670
Fundamentals : Good
Here are some key financial ratios for Mphasis Limited:
Price-to-Earnings (PE) Ratio: 28.71
Price-to-Sales (P/S) Ratio: 3.862
Debt-to-Equity Ratio: 0.093
Return on Equity (ROE): 15.2%3
Net Profit Margin: 11.6%3
Enterprise Value to EBITDA: 21.022
These ratios indicate Mphasis’s valuation, profitability, and financial health. The company has a relatively high PE ratio, suggesting it is valued at a premium compared to its earnings. The low debt-to-equity ratio indicates a conservative approach to leverage.
Pattern
A symmetrical triangle pattern is a common chart pattern in technical analysis that indicates a period of consolidation before the price breaks out, either upward or downward. Here are the key features:
Structure
Converging Trendlines: The pattern is formed by two trendlines that converge towards each other. One trendline connects a series of lower highs, and the other connects a series of higher lows12.
Volume: Typically, volume decreases as the pattern progresses, indicating a reduction in trading activity and volatility1.
Interpretation
Neutral Pattern: The symmetrical triangle is considered neutral, meaning it can signal either a continuation of the existing trend or a reversal, depending on the breakout direction12.
Breakout: A breakout above the upper trendline suggests a bullish move, while a breakout below the lower trendline indicates a bearish move12.
Trading Strategy
Entry Point: Traders often enter a position when the price breaks out of the triangle with increased volume.
Price Target: The price target is typically estimated by measuring the height of the triangle at its widest point and projecting that distance from the breakout point1.
Stop-Loss: A stop-loss order is usually placed just below the breakout point to manage risk1.  Long
Long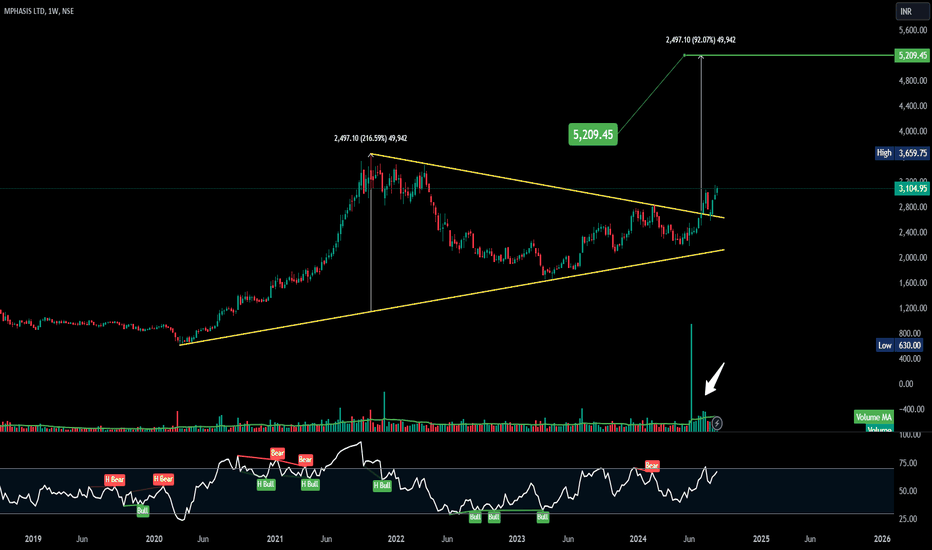
 Long
Long
 Long
Long
 Long
Long
 Long
Long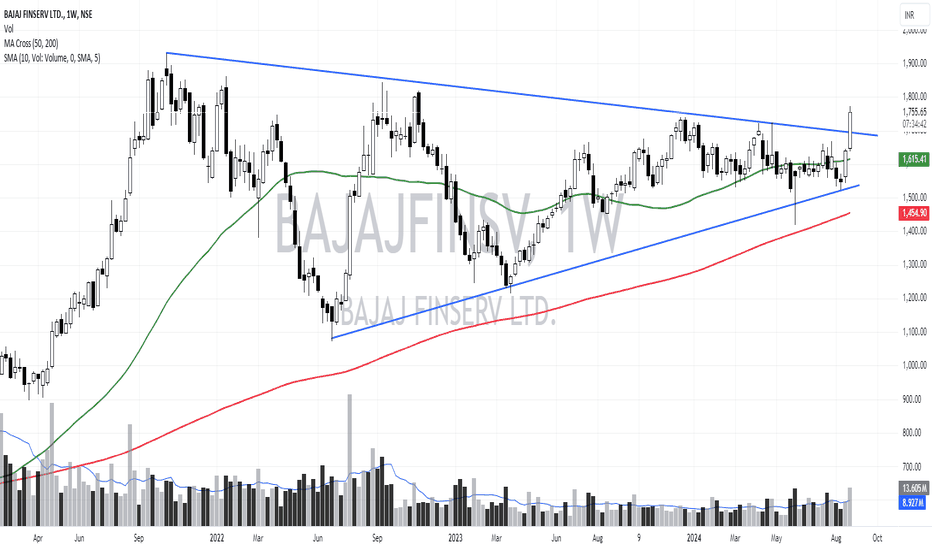
 Long
Long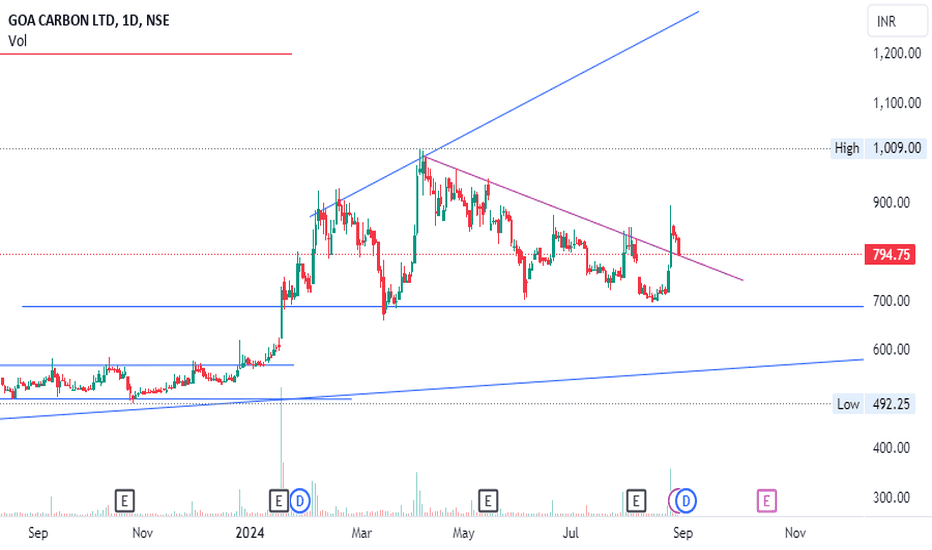
 Long
Long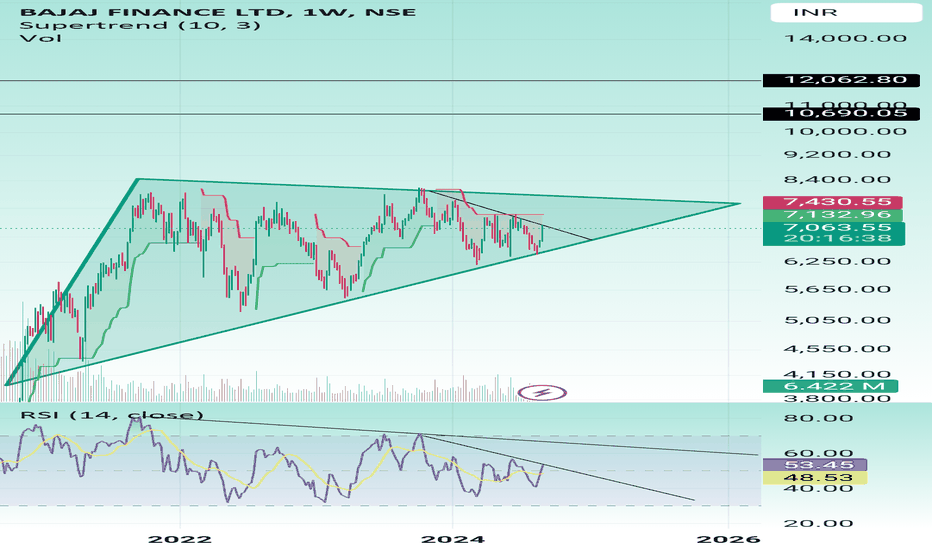
 Long
Long
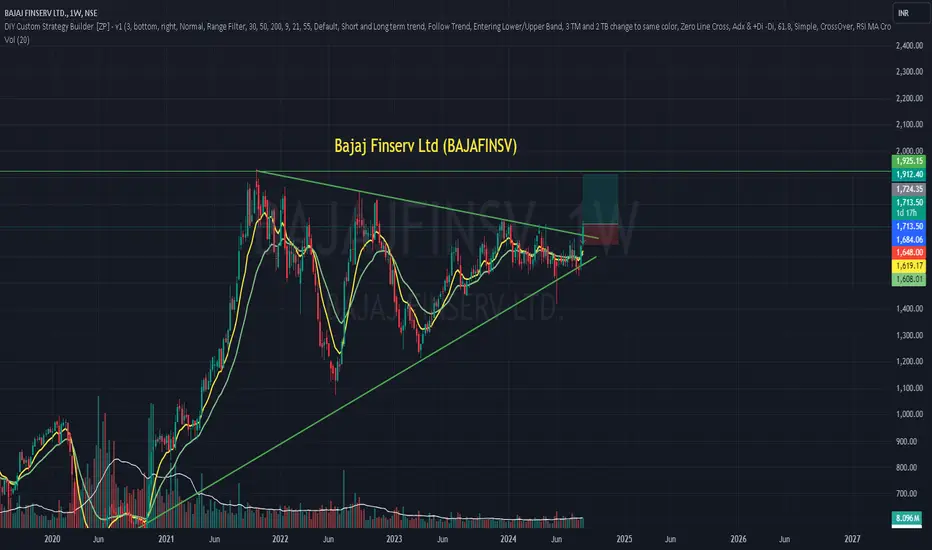
Bajaj Finserv Ltd (BAJAFINSV): Strong Bullish MomentumBAJAFINSV has shown impressive bullish momentum, breaking above multiple resistance levels. The increasing volume and positive RSI suggest a continuation of the uptrend.
Descending triangle chart with a breakout
Breakout Confirmation
A breakout from a descending triangle occurs when the price moves above the upper trendline of the triangle. This signals a potential reversal of the downward trend and a possible uptrend.
Technical Indicators:
RSI is above 50, indicating a bullish momentum.
Moving Averages: The 9-period Exponential Moving Average (EMA) is crossing above the 21-period EMA, confirming the bullish trend.
MACD: The Moving Average Convergence Divergence (MACD) histogram is above the signal line, indicating a bullish trend.
Disclaimer: This analysis is for educational purposes only and does not constitute financial advice. The author is neither a registered stockbroker nor a registered advisor and does not give investment advice. His comments are an expression of opinion only and should not be construed in any manner whatsoever as recommendations to buy or sell a stock, option, future, bond, commodity, index, or any other financial instrument at any time.
Long 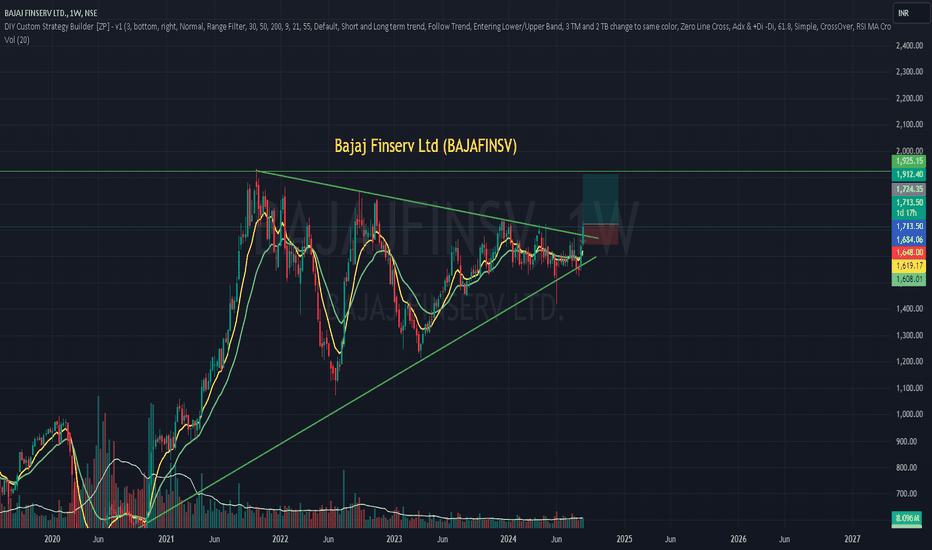
LTIMINDTREE LTDLTIMINDTREE LTD
Pattern :- symmetrical triangle pattern.
A breakout from the triangle has occurred, suggesting a potential strong bullish movement.
Target :
The chart includes two projected target levels (1st TRG and 2nd TRG), indicating potential price targets post-breakout.
1)1st Target: Around INR 7,588.80
2)2nd Target: Higher, possibly indicating a significant upward move beyond the 1st target.
Entry Point:
Since the breakout has already occurred, an entry near the current level (around INR 6,127.55) could be considered. However, waiting for a minor pullback to the breakout level (around INR 5,900 to INR 6,000) might offer a better risk-reward ratio.
A conservative Stop-loss can be placed just below the lower boundary of the triangle, around INR 5,450. This would minimize potential losses if the breakout proves to be a false move.
Market Conditions and News:
Check for any news related to LTIMINDTREE LTD, such as earnings reports, management changes, or sector-specific developments. Such news can significantly impact the price and should be factored into the trading decision.
Broader market trends, such as the performance of the IT sector and the overall market sentiment, should also be considered.
The breakout from the triangle pattern and the increasing volume are positive signs. If the broader market remains supportive and no negative news impacts LTIMINDTREE, the stock could reach its projected targets.
for MORE check in my Tv-id " in.tradingview.com "
If You LIKE👌👌 MY Idea ......Boost.🔥🔥🔥.. its.
"Disclosure : I am not Sebi-registered." This channel is for only educational purpose. Any profit/loss, I am not responsible.
Before taking any trade on our charts / calls, please consult your financial advisors. Thanks🙏
Long 
 Long
Long
Long 
 Long
Long
Long 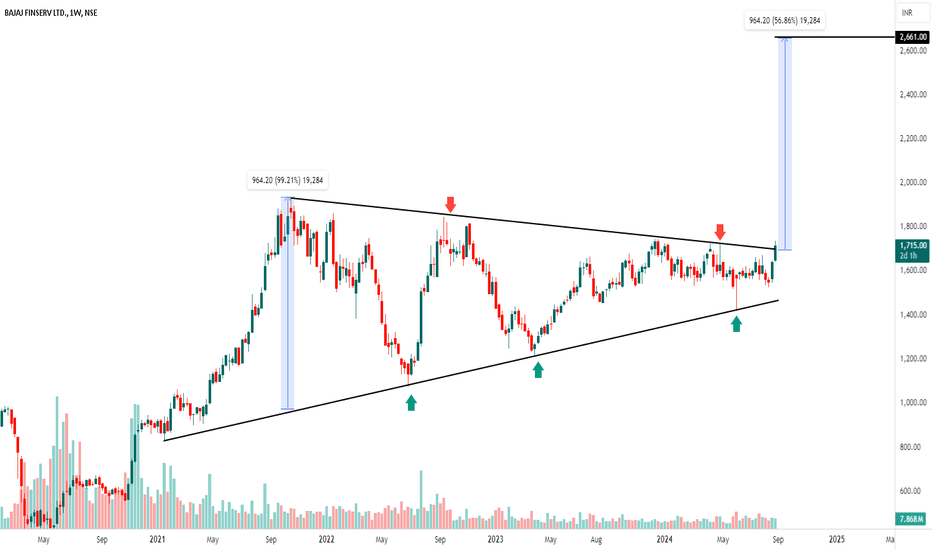
 Long
Long
 Long
Long
 Long
Long
 Long
Long