Triangle
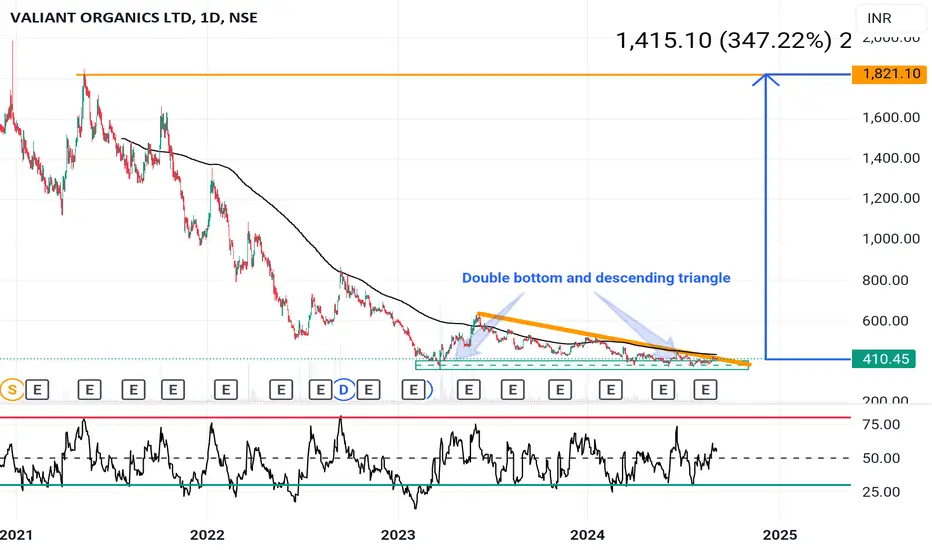
Valiant Organics - Double bottom and descending triangleCMP - 411
TARGET – 1800
⚡️Disclaimer: Any of my posts should not be considered as a Buy/Sell/Hold recommendation. This analysis is for educational and learning purpose only⚡️
Description:
A descending triangle refers to a chart pattern used in technical analysis that is characterized by a descending upper trendline and a second, flatter horizontal trendline forming a support level.
Downtrend: The market in question must be in an existing downtrend before the descending triangle pattern app
A SHORT TRADE SETUP - NIFTY50NSE:NIFTY
❇️ Good trade setup in Nifty50.
❇️In daily time frame there is continuous buying. From straight 14 days. Not a single candle closed in red.
❇️ Now as per the pmi data of us. (Ecomomy) Above estimate which is not good for the us markets. Thats why dow jones crash more then 700 points. And nasdaq slip over 600 points.
❇️ Nifty forming symmetrical triangle pattern in 15 mint chart. As per the gift nifty shows 120 points down we can expect a down fall from this pattern. Wait for 5
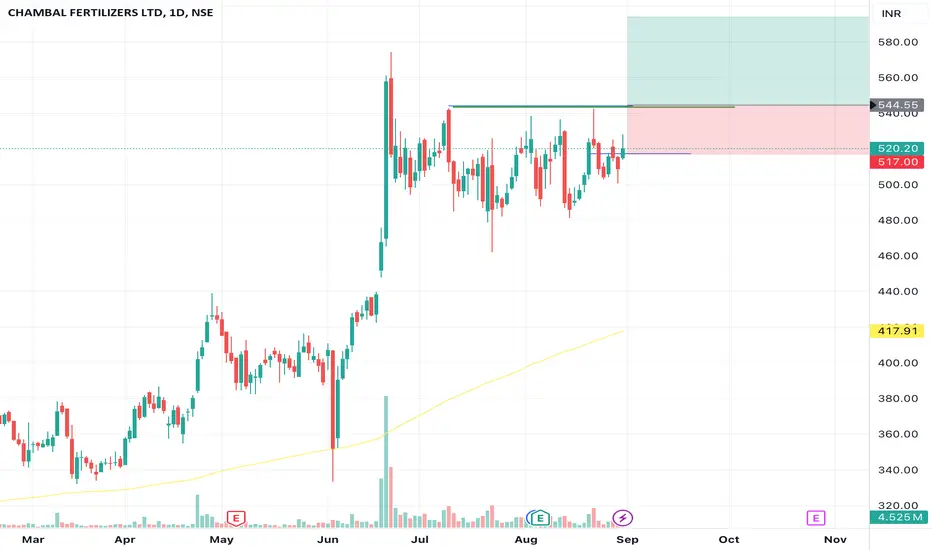
Tilaknagar IndustriesTI
Classical Ascending Triangle Pattern Breakout
Stock breaks the resistance at 290 levels and gave a close above 300 in daily timeframe today
Can be bought if it retraces to 285 - 295 levels in future for a better risk reward
Interesting Buying volumes can be seen from last two weeks
Keep in Radar
Keep an eye into the stock
It has formed a Symmetrical triangle and is on the verge of breakout.
Historical chart tells us that the stock gave a good upside momentum of approx 32% after breakout of symmetrical triangle.
If the stock gives a good daily breakout candle one can enter with stoploss below candle low. Breakdown will negate our view in the stock.
Volume analysis shows that during consolidation volume has dried up.
Keep Learning,
Keep Trading.
⚠️Disclaim
Sundaram Finance Ltd:- Ascending TriangleSundaram Finance Ltd:- Ascending Triangle
25 % Upside potential
Plan your trade accordingly.
Views are for ‘’EDUCATIONAL PURPOSE ONLY’’,trade at your own risk.
"Trade what you see, Not what You Think"
Happy Trading(:)
SLong
HDFCLIFE -Symmetrical Triangle -Breakout-wkly HDFCLIFE -Symmetrical Triangle -Breakout-wkly
Name - HDFCLIFE
Pattern - symmetrical triangle
Timeframe - Wkly
Status - Breakout
Volume - Good
Cmp - 745
Target - 1032
SL - 664
Pattern:
A symmetrical triangle pattern is a common chart pattern in technical analysis that indicates a period of consolidation before the price breaks out.
Fundamental ratios:
Here are some key fundamental ratios for HDFC Life Insurance Company Ltd. (HDFCLIFE):
Profitability Ratios:
Retu
ADANIGREENADANIGREEN
Resistance Line (Red):
The upper red dashed line is acting as a resistance line, where the price has previously struggled to break through (as indicated by the red arrows).
Support Line (Red):
The lower red dashed line is the support level, where the price has bounced back up (as indicated by the green arrows).
Possible Breakout Scenarios
Bullish Breakout (Scenario 1): If the price breaks above the resistance line, the stock could potentially move higher towards the next resista
STARHEALTH - Symmetric Triangle Breakout🔊 STARHEALTH - Symmetric Triangle Breakout
STARHEALTH - STAR HEALTH & AL INS CO LTD
⌛Duration - Short Term (4 month to 8 month)
📊📈 Trade Logic -Symmetric Triangle Breakout
CMP - ₹628.65
Time Frame - Weekly
🎯Target 1 : ₹760
🎯Target 2 : ₹830
🎯Target 3 : ₹900
🛑 Stop : ₹560
🏆 Risk/Reward Ratio (1: 4.25)
Disclaimer: The stock information shared above is not a recommendation to buy, sell, or hold. It reflects my own analysis and is intended solely for educational purposes. Any actions you take bas
INDUSTOWER - Descending Triangle BO - MonthlyINDUSTOWER - Descending Triangle BO
A descending triangle is a chart pattern used in technical analysis, often seen as a bearish signal.
Name - INDUSTOWER
Pattern - Descending triangle
Timeframe - Monthly
Status - Breakout with volume
Cmp - 458
Target - T1- 482 and T2 -596
SL - 243 and TSL at 400
Fundamentals:
Here are some key fundamental ratios and metrics for Indus Towers Ltd.:
Market Cap: ₹1,179.84 Billion
Current Price: ₹185.00
Price-to-Earnings (P/E) Ratio: 17.84
Pric
BAJAJFINSV -Symmetrical Triangle BreakoutBAJAJFINSV—Symmetrical Triangle Breakout
Name - BAJAJFINSV
Pattern - symmetrical triangle
Timeframe - Wkly
Status - Breakout with volume
Cmp - 1783
Target - 2642
SL - 1634
Pattern :Symmetrical triangle
Indicates a period of consolidation before the price breaks out, either upward or downward.
Fundamentals: Good
Here are some key fundamental ratios for Bajaj Finserv Ltd.:
Market Cap: ₹2.62 Trillion1
Current Price: ₹1,782.002
Price-to-Earnings (P/E) Ratio: 34.13
Price-to-Sales
Digital Technologies Co. Stock given Breakout with huge VolumeHello everyone, i hope you all will be doing good in your life and your trading as well, today i have brought a stock which has given a breakout of symmetrical triangle pattern with huge volume spike , generally whenver you see huge volume on the same day of breakout you can consider that as a healty breakout of that perticular company. Stock name Datamatics global services Ltd, and it is a Digital Technologies, Digital Operations, and Digital Experiences company that enables enterprises to
UNITED SPIRITS : Bullish Setup with Ascending Triangle FormationPrice Action Overview:
UNITED SPIRITS LTD is showing a promising bullish setup with an Ascending Triangle Pattern. This is a continuation pattern, often signaling a potential breakout in the direction of the prior trend. Here's a detailed analysis:
Ascending Triangle Formation: The stock is forming higher lows, creating an ascending triangle pattern, which typically indicates buying pressure and the likelihood of a bullish breakout.
What is an Ascending Triangle Pattern?
The Ascending T
BAJAJFINSV - Symmetrical Triangle Breakout🔊 BAJAJFINSV- Symmetrical Triangle Breakout
BAJAJFINSV- BAJAJ FINSERV LTD.
⌛Duration - Short Term (4 month to 8 month)
📊📈 Trade Logic - Symmetrical Triangle Breakout
CMP - 1783
Time Frame - Weekly
🎯Target 1 : 1950
🎯Target 2 : 2200
🎯Target 3 : 2475
🎯Target 4 : 2750
🛑 Stop : 1500
🏆 Risk/Reward Ratio (1: 3.3)
Disclaimer: The stock information shared above is not a recommendation to buy, sell, or hold. It reflects my own analysis and is intended solely for educational purposes. Any actions
ITC - Symmetrical TriangleITC - Symmetrical Triangle
Name - ITC
Pattern - Symmetrical triangle
Timeframe - Wkly
Status - Breakout with good volume
Cmp - 501.9
Target - 602
SL - 463
Fundamentals :
ITC Limited is a diversified conglomerate with strong fundamentals. Here are some key financial ratios and highlights:
Key Financial Ratios
Price-to-Earnings (PE) Ratio: 30.861
Price-to-Book (P/B) Ratio: 8.821
Debt-to-Equity Ratio: 0.0011
Return on Equity (ROE): 28.69%1
Net Profit Margin: 26.13%1
Enterprise Val
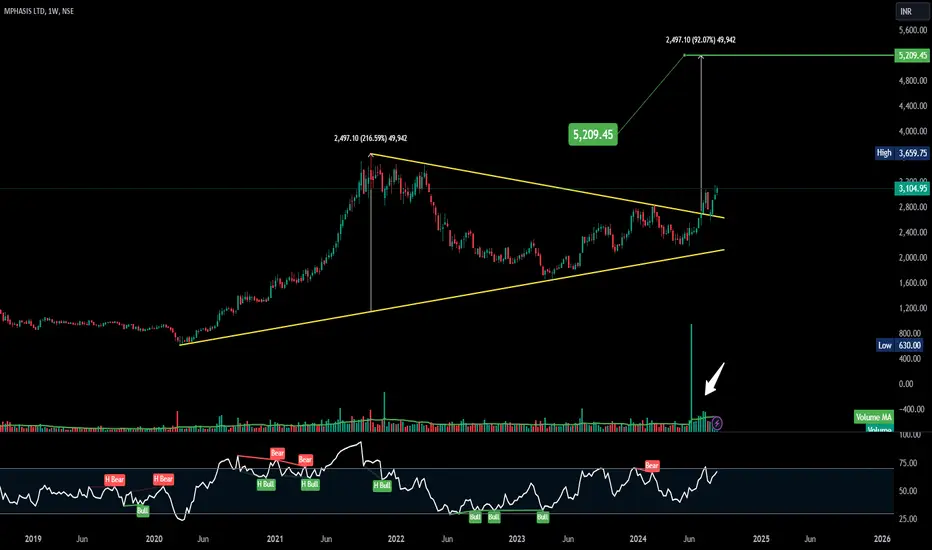
MPHASIS - Symmetrical Triangle MPHASIS
Name - MPHASIS
Pattern - Symmetrical triangle
Status - Breakout
Cmp - 3104
Target - 5209
SL - 2670
Fundamentals : Good
Here are some key financial ratios for Mphasis Limited:
Price-to-Earnings (PE) Ratio: 28.71
Price-to-Sales (P/S) Ratio: 3.862
Debt-to-Equity Ratio: 0.093
Return on Equity (ROE): 15.2%3
Net Profit Margin: 11.6%3
Enterprise Value to EBITDA: 21.022
These ratios indicate Mphasis’s valuation, profitability, and financial health. The company has a rela
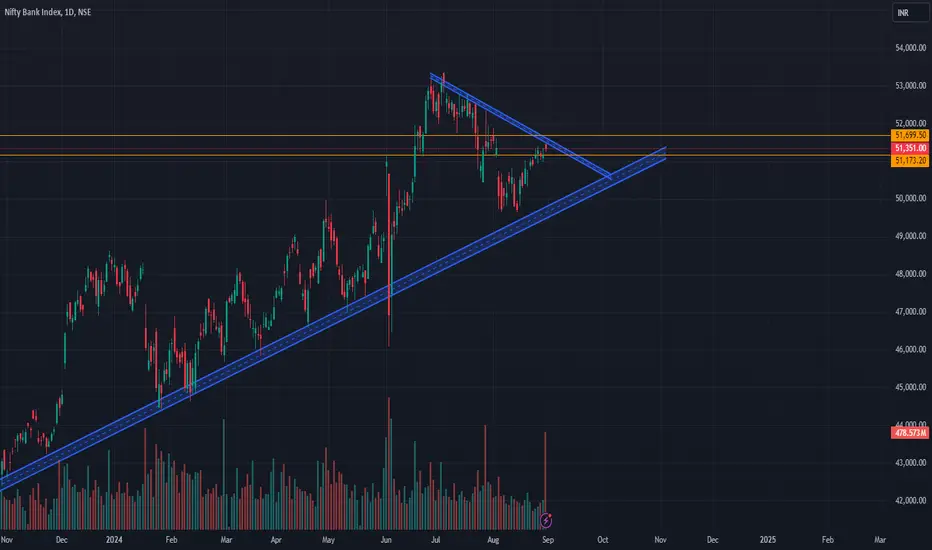
Nifty Bank Index Technical Outlook: Awaiting a BreakoutThe Nifty Bank Index is at a critical juncture, forming a symmetrical triangle pattern on its daily chart. This pattern, characterized by converging lower highs and higher lows, indicates a period of consolidation, with a potential breakout on the horizon.
Key Levels to Watch:
Support:
Ascending trendline from November 2022
Horizontal support around 51,173
Resistance:
Triangle’s upper trendline
Horizontal resistance near 51,699
Potential Scenarios:
Bullish Breakout: A move
EMAMI LTDAnnual Revenue rose 4.32%, in the last year to ₹3,624.89 Cr. Its sector's average revenue growth for the last fiscal year was 3.7%.
Quarterly Revenue rose 6.61% YoY to ₹901.94 Cr. Its sector's average revenue growth YoY for the quarter was 3.85%.
Annual Net Profit rose 13.13% in the last year to ₹723.53 Cr. Its sector's average net profit growth for the last fiscal year was 13.57%.
Quarterly Net profit rose 3.09% YoY to ₹148.9 Cr. Its sector's average net profit growth YoY for the quarter was