Triangle
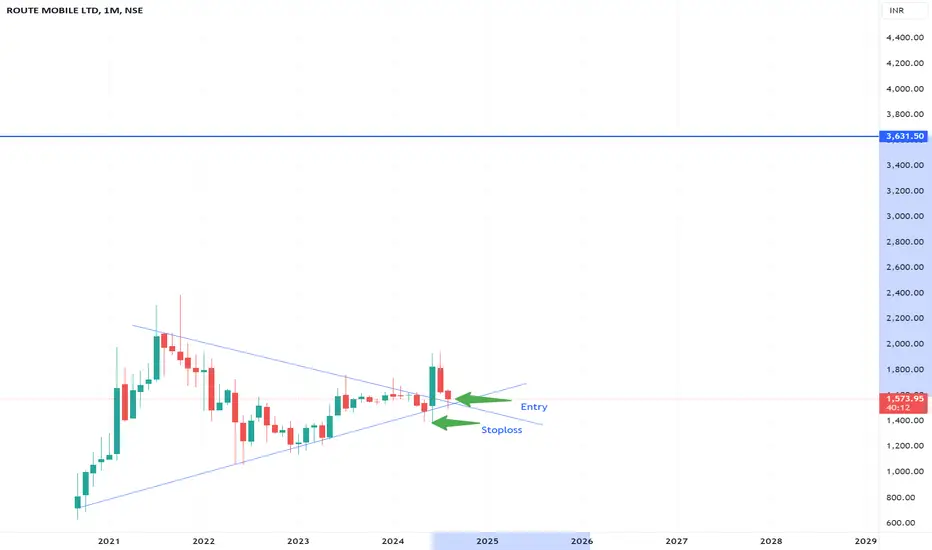
OCCL - Breakout and Retracement Stock price consolidates since 2016 and formed Symmetrical Triangle formation. Price breakout on July 2024 and rises (60%) which fall back near to breakout price range.
Now, price might come to 225 range or bounce back to All time High.
OLong
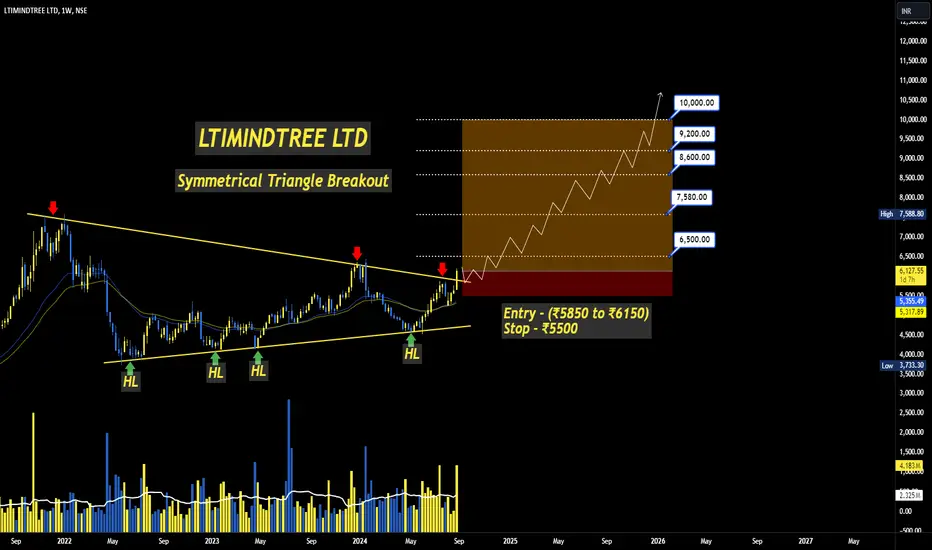
LTIM - SYMMETRICAL TRIANGLE BREAKOUT🔊 LTIM - LTIMINDTREE LTD.
⌛Duration - Long Term (8 month to 15 month)
📊📈 Trade Logic - Symmetrical triangle breakout
CMP - 6127
Time Frame - Weekly
🎯Target 1 : 6500
🎯Target 2 : 7580
🎯Target 3 : 8600
🎯Target 4 : 9200
🎯Target 5 : 10000
🛑 Stop : 5500
🏆 Risk/Reward Ratio (1:6)
Disclaimer: The stock information shared above is not a recommendation to buy, sell, or hold. It reflects my own analysis and is intended solely for educational purposes. Any actions you take based on this information
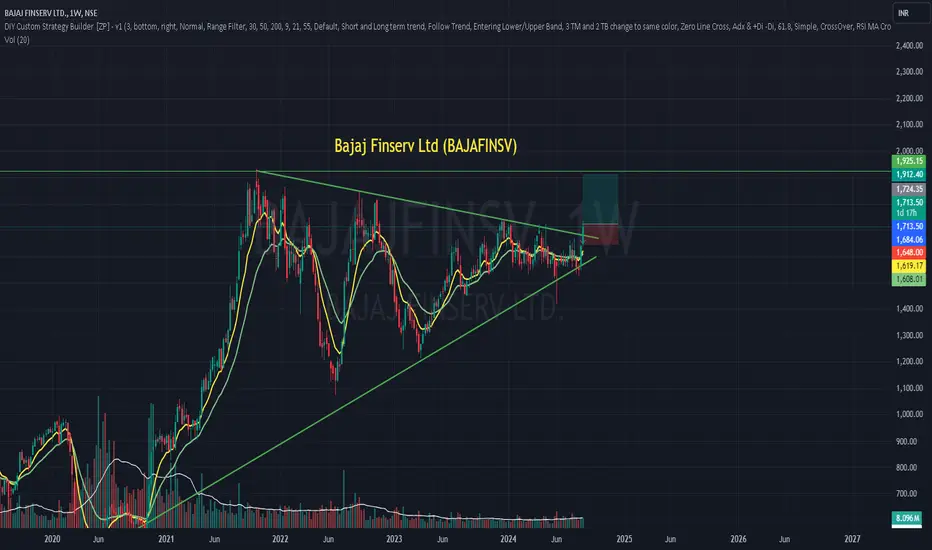
Bajaj Finserv Ltd (BAJAFINSV): Strong Bullish MomentumBAJAFINSV has shown impressive bullish momentum, breaking above multiple resistance levels. The increasing volume and positive RSI suggest a continuation of the uptrend.
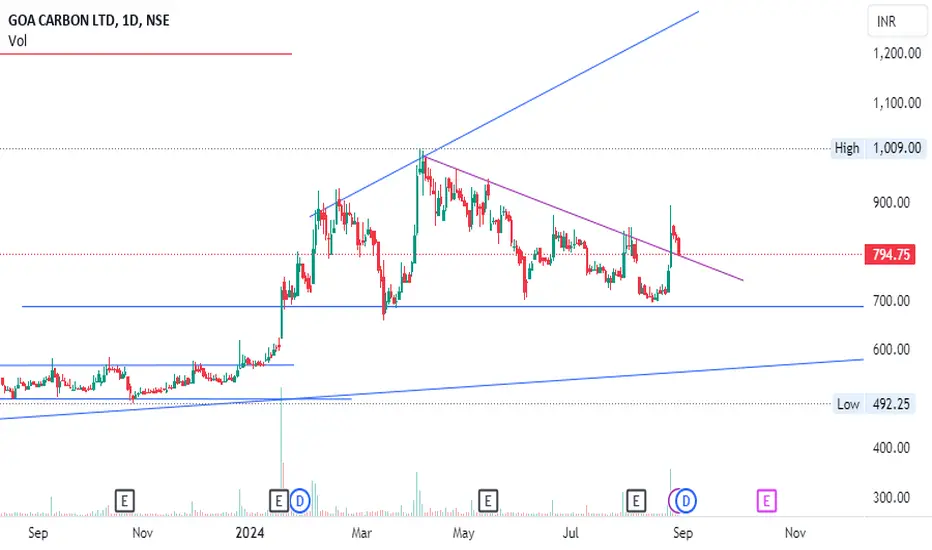
Descending triangle chart with a breakout
Breakout Confirmation
A breakout from a descending triangle occurs when the price moves above the upper trendline of the triangle. This signals a potential reversal of the downward trend and a possible uptrend.
Technical Indicators:
RSI is above 50, indicating a bullish momentum.
LTIMINDTREE LTDLTIMINDTREE LTD
Pattern :- symmetrical triangle pattern.
A breakout from the triangle has occurred, suggesting a potential strong bullish movement.
Target :
The chart includes two projected target levels (1st TRG and 2nd TRG), indicating potential price targets post-breakout.
1)1st Target: Around INR 7,588.80
2)2nd Target: Higher, possibly indicating a significant upward move beyond the 1st target.
Entry Point:
Since the breakout has already occurred, an entry near the current level
Bajajfinserv rally pending..Good triangle pattern formed in bajajfinserve in 1D 1W 1M timeframes. About 1000days consolidation pattern. Breakout above 1600 price will lead to hurracane rally in this stock. Keep an eye. According to Fibo trend based extension Next big levels will get open in this stock till 3000. Then further extension will drag it till 4000 levels. But it may take some time too. This is long term view.
Keep this in mind. Options is a dangerous instrument to play. Please do not go wild on anything unless
EMS Limited : Breakout Candidate#EMSLIMITED #breakoutstock #breakouttrading #vcppattern #asymmetricaltriangle #chartpatterns #TWS
EMS Ltd : Breakout Candidate
>> Ascending Triangle Pattern
>> VCP Pattern Visible
>> Good Strength & Volume may Expand in coming Days
>> Moving Avg Tending Setup
>> Low Risk High Reward Trade
As per the Setup it shud give a minimum upside of 15-17%.
Swing Traders can lock 10% profit & keep trailing
Please give a Boost or comment if u r Liking the analysis & Learning from it. Keep showing ur Lov
DEEDEV DAY CHART BASE FORMATIONNSE:DEEDEV
Company profile
🔹Dee Development Engineers Ltd. provides prefabricated piping solutions. It operates through piping, power and heavy fabrication segments. The Piping segment engages in the manufacturing of pre-fabricated engineering products, pipe fittings, and piping systems. The Power segment offers biomass-based power generation. The Heavy fabrication segment involves in the manufacturing of wind mill towers.
🔹Listed in July last year then it marked a high in a few days and
Zee Entertainment: Symmetrical Triangle Formation Signals PotentZee Entertainment is currently consolidating within a symmetrical triangle, a classic chart pattern that often precedes a significant move. A breakout or breakdown in either direction is possible, suggesting the need for careful positioning. Traders are advised to remain cautious and await a decisive break above the marked level before entering any positions.
Tight risk management is key, with a predefined stop loss being essential for mitigating potential downside.
A strategic entry at the rig
D-Link - Textbook Symmetrical Triangle pattern NSE:DLINKINDIA
D-Link has formed a textbook Symmetrical pattern that has worked out so far
Although it is a bullish pattern one should wait for breakout confirmation to enter.
Those who want to minimize the risk should wait for retest and may enter after confirmation.
The breakout must also be validated by the volumes or else it'd be just another Fakeout.
According to Fibonacci Extensions after breakout 168.70 is immediate resistance might consolidate there for a while
On the downside 144
Symmetrical Triangle Pattern Breakout seen In Bajaj Finserv Ltd.Hello everyone, i hope you all will be doing good in your Trading and Life as well. I have brought a stock which has given a breakout of Symmetrical Triangle Pattern. Stock name is Bajaj Finserv Ltd, and it is the holding company for the various financial services businesses under the Bajaj group. It serves millions of customers by providing solutions for asset acquisition through financing, asset protection through general insurance, family and income protection in the form of life and health i
Greenpanel Industries LtdGreenpanel Industries Ltd, (small cap)
Since 2022 April price is consolidating in triangle format,
it must breakout 450 with high volume...( 5th E W remaining to shoot up)
golden cross happened in day chart means where
the 50-day MA crosses above the 200-day MA,
is considered a bullish breakout pattern that indicates a potential upward trend in the market.
QUESS Triangle Breakout 1WQuess Corp is trying to breakout from Symmetrical Triangle pattern on 1W timeframe. Volumes are currently high. Enter after bullish closing confirmation. Please follow your stop loss and target rules. It has also shown more than 100% yoy EPS growth for past 2 quarters and is currently trading at P/E of 35.