SensexPrice is consolidating in the form of descending triangle and now it is taking support.
Buy above 81860 with the stop loss of 81780 for the targets 81940, 82020, 82120, 82200 and 82320.
Sell below 81680 with the stop loss of 81760 for the targets 81600, 81520, 81400 and 81320.
Check the live market updates.
Hit the like button to Rock !! Show some energy !!
Note : This is my pre market analysis and my trading journal. Not a suggestion to buy or sell.
You are responsible for whatever you do.
Triangle
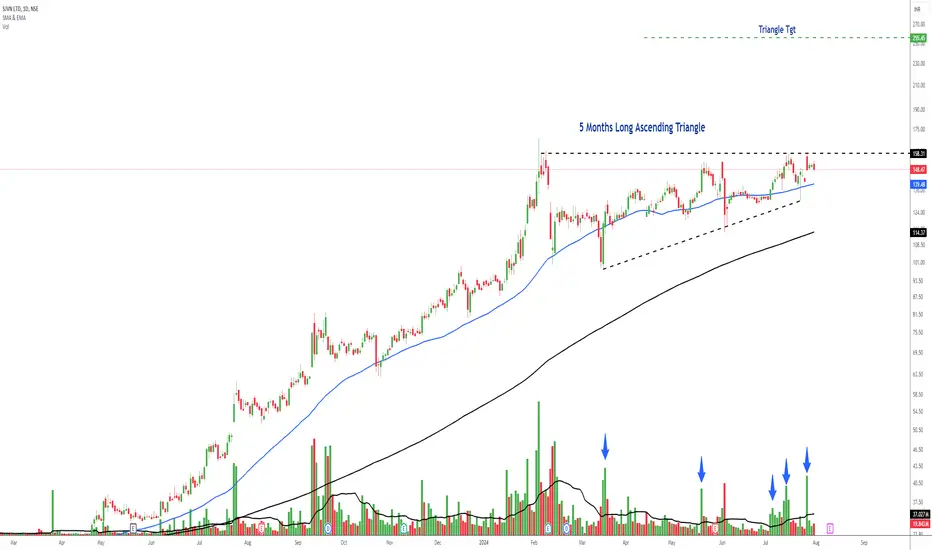
Mighty Nifty - Aug 125000 is acting as strong resistance so far. And price is consolidating in the form of ascending triangle.
Pattern : Support/Resistance.
Range : Medium.
Trend strength : Normal.
Buy Above : 25020.
Stop Loss : 24980.
Targets : 25060, 25100, 25140 and 25160.
Sell below : 24920.
Stop Loss : 24960.
Targets : 24880, 24840, 24800 and 24760.
Check the live market updates.
Hit the like button to Rock !! Show some energy !!
Note : This is my pre market analysis and my trading journal. Not a suggestio
JBCHEPHARM - KEEP EYE ON IT (LONG SETUP) | ASCENDING TRIANGLEThis is how I see the future of JBCHEPHARM. Keep an eye on it for possible entry opportunities.
Disclaimer: I am not SEBI certified and these are my personal views. Please do your research before making any investment decisions.
JLong
Spic on Potential Symmetrical triangle Breakout..!
SPIC has been consolidating in a channel pattern for last 2years in weekly chart. In daily chart formed a symmetrical triangular pattern and trying for a breakout following in a uptrend.
Potentially can reach upto the top of the channel 107rs. Maintain strict Stoploss 82rs which is below the triangle Pattern.
CAPLIPOINT LONG 1530-1545, CUP AND HANDLEBullish Indicators:
Ascending triangle pattern.
Trading above key moving averages (20-day, 50-day, and 200-day).
Potential cup and handle formation.
RSI is bullish but not overbought.
Volume spikes on upward movements.
target 1: 1596
target 2: 1800+
Note: I am not SEBI registered or TA expert. just learning the TA and sharing my views and you should consider doing research on your own before making any investment decisions.
Finished Trades (1/1)
JUBLINGREA - Target hit in 4 sessions (check o
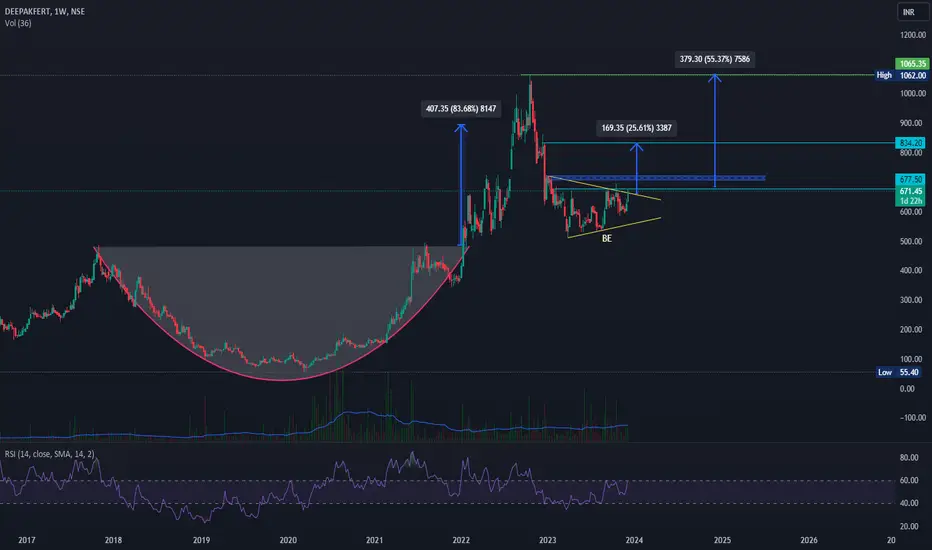
Deepak fertilizers & petrochemical Corp LtdIt is involve in chemicals, mining chemicals & fertilizers business.
Market Cap: 8474 crores
P/E 12.6 vs Industry P/E 33.2
ROCE is 25%
Previously ,it demonstrated a perfect example of Cup pattern breakout that achieved its target.
Currently it is on verge of giving breakout in a symmetrical triangle. weekly closing above 680 and RSI weekly closing above 60 should be consider as confirmation of breakout .If it does closes then it should head for 720 and 834. It has the potential to cross it AT
BREAKOUT IN DSSL 📌SWING TRADE FOR NEXT WEEK🚀
Hello Traders⚡
I am a Swing Trader by Passion i only trade on Momentum Stock's.
📌I Post Daily SWING CHARTS Analysis on My Trading view profile..
So let's Start
📌TRADE ANALYSIS OF -DSSL-
• Potential Breakout Chart
• VCP Pattern
• Short Range Consolidation
• Price Can Take Retest from support Line
BREAKOUT IN LOVABLE📌SWING TRADE FOR NEXT WEEK🚀
Hello Traders⚡
I am a Swing Trader by Passion i only trade on Momentum Stock's.
📌I Post Daily SWING CHARTS Analysis on My Trading view profile..
So let's Start
📌TRADE ANALYSIS OF -LOVABLE-
• Potential Breakout Chart
• VCP Pattern
• Short Range Consolidation
• Price Can Take Retest from support Line
$NSE:GLOBE: Still NOT TOO late to BUYSummary:
NSE:GLOBE Globe Textiles exhibits strong fundamentals with a high Piotroski score of 8 and is trading at a reasonable PE ratio of 15. The stock has shown a strong technical breakout with significant volume, indicating potential for further upside.
Fundamentals:
Very strong fundamentals
High Piotroski score of 8
Currently trading at a PE ratio of 15
High-performing player in the textiles industry
Technical:
Strong volume peak after consolidation, indicating pot
Long PIIND FOR TARGET OF 4200PIIND is trading in symmetrical triangle pattern on daily charts.
Currently inside the triangular channel. Once breakout is confirmed.
We can see piind moving to new highs in future. Another positive found is moving average crossovers occurring on weekly charts.
Wait for breakout confirmation to enter.
All targets are marked on chart.
Follow stop loss as the triangle breakout point on either side. Strictly on closing basis
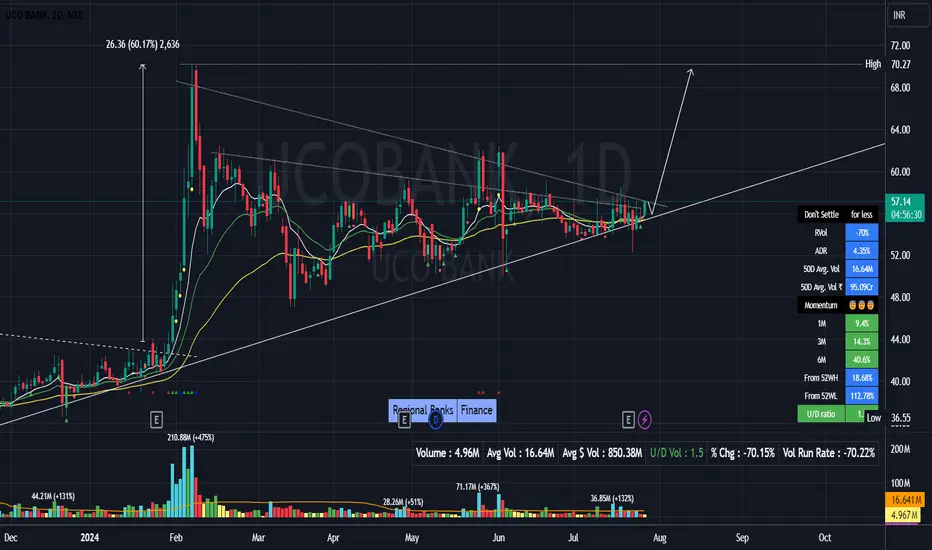
BREAKOUT IN UCO BANK📌SWING TRADE FOR NEXT WEEK🚀
Hello Traders⚡
I am a Swing Trader by Passion i only trade on Momentum Stock's.
📌I Post Daily SWING CHARTS Analysis on My Trading view profile..
So let's Start
📌TRADE ANALYSIS OF -UCO BANK-
• Potential Breakout Chart
• VCP Pattern
• Short Range Consolidation
• Price Can Take Retest from support Line
Laxmi Organic - Bullish Divergence and Breakout from TriangleWeekly Chart Insights:
Symmetrical Triangle Pattern: Over the past years, Laxmi Organic Industries Ltd has formed a symmetrical triangle.
Breakout Confirmation: Recently, the price broke above the upper trendline of the triangle.
Retest of Breakout: The price action is retested the breakout at the Trendline and has moved upwards now.
Bullish Divergence:
Time Period - 26 March to 12th May
Lower Low in Price - Price went from 235.2 to 228.5
Higher Low in RSI - RSI went from 37.2 t