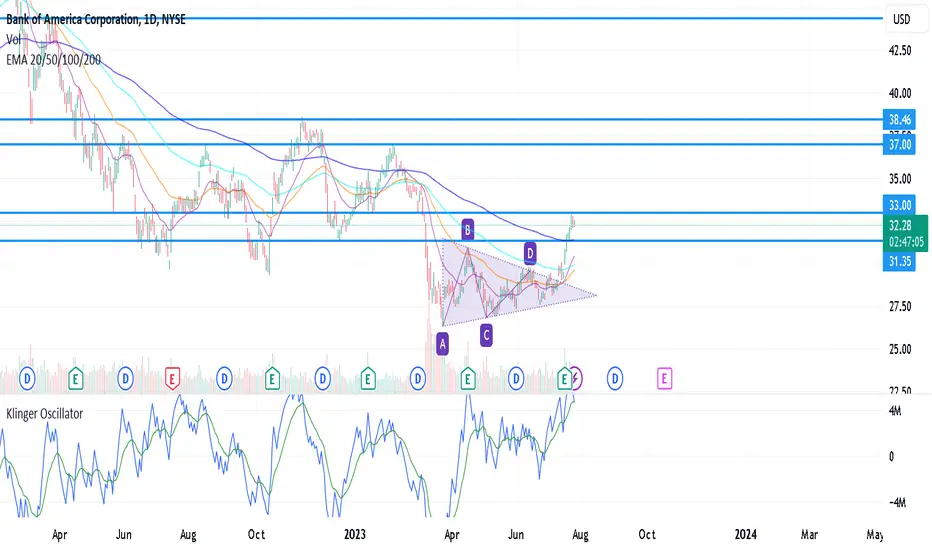
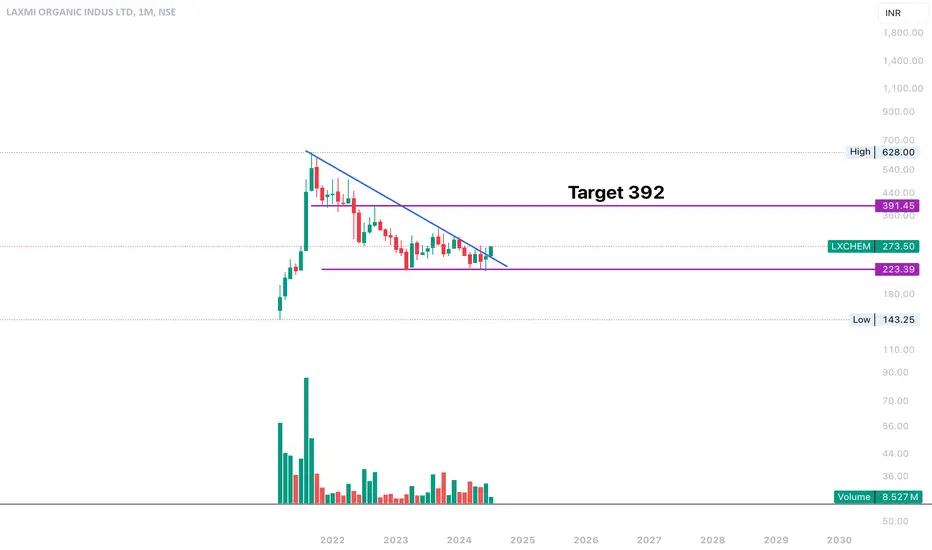
Gujarat Containers - Week - Breakout from Symmetrical Triangle?Analyzed the weekly chart of Gujarat Containers Ltd. (BSE: 523108), which is showing a promising breakout from a symmetrical triangle pattern.
As you can see, the price has broken out of the Trendline recently and has performed a retest as well.
Bullish Divergence on Daily:
Recently a Divergence was also observed on the Daily Chart where the Price made a Lower Low while the RSI made a Higher Low.
The RSI has been on an upward trajectory since.
This setup looks quite promising for a c
Triangle
Ascending triangle breakoutGood volume build up in daily and weekly time frame.
Ascending triangle pattern breakout with good volume.
Railway sector is bullish.
Fundamental are good.
Net profit increased.
Public stake increased. While FII and DII stake decreased.
NOTE: I do my analysis, do yours before trade.
BREAKOUT IN PTC INDIA 📌SWING TRADE FOR NEXT WEEK🚀
Hello Traders⚡
I am a Swing Trader by Passion i only trade on Momentum Stock's.
📌I Post Daily SWING CHARTS Analysis on My Trading view profile..
So let's Start
📌TRADE ANALYSIS OF -PTC INDIA-
• Potential Breakout Chart
• VCP Pattern
• Short Range Consolidation
• Price Can Take Retest from support Line
SJVN - Swing Trade Analysis - 12th July #stocksSJVN (1W TF) - Swing Trade Analysis given on 12th July, 2024
Pattern: ASCENDING TRIANGLE BREAKOUT
- Weekly Resistance Breakout - Done ✓
- Volume Buildup at Resistance - Done ✓
- Demand Zone Retest & Consolidation (for a Small SL and a better RR) - In Progress
Please Note:
- Since the market is at a precarious spot at its levels, we need to be careful & mindful with our entries and position sizing
- Always work in probabilities and always keep your SL in play constantly
* Disclaimer
HCCC : Swing Trade#Swingtrade #HCC #breakout #VCP
HCC : Swing Trade
>> Breakout & Retest Done
>> VCP Visible
>> Trending Setup
>> Good Strength & Volumes
>> Good Risk & Reward Trade
Swing Traders can lock 10% profit & keep trailing
Please give a Boost or comment if u r Liking the analysis & Learning from it. Keep showing ur Love by following
Disclaimer : This is not a Trade Recommendations & Charts/ stocks Mentioned are for Learning/Educational Purpose. Do your Own Analysis before Taking positions.
PAISALO - DESCENDING TRIANGLE BREAKOUTHi All,
This idea is about Paisalo Digital Ltd
Fundamentals
Market Cap - 6976 Cr
Stock PE - 39
ROE - 14.3%
ROCE - 14.1%
Promoter Stake - 47.6
Promoter holding Change 3 Yr - 3.79%
Quick Ratio - 1.18
D/E - 2
Both Sales and EPS increased in FY24.
Technicals
Descending Triangle Breakout. Targets are marked as T1 & T2
Happy Trading,
Thanks,
Stock-n-Shine
NHPC - Medium Term Analysis### Volume Contraction Pattern
1. **Ascending Triangle**: The price action forms an ascending triangle, which is typically a bullish continuation pattern. The price is making higher lows while the resistance level remains relatively flat.
2. **Volume**: There's a noticeable decrease in volume during the formation of the triangle, which is common as traders await a breakout.
### RSI Breakout
1. **RSI Indicator**: The Relative Strength Index (RSI) is breaking above the downtrend line, which is a
Mighty Nifty - July 11Price gave good movement today and now it is forming a triangle. It may consolidate within the triangle or give break out.
Pattern : Consolidation.
Range : Medium.
Trend strength : Normal.
Buy Above : 24340.
Stop Loss : 24300.
Targets : 24380, 24420, 24460 and 24490.
Sell below : 24250.
Stop Loss : 24290.
Targets : 24210, 24180, 24140 and 24100.
Check the live market updates.
Hit the like button to Rock !! Show some energy !!
Note : This is my pre market analysis and my trading journal. Not
IREDA Analysis!NSE:IREDA Analysis on a Daily Timeframe!
Triangle Pattern Formation in IREDA!
Triangle Pattern Breakout in IREDA!
Analysis:
As we can see the stock in moving in a triangle since December 2023. It was continuously consolidating in it. On 27th June it tried breaking out the resistance but unable to sustain above the resistance. Today again it has been successfully given the breakout and able to close above the breakout. As i marked all the important levels on the chart please have a look.
GMDC - Swing Trade Analysis - 9th July #stocksGMDC (1D TF) - Swing Trade Analysis given on 9th July, 2024
Pattern: SYMMETRICAL TRIANGLE BREAKOUT
- Resistance Trendline Breakout - Done ✓
- Strong Pullback candle with Volumes after consolidation - Done ✓
- Demand Zone retest for a Small SL and a better RR - In Progress
* Disclaimer
#GMDC #niftymetal #nifty500
HBL POWER Systems - Looks Good!A Symmetrical Continuation Triangle Pattern Identification on Daily Chart
A Symmetrical Continuation Triangle is a technical analysis pattern observed in financial markets, particularly in charts representing price movements of such stocks, currencies, or commodities. It's considered a continuation pattern, meaning it suggests that the current trend is likely to continue after a period of consolidation or sideways movement.
Breakout: The breakout from the triangle occurs when the price breach
NIACL - Looks Good!Pattern:Symmetrical Continuation Triangle (Bullish)
Time Frame: Daily Chart
Script: NSE:NIACL (New India Assurance Company Ltd)
The recent price movement indicates a breakout from a consolidation phase, signaling the potential continuation of the previous uptrend.
This pattern aligns with the characteristics of a Symmetrical Continuation Triangle (Bullish), where two trendlines converge due to the price making lower highs and higher lows.
During this period, trading volume typically decrea
BPCLIn day time frame price has formed a symmetrical triangle and it can give break out in any direction. In lower time price is consolidating in the form of channel.
Buy above 308 with the stop loss of 305 for the targets 311, 314 and 318.
Sell below 303 with the stop loss of 306 for the targets 300, 297 and 294.
Check the live market updates.
Hit the like button to Rock !! Show some energy !!
Note : This is my pre market analysis and my trading journal. Not a suggestion to buy or sell.
You are r
SbinIn daily time frame price has formed a symmetrical triangle and it can give break out in any direction. In lower time price is facing double top resistance. Trend direction deciding zone will be 860.
Buy above 865 with the stop loss of 860 for the targets 870, 875 and 880.
Sell below 854 with the stop loss of 859 for the targets 849, 844 and 838.
Check the live market updates.
Hit the like button to Rock !! Show some energy !!
Note : This is my pre market analysis and my trading journal. Not a
DMart-Is the breakout for ATH done?Dmart has been consolidating in an ascending triangle pattern since it had tested its strong demand zone of 3200-3300.
Stock managed to give a weekly closing above the resistance of 4200.
It is a high risk, high growth stock, so trade accordingly. Valuation at current price is not good for investing.
Stock can touch ATH if we see a bullish market again.
TURBOUSD at a Critical Juncture: Will It Bounce or Break?Yello, Paradisers! 🌟 Are you ready for an exciting potential breakout? Here’s the scoop on TURBOUSD:
💎TURBOUSD is currently at a critical demand zone where we’ve seen two previous bounces, suggesting a high probability of another bullish move from here.
💎If TURBOUSD shows an I-CHoCH (Internal Change of Character) from this level, it will be a strong signal for a bullish opportunity, targeting previous swing highs.
💎If the price bounces directly from this demand zone without any confirmation,
Detailed Technical Analysis of SJVN LTDKey Observations:
1. Trendline Support: The stock is rebounding from a major trendline support, which also aligns with the support of an upward channel pattern.
2. Volume Activity: There is notable volume action, with current trading volumes being 4-5 times higher than typical daily volumes, indicating strong buying interest.
3. Relative Strength Index (RSI): The RSI is approaching its upper boundary/resistance while the stock price continues to perform well with high volumes.
4. 50-Day Expo