Long
Long
 Short
Short
 Long
Long
The Geometry of a Contraction Pattern01 The Anatomy of a Flip Zone
A Flip Zone is one of the most structurally significant phenomena in technical price action analysis. It describes a price zone,most meaningful when observed on the monthly time frame, that first acted as a formidable resistance ceiling over multiple touches, and subsequently, following a decisive Breakout Candle, requalified itself as a demand zone beneath price.
The mechanism is grounded in market memory. Institutional participants who previously defended that resistance level now shift their posture: the same supply that capped price on the way up becomes the structural support that cushions any retest on the way down. This conversion is not instantaneous - it is confirmed by how price behaves on its return visit to the zone.
Core Principle
A Flip Zone is not a line. It is a contextual reclassification of a prior supply cluster — validated only when price revisits the zone and structure holds.
02 The Breakout Candle — Structural Reclassification
The catalyst for the flip is the Breakout Candle: a high-momentum close that absorbs the overhead supply and clears the prior resistance zone with authority. This candle represents a decisive shift in the demand-supply equilibrium, What makes this candle consequential on the monthly time frame is the weight of the timeframe itself.
Structural Note
The quality of the flip is directly proportional to the quality of the breakout. A convincing, high-volume breakout candle creates a more structurally robust demand zone upon retest.
03 The Descending Triangle
Classical technical analysis characterizes the Descending Triangle as a bearish continuation pattern — a series of lower highs pressing against a horizontal support floor, with the implication of a downside breakdown. This characterization is correct in isolation.
The critical word is isolation.
When a descending triangle forms above a validated monthly Flip Zone, following a one-sided bullish rally, the structural context inverts the conventional expectation. What appears as distribution or topping is, in fact, a contraction pattern — price digesting its own momentum, compressing within a range where demand is structurally anchored beneath it.
Published for educational purposes only.
All concepts — Flip Zone, Equal Highs, Equal Lows, Descending Triangle, Breakout Candle — are referenced in the context of historical price structure analysis.
This is not financial advice. Past price behavior does not determine future outcomes.
 Long
Long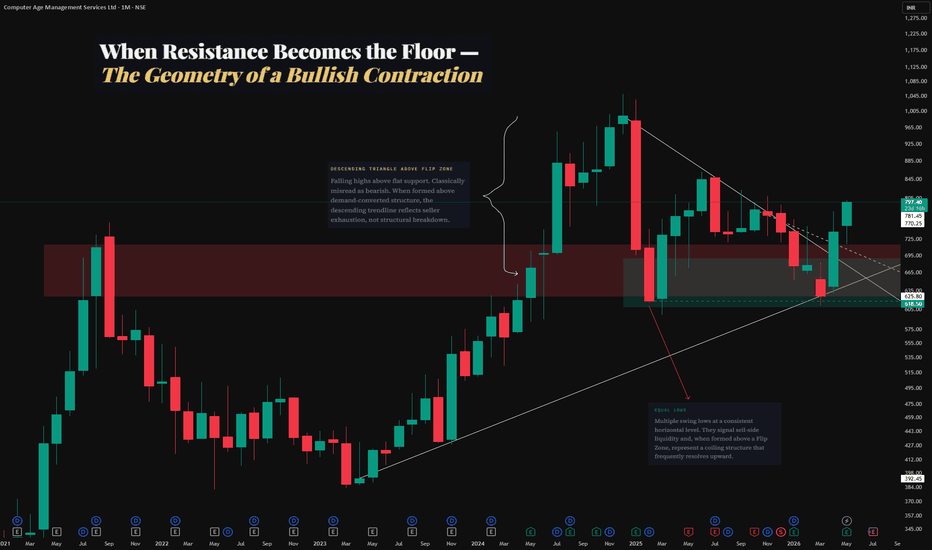
 Long
Long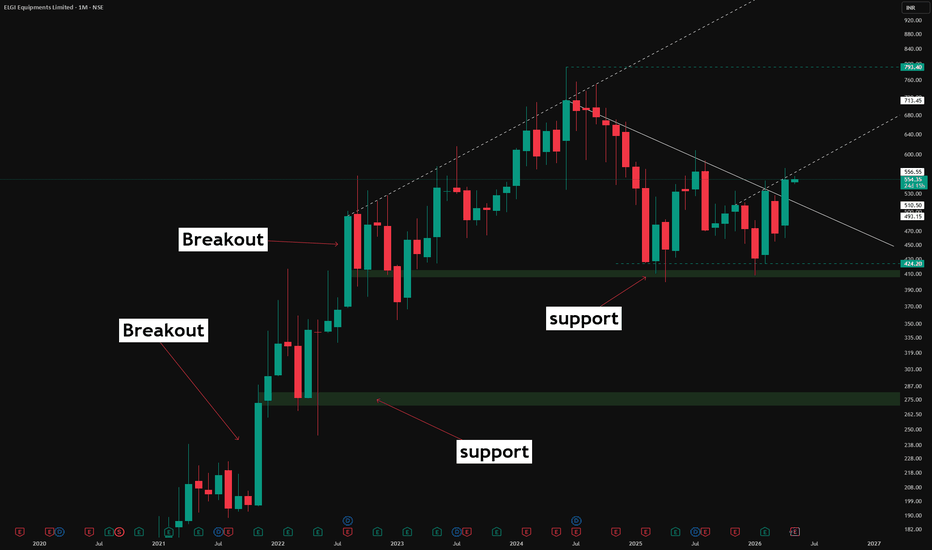
 Long
Long
 Long
Long
 Long
Long
 Long
Long
UNP: Massive Macro Breakout From Multi-Year Ascending TriangleThe Setup (Bias): I am taking a LONG bias on Union Pacific Corporation (UNP) on the macro monthly (1M) timeframe.
The "Why" (Technical Reasons): 1. Ascending Triangle Breakout: The price has powerfully broken out of a massive, multi-year ascending triangle pattern. After years of buyers continually stepping in at higher prices (indicated by the rising lower trendline), they have finally overwhelmed the sellers and cleared the flat-top historical resistance at $252.27.
2. Macro Bullish Momentum: The breakout is confirmed by a strong, full-bodied monthly green candle. Breaking out of a structural pattern of this size on a monthly chart indicates a high probability of a sustained, long-term trend continuation.
Trade Plan (Entry & Exits): * Entry: Momentum and position traders can look for entries near the current market price of $268.70. A more conservative, lower-risk approach would be scaling in on a potential monthly pullback to retest the $252.27 breakout line, letting that old historic ceiling prove itself as a new floor.
Take Profit (Target): Based on the measured move of a triangle this large, the momentum can carry it significantly higher. The next major psychological target is the $300.00 milestone, followed by $320.00.
Stop Loss: Placed safely below the breakout line and the rising trendline support, around $230.00. A monthly close below this level would invalidate the ascending triangle structure.
Duration: Because this analysis is built on a massive 1-Month chart, this is a long-term position trade designed to play out over the coming months to years.  Long
Long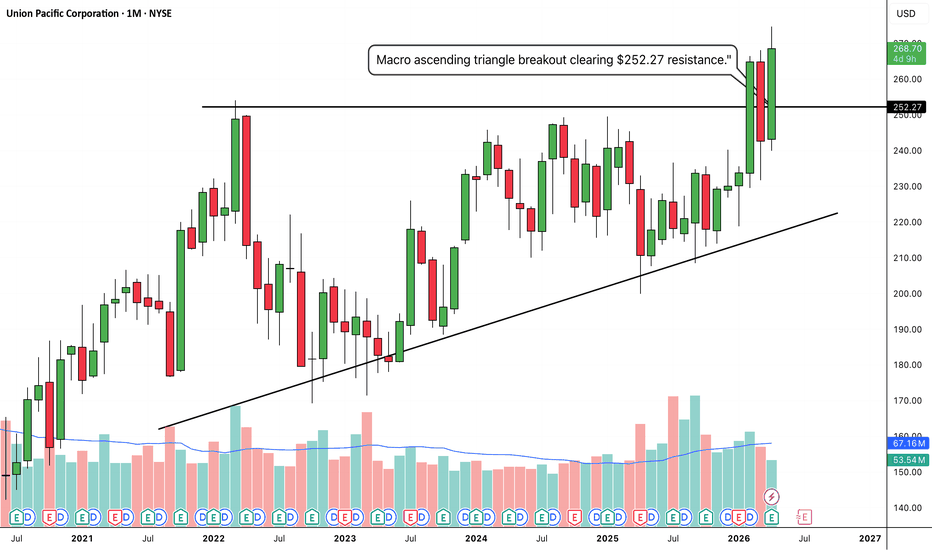
 Long
Long
 Long
Long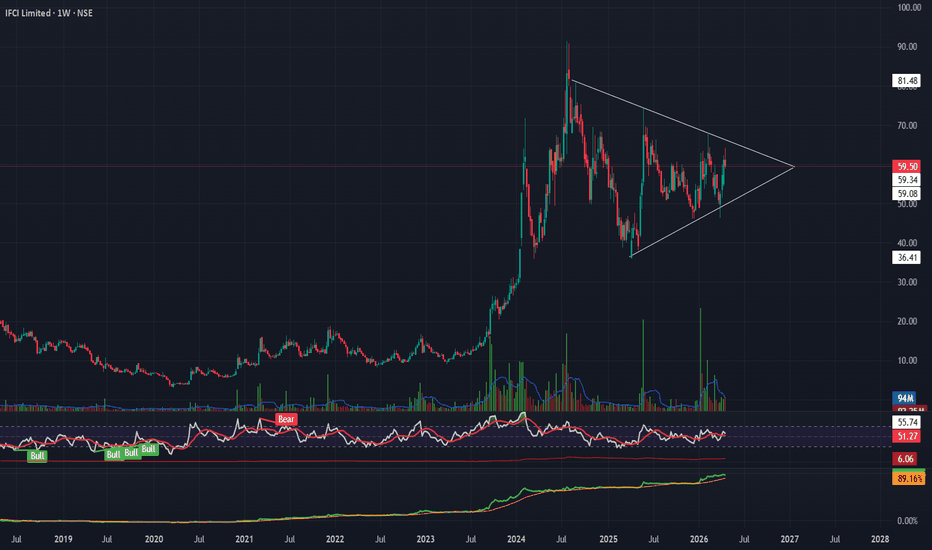
 Long
Long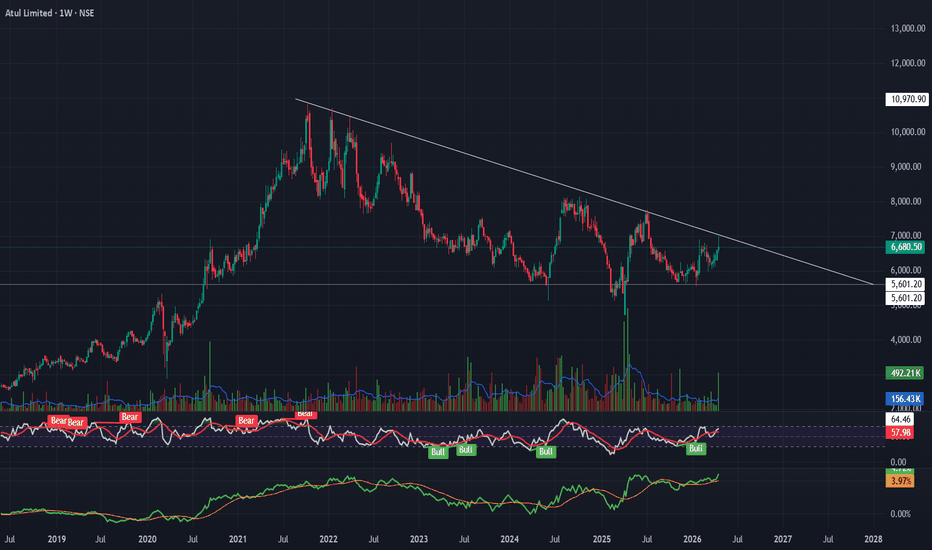
WAAREERTL: Descending Traingle BO, VCP, BESS, Chart of the WeekThis Solar EPC Giant Just Escaped a 15-Month Descending Prison and the Numbers Scream It's Only Getting Started. Posting Strong FY26 Numbers and Entry into BESS. Let's understand it in detail in the "Chart of the Week"
As per the Latest SEBI Mandate, this isn't a Trading/Investment RECOMMENDATION nor for Educational Purposes; it is just for Informational purposes only. The chart data used is 3 Months old, as Showing Live Chart Data is not allowed according to the New SEBI Mandate.
Disclaimer: "I am not a SEBI REGISTERED RESEARCH ANALYST AND INVESTMENT ADVISER."
This analysis is intended solely for informational purposes and should not be interpreted as financial advice. It is advisable to consult a qualified financial advisor or conduct thorough research before making investment decisions.
Price Action:
The weekly chart of WAAREERTL tells a textbook three-act story: a parabolic advance from sub-₹100 levels to an all-time high of ₹3,037.75, a prolonged distribution phase, and now the early stages of a potential re-accumulation and resumption.
From the April 2024 peak, the stock constructed a well-defined descending channel (marked in yellow), defined by a series of lower highs and a flat-to-declining lower boundary hugging the ₹750–800 demand zone. This is a classic Minervini-style Volatility Contraction Pattern (VCP) nested within a broader descending structure.
The VCP formation showed clear successive contractions in volatility, with each swing correction shrinking in amplitude, the hallmark of supply exhaustion and institutional absorption.
The current week's candle (open ₹906.65, close ₹1,116.85, +21.58%) represents a decisive upside breakout of the upper descending trendline, confirmed by a surge in volume to approximately 2.27M shares, roughly 6.5x the 20-period moving average of volume (348.72K). This is the kind of volume expansion that validates a structural change in trend character, not a one-day noise event.
The breakout candle engulfs multiple prior weekly closes in a single session, a signal of Phase D markup initiation in Wyckoff terminology.
Base Analysis: The 750–800 Demand Zone
This zone was tested repeatedly from mid-2025 through early 2026 without a sustained breach, confirming it as a genuine demand zone rather than a coincidental floor
The 52-week low of ₹779.50 sits squarely inside this box, suggesting the final capitulation low was met here
Multiple tests of this zone on declining volume reflect the Wyckoff "spring" characteristic final shakeout of weak holders before markup. The stock touched approximately ₹786 in early March 2026 and then reversed sharply, which is consistent with a Terminal Shakeout structure
The base duration of approximately 12–15 months gives it sufficient time depth to be a launchpad for a meaningful trending move rather than a short-term base
Key Support & Resistance:
Immediate support: ₹1,000–1,020, which was the upper boundary of the prior descending channel and now flips to support upon retest. This is the first line of defense for any pullback.
Secondary support: ₹880–920, the midpoint of the base and a prior congestion zone visible in the weekly structure.
Base support (hard floor): ₹750–800, the multi-test demand box; any violation here on significant volume would negate the bullish thesis entirely.
First Resistance: ₹1,200–1,250, which corresponds to the upper boundary of the descending channel from the 2024 high. This was previously supply and may offer initial resistance on the way up
Second Resistance: ₹1,358, the 52-week high, a natural overhead supply zone where sellers who bought the October 2025 peak will be looking to exit
Structural Resistance / Prior Distribution Zone: ₹1,900–2,000, corresponding to the upper boundary of the descending channel as extended from the April 2024 high
Volume Spread Analysis:
The volume histogram tells the complete story in two phases: during the entire descent from the April 2024 peak to the March 2026 low, volumes were progressively contracting, with most weekly bars clustering below the 20-period MA. This is the "drying up" of supply that precedes a base completion.
The breakout week's volume of 2.27M shares is the largest weekly volume in the entire base period and ranks among the highest in the stock's recent history. On balance, this is institutional-grade buying, not retail frenzy, given the size and the clean close near the week's high.
The 20-week volume moving average at 348.72K provides the baseline; a breakout on 6x+ average volume meets my strictest criteria for a confirmed breakout with institutional participation.
The prior high-volume spikes visible in the histogram (mid-2025 and late-2025) occurred at lower price levels, reinforcing the thesis that accumulation was ongoing well before this week's public breakout.
Sectoral Backdrop: India's Solar EPC Supercycle:
- India's total installed renewable capacity has crossed 274 GW, with solar alone contributing over 150 GW as of March 2026; solar additions surged to over 44 GW during FY26, nearly double the approximately 24 GW added in FY25.
- In FY26, solar accounted for approximately 82% of total renewable capacity additions, firmly establishing it as the primary driver of India's clean energy transition.
- The government's VGF scheme of ₹5,400 crore for 30 GWh of battery energy storage systems signals the next leg of the renewable buildout. Solar EPC companies with BESS capabilities are uniquely positioned to capture this adjacency.
- Domestic cell capacity has reached 32 GW, indicating potential supply-demand balance for solar cells by FY27 or early FY28, which suggests margin stability for large integrated EPC players going forward
Fundamental Backdrop: The Numbers Finally Justify the Chart:
FY26 Annual Results:
- Full-year FY26 revenue from operations stood at ₹3,331.42 crore, a growth of 108.51% year-on-year compared to ₹1,597.75 crore in FY25; EBITDA doubled to ₹641.10 crore from ₹310.90 crore, growing 106.21%; PAT rose 109.09% to ₹478.65 crore from ₹228.92 crore in FY25
- EBITDA margins remained stable at 19.24% for the full year, an important signal that scale-driven growth is not being purchased at the cost of margin compression on an annual basis
- Return on equity stood at 68.93% and return on capital employed at 62.54%, indicating highly efficient capital deployment. These are exceptional return metrics for a capital-intensive EPC business
Q4 FY26: Best Quarter Ever:
- Q4 FY26 revenue from operations rose 131.31% year-on-year to ₹1,102.40 crore; EBITDA stood at ₹206.82 crore and PAT at ₹155.72 crore, representing year-on-year growths of 63.71% and 66.08%, respectively.
- Q4 OPM did compress to 14.1% from 19.7% in Q4 FY25. This is the one blemish, attributed to rising material and logistics costs, and is expected to persist into FY27. This is a risk to track
- Basic EPS for FY26 jumped to ₹45.91, up from ₹22.00 in FY25, a clean doubling of earnings per share.
Order Book & Revenue Visibility:
- The unexecuted order book stands at 2.83 GWp, slated for execution over the next 12–15 months; the bidding pipeline exceeds 36 GWp. This gives WAAREERTL among the strongest near-term revenue visibility in the sector
- The company has commissioned 5.06 GWp of projects cumulatively and secured multiple new orders during FY26, including projects of 420 MWp, 35 MWp, and 14 MWp in Q4 alone
BESS Entry: The New Growth Vector:
- Management's strategic shift towards integrating IPP operations alongside existing EPC services is expected to enhance long-term revenue stability; the company is also positioned to capitalize on growing demand for Battery Energy Storage Systems (BESS)
- The Waaree Group, the parent entity, is now into Battery Energy Storage System and Green Hydrogen Electrolyser manufacturing, giving WAAREERTL a built-in supply chain advantage as BESS EPC opportunities emerge
Valuation:
- The stock's P/E ratio has moved to approximately 24.30 and P/BV to 12.5, elevated by absolute standards but materially lower than the 100x+ multiples at which the stock traded during its 2023–2024 parabolic run
- The "valuations finally cooled" thesis holds as the stock has delivered roughly 2x earnings growth while the stock price has corrected nearly 63% from its peak, compressing the multiple significantly even as the business scaled.
My 2 Cents:
- OPM compression is real and management has guided for continued margin pressure in FY27 due to material and logistics cost inflation. Any further deterioration would challenge the re-rating.
- The breakout week's 21.58% single-week gain invites a near-term consolidation or retest of the breakout level (₹1,000–1,020). Entries chasing at current levels carry an elevated risk of being caught in that pullback.
- The ₹1,358 prior high (52-week high) represents significant overhead supply; a clean break above this level is needed to confirm the next leg toward ₹1,600+
- Beta of approximately 1.98–2.53 means this stock moves violently in both directions relative to the broader market. Position sizing discipline is non-negotiable.
Full Coverage on my Newsletter coming next week.
Keep in the Watchlist and DOYR.
NO RECO. For Buy/Sell.
📌Thank you for exploring my idea! I hope you found it valuable.
🙏FOLLOW for more
👍BOOST if you found it useful.
✍️COMMENT below with your views.
Meanwhile, check out my other stock ideas on the right side until this trade is activated. I would love your feedback.
As per the Latest SEBI Mandate, this isn't a Trading/Investment RECOMMENDATION nor for Educational Purposes; it is just for Informational purposes only. The chart data used is 3 Months old, as Showing Live Chart Data is not allowed according to the New SEBI Mandate.
Disclaimer: "I am not a SEBI REGISTERED RESEARCH ANALYST AND INVESTMENT ADVISER."
This analysis is intended solely for informational purposes and should not be interpreted as financial advice. It is advisable to consult a qualified financial advisor or conduct thorough research before making investment decisions.  Long
Long
 Short
Short
 Long
Long
 Long
Long
When Structure Meets Pattern: A Masterclass in ConfluenceMarkets don't move randomly they leave behind structural footprints that traders can study, learn from, and apply across timeframes and instruments.
📐 What Is a Symmetrical Triangle?
A symmetrical triangle is a continuation/neutral pattern formed when price action compresses between two converging trendlines — a descending upper boundary and an ascending lower boundary. Neither buyers nor sellers dominate during its formation, reflecting market indecision before a potential directional resolution.
🔄 Resistance-to-Support Conversion (Supply-Demand Zone Flip)
One of the foundational concepts in technical analysis is the idea that a broken resistance level, once confirmed, can transition into a support zone. This phenomenon: often referred to as a supply-to-demand conversion or role reversal zone, reflects a shift in market participant behaviour. Former sellers at a price level become buyers after a breakout is established, anchoring price above that zone.
⚡ The Confluence Factor
Confluence in trading refers to multiple technical factors aligning at or around the same price area.
📊 Left Chart — Historical Reference (2023) ( Old chart )
The left chart presents a historical example from 2023 where price action on the same timeframe demonstrated an identical structural sequence:
-A key resistance level was broken with conviction
-Price returned to that prior resistance zone, which then held as support — confirming the supply-to-demand conversion
-A symmetrical triangle pattern subsequently formed above that converted zone
📊 Right Chart — Current Structure
The right chart displays current price action on the same timeframe, highlighting the same technical elements in their present form:
-A prior resistance zone that has been tested and respected multiple times as support following a breakout
-A symmetrical triangle pattern started in 2024
-A clearly defined confluence area where structural support and pattern boundaries align
No directional bias is implied. No targets, predictions, or trade recommendations are being made. The chart is shared strictly for educational and analytical observation. Charts used are older than 3 months charts for markings of above concepts .
 Long
Long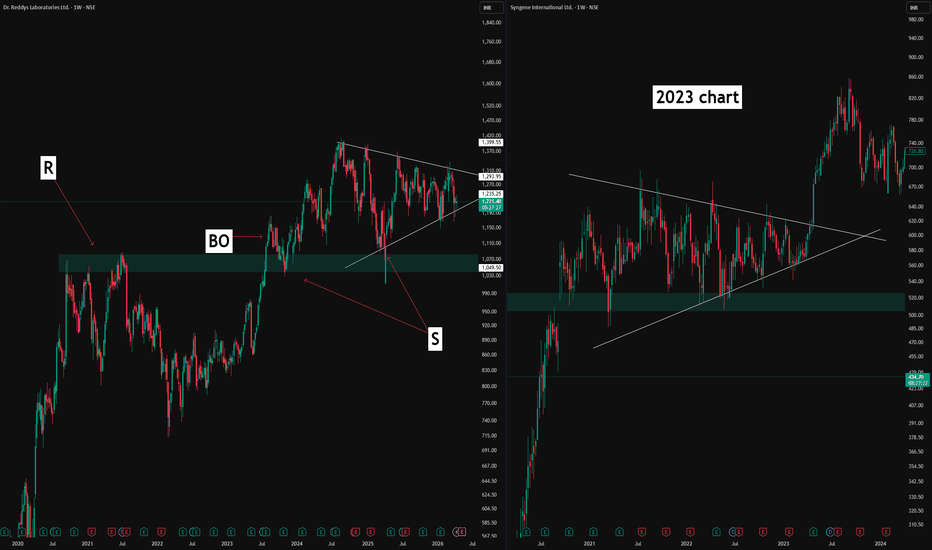
Gold (MCX): Trading the Barrier Triangle Compression BreakoutTechnical Context
Gold Futures (MCX) are currently displaying a powerful structural sequence on the 4-hour chart. Following a major market low at 129,595 , the asset has built a nested impulse. This indicates a primary uptrend is gaining heavy momentum through a sequence of higher highs and higher lows.
The most recent surge peaked at 154,500 , striking a key mathematical extension. Since that peak, price has entered a consolidation phase known as a Barrier Triangle . In this pattern, sellers are defending a flat price ceiling, while buyers are aggressively stepping in at progressively higher lows. This dynamic compresses market volatility, storing energy for a terminal thrust in the direction of the dominant uptrend.
Bullish Scenario
The primary thesis dictates upward trend continuation. The horizontal resistance serves as the final barrier before the next leg of the macro advance.
Trigger: Sustained breakout above the upper barrier at 155,065 .
Target: The sequence projection maps the next major peak at 165,100 .
Invalidation (Stop Loss): 151,225 .
Summary
The present geometry in Gold Futures offers a high-conviction, asymmetrical setup. The directional bias remains strongly bullish, provided the asset breaches the static supply zone. The barrier triangle structure allows for precise entry upon breakout and tight risk management just below the rising demand line. Patience is required to wait for the exact trigger before executing.
Disclaimer: This analysis is for educational purposes only and does not constitute investment advice. Please DYOR before making any trading decisions.  Long
Long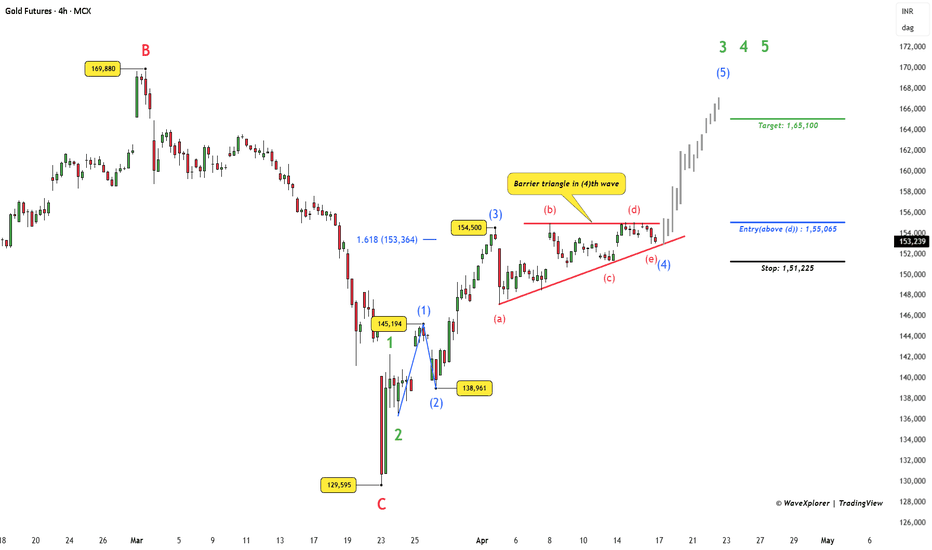
Long 
Short