RSI Divergence — A Price Action & Momentum Study📌What This Chart Is Showing
This is a purely observational, educational study combining classical chart pattern analysis, polarity zone behaviour, and RSI momentum divergence — all converging at the same structural area on the weekly timeframe. No forecast. No bias. Just what the chart is communicating through price and momentum.
📌The Descending Triangle — Historical Context
Going back 2–3 years, this chart carved out a well-defined descending triangle pattern — one of the most recognized structures in classical technical analysis.
- A flat horizontal support level (marked S) — where price repeatedly finds buyers at the same price area
A series of Lower Highs converging downward toward that support — indicating that sellers are becoming progressively more aggressive, willing to sell at lower and lower prices with each rally
📌Now — RSI Divergence
Understanding RSI Divergence — In Depth
The Relative Strength Index (RSI) is a momentum oscillator. It doesn't measure price — it measures the speed and strength of price movement. This distinction is everything when reading divergence.
⚠️What is Divergence?
Divergence occurs when price and momentum stop agreeing with each other. In a healthy, sustained move, price and momentum trend together. When they begin to disagree — when price goes one way but momentum goes another — it signals that the move may be losing its internal engine.
📌Regular Bullish Divergence
Price prints a new Lower Low — on the surface, the downtrend appears to be continuing
But the RSI prints a Higher Low — meaning that despite price falling further, the selling momentum behind that move is actually weakening
Fewer sellers are participating with conviction
The bears are still pushing price down, but they are doing so with less and less force
Think of it like this: imagine a car moving forward but the driver is easing off the accelerator. The car is still moving, but the engine is losing power. Divergence is the gauge showing you the engine is weakening — even if the car hasn't stopped yet.
⚠️ Disclaimer: This post is strictly educational and intended purely for the study of technical analysis concepts including chart patterns, polarity zones, and RSI divergence. This is not financial advice, not a trade signal, and not a directional forecast of any kind. No bullish or bearish bias is expressed or implied.
 Long
Long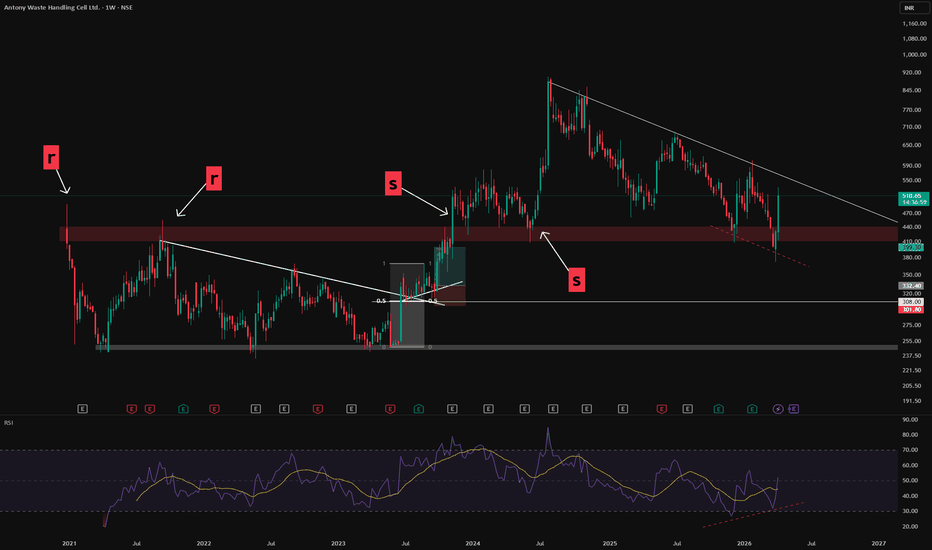
 Long
Long
 Long
Long
 Long
Long
 Long
Long
 Long
Long
 Short
Short
Long
 Long
Long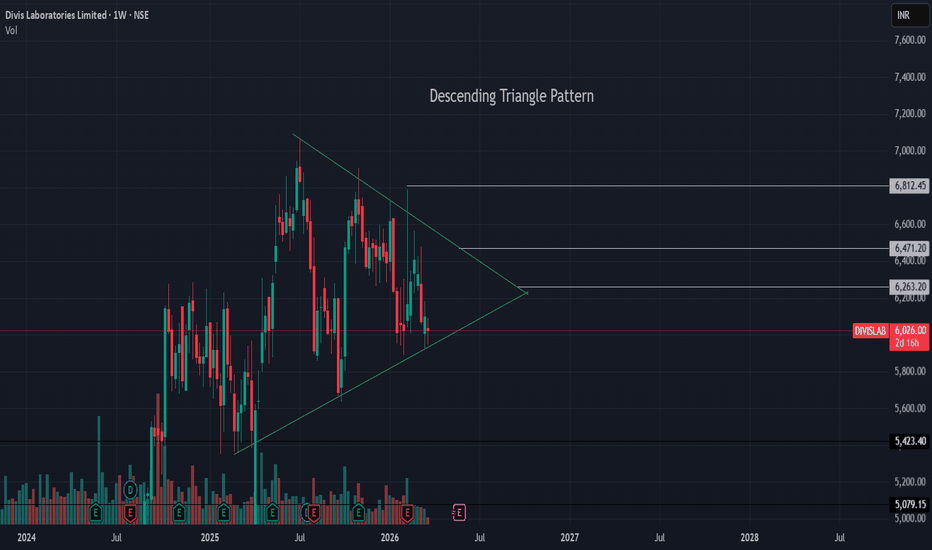
Nifty - Expiry day analysis March 24We had a gap-down opening today, and today's movement has created a descending triangle, which is a bearish pattern. Nearby resistance is at 22950 - 23000 and nearby support is seen at 22480 - 22520.
Buy above 22620 with the stop loss of 22560 for the targets 22660, 22740, 22820, 22880, 22960 and 23040.
Sell below 22460 with the stop loss of 22540 for the targets 22400, 22340, 22280, 22200, 22140, 22080 and 22020.
Expected expiry day range is 22200 to 22900.
The main trend is bearish and volatile; do your analysis before taking any trade.
 Long
Long
APOLLOPIPE: Descending Triangle Breakout, Chart of the WeekApollo Pipes Just Broke Out of a 2-Year Descending Triangle on Record Volume. Let's understand it in detail in the "Chart of the Week"
As per the Latest SEBI Mandate, this isn't a Trading/Investment RECOMMENDATION nor for Educational Purposes; it is just for Informational purposes only. The chart data used is 3 Months old, as Showing Live Chart Data is not allowed according to the New SEBI Mandate.
Disclaimer: "I am not a SEBI REGISTERED RESEARCH ANALYST AND INVESTMENT ADVISER."
This analysis is intended solely for informational purposes and should not be interpreted as financial advice. It is advisable to consult a qualified financial advisor or conduct thorough research before making investment decisions.
Price Action Analysis:
- The current monthly candle is one of the largest bullish candles on the entire chart in both price range and body size — open ₹348, high ₹444.80, low ₹332.55, close ₹407.60.
- The stock bounced precisely from the long-standing horizontal support (green band) and closed well above the falling trendline on enormous volume — a monthly breakout with conviction.
- The prior 18+ months showed consistent lower highs and persistent selling pressure with below-average volumes; the abrupt reversal in character (volume + price expansion) is a structural shift signal.
Volume Spread Analysis:
- The most critical technical element in this chart is the volume bar at the bottom: the current month's volume of 87.51M dwarfs all prior months dramatically, representing approximately 12x the 20-period average volume of 7.15M.
- This is not routine buying; this is institutional-grade accumulation or forced short-covering on a massive scale.
- In the Wyckoff methodology, this pattern of a high-volume reversal from a key support after extended distribution is consistent with a "spring" or Phase C accumulation event, which often precedes a sustained markup phase.
Technical Pattern Analysis:
Descending Triangle
- The stock peaked near ₹800 in mid-2024 and carved out a classic descending triangle, a series of lower highs capped by a falling trendline (the diagonal blue line on the chart), while the horizontal support held around ₹260–₹280.
- This pattern typically resolves bearishly, and it did, as the stock broke below and tested the horizontal support zone hard.
- However, what makes this current price action remarkable is that the stock has now violently reclaimed this trendline from below, converting the prior resistance into support, a textbook failed breakdown/bull trap reversal.
Base Formation:
- A multi-year consolidation base was established roughly between ₹260 and ₹300 from late 2020 through early 2021 and again tested in early 2026.
- This zone aligns precisely with the base, a demand zone of strong historical significance spanning 5+ years.
- The stock defended this base convincingly, printing a long lower wick on the monthly candle at the lows and reversing the hallmark of a capitulation bottom.
Key Support and Resistance Levels:
- Strong Support / Base Zone: ₹260–₹285 (multi-year demand zone)
- Immediate Support (Post Breakout): ₹330–₹348 (prior resistance-turned-support)
- First Resistance: ₹450–₹495 (prior consolidation zone and 52-week high area)
- Major Resistance: ₹550–₹600 (prior intermediate tops from 2023)
- Ultimate Supply Zone: ₹720–₹800 (all-time high region)
Sectoral Backdrop — Piping Sector:
- Apollo Pipes operates in the plastic piping systems space: PVC, CPVC, HDPE, and uPVC pipes catering to agriculture, infrastructure, real estate, and industrial segments.
- The sector has faced headwinds over the past 18 months: raw material (PVC resin) price volatility, overcapacity in the industry, slowdown in construction activity, and weak rural demand.
- However, the sector is now at a potential inflection point driven by a massive policy catalyst.
Jal Jeevan Mission 2.0 — The Game Changer
- The Union Cabinet approved the restructuring and reorientation of Jal Jeevan Mission (JJM 2.0), enhancing the total outlay to ₹8.69 lakh crore with central assistance of ₹3.59 lakh crore — up from ₹2.08 lakh crore approved in 2019–20 — with the mission extended to December 2028.
- The mission aims to provide tap water connections to all 19.36 crore rural households across India by December 2028, with a "Sujalam Bharat" digital framework that digitally maps the entire water supply chain from source to tap.
- Apollo Pipes soared 8.13% to ₹410.95 on the day the Cabinet officially approved JJM 2.0, reflecting the direct demand tailwind for pipe manufacturers.
- Despite the enthusiasm, the implementation pace remains a concern. The 2025–26 budget estimate for Jal Jeevan was ₹67,000 crore, but revised spending stands at only ₹17,000 crore, suggesting execution bottlenecks remain a live risk.
Fundamental Backdrop:
Company Profile:
- Apollo Pipes manufactures a wide range of plastic piping systems, including PVC and HDPE pipes, serving sectors like agriculture, infrastructure, and construction, with multiple production facilities catering to both domestic and international markets. Operating revenue stands at ₹1,072.67 crore on a trailing twelve-month basis.
- The company scaled production capacity to 2,25,500 TPA in FY2025, commissioned a new OPVC product capacity, and acquired Kisan Mouldings, one of the leading pipe brands in West India, with 60,000 tons capacity in 2024.
Near-Term Financial Stress (The Bear Case)
- Apollo Pipes reported a net loss of ₹3.26 crore in Q3 FY26 (December 2025 quarter), against a net profit of ₹6.21 crore in the same quarter of the prior year, with sales declining 19.73% year-on-year to ₹247.18 crore.
- The company has a low return on equity of 5.84% over the past three years, with the promoter holding at 46.8%.
- The TTM EPS stands at approximately ₹5.82, placing the stock at an elevated trailing P/E above 90x — expensive on near-term earnings, though the market is clearly pricing in a recovery.
Management Guidance and Insider Buying (The Bull Case)
- Management expects 23–35% Q4 volume growth, supported by the new Varanasi plant enhancing Eastern India presence, after flat volumes through the first nine months of FY26.
- S Gupta Holding Private Limited, a promoter group entity, acquired 5.25 lakh equity shares worth ₹16.64 crore through an open market purchase on February 13, 2026, disclosed under SEBI insider trading regulations.
- The promoter acquisition was at an average price of ₹317, signalling strong internal conviction despite prevailing financial headwinds.
- Apollo Pipes is expanding its product portfolio with PLB ducts, DWC pipes, PE gas pipes, and PVC-O pipes and has tied up with Lubrizol to strengthen its CPVC pipe segment, which currently contributes around 15% of volumes.
- Apollo Pipes acquired a controlling stake in Kisan Mouldings, expanding its product portfolio and distribution network, strengthening its ability to capture infrastructure demand.
My 2 Cents:
- The chart is showing a textbook "failed breakdown" reversal from a multi-year base, confirmed with record monthly volume, a rare and powerful technical event.
- The macro catalyst of JJM 2.0 (₹8.69 lakh crore outlay through 2028) directly benefits pipe manufacturers, and Apollo Pipes is positioned to capture a share of this demand once execution picks up.
- Insider/promoter buying at ₹317 provides a credible floor and signals that those closest to the business believe the worst is behind them.
- Near-term fundamental weakness (net losses, high P/E) is a genuine risk and means this is a recovery/turnaround trade, not a value buy on earnings.
- The first level to watch on the upside is ₹450–₹495 (52-week high area); a monthly close above that opens the ₹550–₹600 zone. On the downside, a breakdown below ₹330 would cast serious doubt on the breakout thesis.
Full Coverage on my Mid-Week Newsletter coming Week.
Keep in the Watchlist and DOYR.
NO RECO. For Buy/Sell.
📌Thank you for exploring my idea! I hope you found it valuable.
🙏FOLLOW for more
👍BOOST if you found it useful.
✍️COMMENT below with your views.
Meanwhile, check out my other stock ideas on the right side until this trade is activated. I would love your feedback.
As per the Latest SEBI Mandate, this isn't a Trading/Investment RECOMMENDATION nor for Educational Purposes; it is just for Informational purposes only. The chart data used is 3 Months old, as Showing Live Chart Data is not allowed according to the New SEBI Mandate.
Disclaimer: "I am not a SEBI REGISTERED RESEARCH ANALYST AND INVESTMENT ADVISER."
This analysis is intended solely for informational purposes and should not be interpreted as financial advice. It is advisable to consult a qualified financial advisor or conduct thorough research before making investment decisions.  Long
Long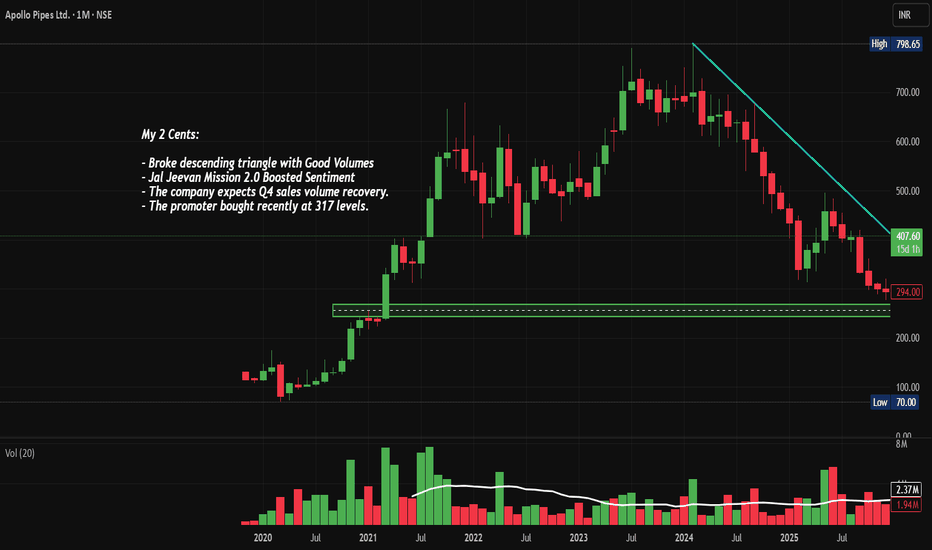
 Long
Long
 Short
Short
 Long
Long
Price Action Harmony — Tradingview Multi layout Multi time frame📝 DESCRIPTION
This layout presents a multi-timeframe structural analysis using pure price action — no indicators, no bias, no forecast. Simply observing how price has respected key levels and patterns with remarkable precision.
🔵 LEFT PANEL — Weekly Chart | Resistance Turned Demand
One of the most fundamental and reliable concepts in technical analysis is the role reversal — where a prior resistance level, once broken and accepted above, transitions into a demand zone on retests.
This weekly chart illustrates exactly that. Price discovered resistance at a defined horizontal level, consolidated, and eventually broke through with conviction. On subsequent pullbacks, that same level attracted buyers — validating the zone as institutional demand
🟢 TOP RIGHT PANEL — Monthly Chart | Parallel Channel
Zooming out to the monthly timeframe, price has been navigating a well-defined ascending parallel channel, marked with green boundary lines.
The upper green line represents the macro resistance/ceiling of the channel
The lower green line represents the structural support/floor
Price has consistently respected both boundaries over multiple cycles — bouncing from support and rotating from resistance. No projections are being made; this is a visual of what has occurred.
🟡 BOTTOM RIGHT PANEL — Weekly Chart | Symmetrical Triangle
On the second weekly view, yellow trendlines define a symmetrical triangle formation — a pattern characterized by:
A series of lower highs converging with higher lows
Price compressing toward the apex as both buying and selling pressure equalize
A tightening range that reflects indecision and consolidation at a structural level
The symmetrical triangle is highlighted here purely for its geometric elegance and how cleanly price has respected both trendline boundaries. No directional assumption is implied
All analysis is based solely on historical price action. This post is educational and observational in nature — not financial advice, and not a forecast of future price movement.  Long
Long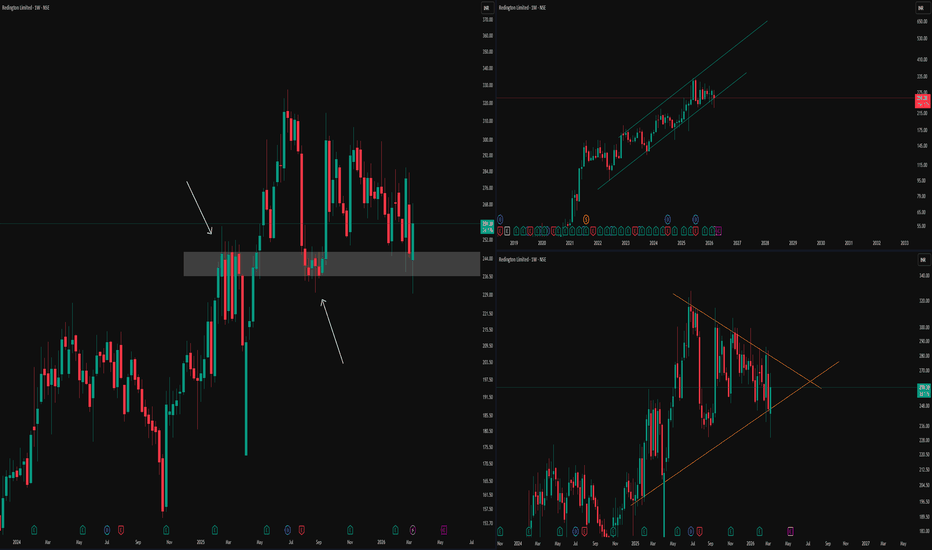
 Long
Long