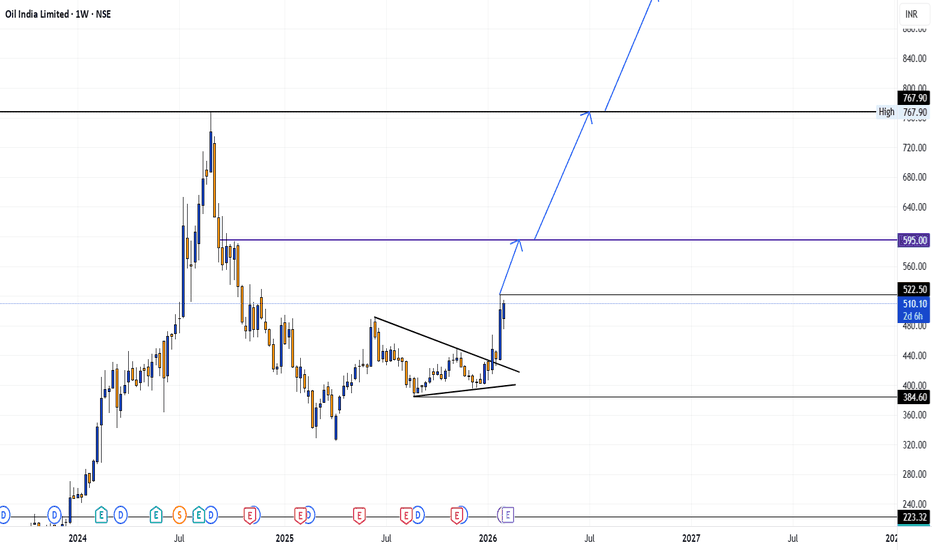
Long
Long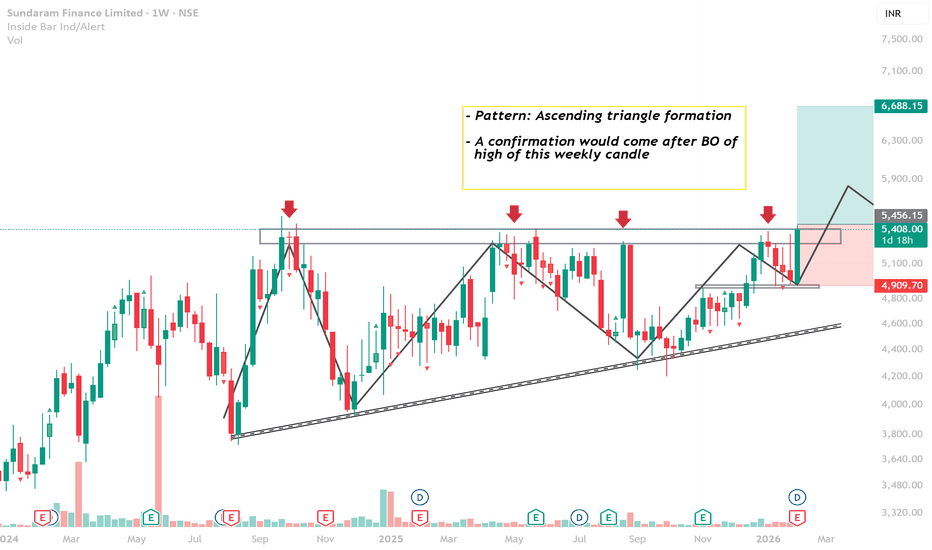
 Short
Short
Long

Aditya Birla Sun Life AMC Ltd (D): Strong Bullish(Timeframe: Daily | Scale: Linear)
Overall View: 🐂 Strong Bullish (Ascending Triangle Breakout)
The stock has confirmed a major structural breakout from an Ascending Triangle. Despite intraday profit-booking today (forming a bearish-looking candle), the broader trend remains powerfully intact as it sustains above previous resistance levels.
🚀 1. The Fundamental Catalysts (The "Why")
The technical breakout is heavily supported by sector and company-specific tailwinds:
> Q3 Earnings Momentum: The company delivered strong quarterly results, showing solid growth in operating revenue and net profit, confirming that valuations are backed by real growth.
> Sector Tailwinds: The Indian mutual fund industry continues to see record-breaking monthly SIP inflows, providing a steady stream of AUM (Assets Under Management) growth for top-tier AMCs.
📈 2. The Chart Structure (The Breakout & Re-test)
> The Pattern: An Ascending Triangle , characterized by a flat upper resistance (₹894–₹900) and higher lows pushing up against it.
> Today's Action (The Gap-Up): Opening gap-up at ₹926 shows aggressive pre-market demand.
- The intraday fall to close at ₹918 indicates standard profit-booking at new All-Time Highs (creating the red candle).
- Significance: This is perfectly healthy. As long as the stock doesn't fall back into the triangle, today's bearish candle is just a temporary pause, not a reversal.
📊 3. Volume & Indicators
> EMAs: The Positive Cross-Over (PCO) across Monthly, Weekly, and Daily timeframes confirms absolute trend harmony. The stock is in a confirmed "Markup Phase."
> RSI: The RSI is rising into the "Overbought" zone (>70). In a Blue Sky breakout (New ATH), RSI can remain overbought for extended periods. It is a sign of strong momentum, not an immediate sell signal.
> Volume: The volume is above average, confirming institutional participation in the breakout.
🎯 4. Future Scenarios & Key Levels
The stock is in unchartered territory, making Fibonacci extensions the best targeting tool.
🐂 Bullish Targets (The Extension):
- Target 1: ₹980.
- Target 2: ₹1,015.
🛡️ Support (The "Must Hold"):
- Immediate Support: ₹894 – ₹900. The Polarity Principle dictates that this former ceiling must now act as a rigid floor. Today's close safely above it is a major positive.
- Structural Support / Stop Loss: ₹850. If the stock slices through ₹894, the immediate safety net is the upward-sloping trendline of the triangle near ₹850. A daily close below this invalidates the bullish setup.
Conclusion
This is a High-Quality Breakout Setup.
> Refinement: Don't let today's red candle shake you out. It is a natural "cooling off" after a gap-up to a new ATH.  Long
Long
 Long
Long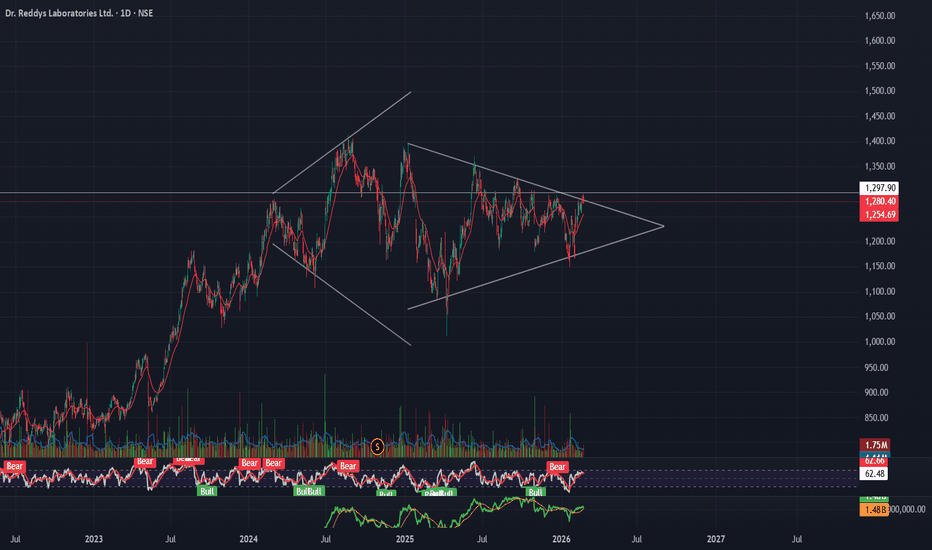
 Long
Long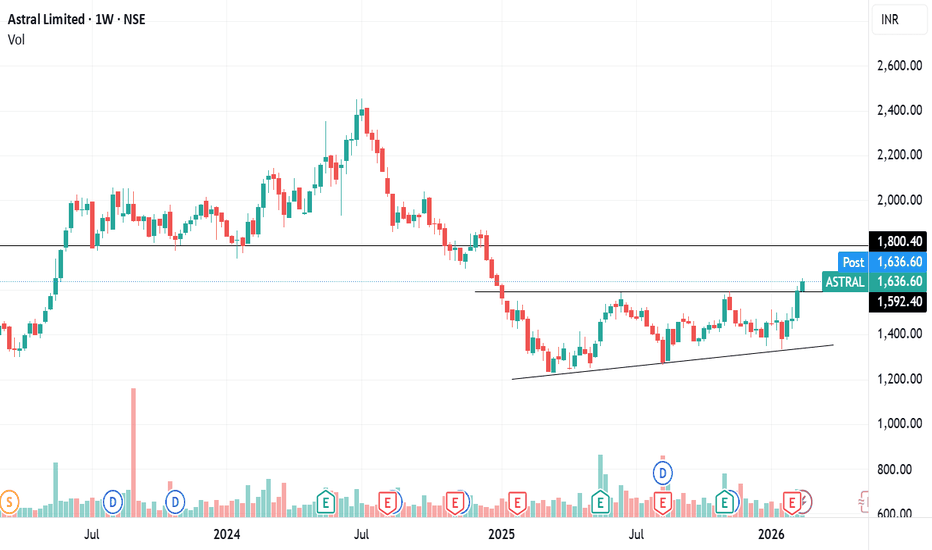
 Long
Long
Price Perfection: Inverted H&S, Red Zone FlipObserve the pristine price action on this chart, where every level commands unwavering respect.
-Red Zone (Initial Resistance): Price traded lower beneath this key red zone, forming a textbook inverted head-and-shoulders pattern below it—left shoulder, head, right shoulder clearly defined, signaling potential reversal setup.
-Zone Flip to Support: Once price sustained above the red zone, it flipped roles seamlessly, acting as reliable support for an extended period. This classic resistance-to-support transition held firm.
-Descending Triangle Formation: Above the flipped red zone (now the flat base), price carved a precise descending triangle—red zone as the horizontal support, green downtrending line as converging resistance, with multiple clean tests.
-Monthly ATH Resistances: Two white lines mark the stock's all-time high monthly resistances overhead, untouched and respected amid the consolidation.
This sequence showcases how broken resistances (when sustained) often birth new patterns above, with price honoring structure at every turn. Pure chart artistry—no predictions, just appreciation.
Disclaimer: I am not a SEBI-registered analyst. This post is for educational observation only, not forecasting, advice, or bias. Trade at your own risk.  Long
Long
 Long
Long
 Long
Long
Sterlite Tech (W): Aggressive Bullish (Decadal Breakout)(Timeframe: Weekly | Scale: Logarithmic)
The stock has confirmed a breakout from a 10-Year Symmetrical Triangle (2014–2025). Unlike previous attempts (which left long upper wicks), this week shows a strong closing candle above the resistance, supported by "Climax Volume."
🚀 1. The Fundamental Catalyst (The "Why")
The technical explosion is fueled by a structural shift in business prospects:
> US Market Opening: The reduction in US tariffs removes a major overhang, making STL competitive in its largest market again.
> Promoter Buying: The warrant issue at ₹110 sets a psychological floor. The market knows promoters are "all-in."
> Brokerage Upgrades: Recent reports (e.g., Nuvama) have raised targets to ₹200+, adding institutional credibility to the rally.
📈 2. The Chart Structure (The Decade Squeeze)
> The Pattern: The Symmetrical Triangle active since 2014.
> Resistance: The downward sloping trendline connecting peaks of 2018 (₹300+) and 2021 (₹200+) was passing through ₹145–₹150 .
> The Breakout: The stock closed the week at ~₹155 , confirming the jailbreak.
> Golden Crossover: On the Daily chart, the 50-DMA is rapidly approaching the 200-DMA from below. A crossover is imminent, which often triggers algorithmic buying.
📊 3. Volume & Indicators
> Volume Ignition: The volume is not just "high"; it is historic . This level of churn suggests a complete change of hands from "tired investors" to "fresh smart money."
> RSI: Rising sharply. Note that RSI is entering the "Overbought" zone (>70) on Weekly/Daily. In strong breakouts, RSI should remain overbought; it is a sign of strength, not a sell signal.
🎯 4. Future Scenarios & Key Levels
The stock has entered "Markup Phase."
🐂 Bullish Targets (The Extension):
- Target 1: ₹200 – ₹216.
- Target 2: ₹295.
🛡️ Support (The "Must Hold"):
- Immediate Support: ₹140 – ₹145. The breakout zone must now act as a rigid floor ( Polarity Principle ).
- Stop Loss: A weekly close below ₹130 would signal a "False Breakout" (Bull Trap).  Long
Long
 Long
Long
 Long
Long
 Short
Short
 Long
Long
 Long
Long
Long 
GRWRHITECH: Descending Triangle Breakout, Chart of the WeekDouble Bottom or Dead Cat Bounce? Why Garware's Next Move Could Make or Break Your Portfolio. From ₹5,378 to ₹2,600:How a 38% Profit Crash and 50% US Tariffs Brought This Market Leader to Its Knees, and what changed now? Let's Understand in the "Chart of the Week"
As per the Latest SEBI Mandate, this isn't a Trading/Investment RECOMMENDATION nor for Educational Purposes; it is just for Informational purposes only. The chart data used is 3 Months old, as Showing Live Chart Data is not allowed according to the New SEBI Mandate.
Disclaimer: "I am not a SEBI REGISTERED RESEARCH ANALYST AND INVESTMENT ADVISER."
This analysis is intended solely for informational purposes and should not be interpreted as financial advice. It is advisable to consult a qualified financial advisor or conduct thorough research before making investment decisions.
Price Action:
The weekly chart of Garware Hi-Tech Films reveals a dramatic shift from a strong uptrend to a well-defined downtrend. The stock reached an all-time high of ₹5,378.10 before experiencing a severe correction of approximately 50% to current levels around ₹4,258.40.
Key observations:
- Strong ascending triangle pattern formation that broke out with substantial volume support post US-India trade deal announcement
- A clear transition from bullish momentum to bearish trend following the peak in early 2025
- Formation of a descending channel marked by two parallel red trendlines acting as dynamic resistance
- Recent price action showing a potential base formation in the ₹2,600-₹2,800 zone
Base Identification:
Primary Accumulation Base (2023-2024):
A significant consolidation zone between ₹2,600-₹2,800 levels spanning from mid-2024 through early 2025. This horizontal support zone, represents a critical demand area where the stock found support multiple times. This base served as the launchpad for the subsequent rally toward all-time highs.
Current Potential Base Formation:
The stock is currently retesting the same ₹2,600-₹2,800 zone, suggesting the possibility of a double-bottom formation. This level has shown initial signs of buying interest with recent green candles emerging.
Volume Spread Analysis:
Volume patterns reveal critical insights into the stock's price movements:
Breakout Volume Surge:
The ascending triangle breakout was accompanied by exceptional volume spikes (1.45M shares), indicating strong institutional participation and conviction in the upward move. This validates the breakout's legitimacy.
Distribution Phase:
During the rally to all-time highs, volume began to taper off at higher price levels, suggesting waning buying interest and potential distribution by smart money. This is a classic warning sign of trend exhaustion.
Recent Volume Characteristics:
- Volume has been declining during the correction phase, indicating a lack of panic selling
- Recent green candles show renewed volume interest at the support zone (1.45M shares in the latest sessions)
- The 20-day average volume of 384.69K shares is being exceeded during recent trading, suggesting accumulation at lower levels
Delivery Volume Analysis:
Recent reports indicate that delivery volume surged by 226.02% on February 2, 2026, signalling strong investor conviction rather than speculative trading. This is typically a positive sign for medium to long-term holders.
Key Support Levels:
Immediate Support: ₹2,600-₹2,800 (Primary demand zone)
This level represents the previous accumulation base and has demonstrated strong buyer interest historically. The zone has witnessed multiple tests and held firm during the consolidation period.
Secondary Support: ₹2,400
If the primary support fails to hold, the next major support lies around ₹2,400, which aligns with previous consolidation lows from the 2023-2024 period.
Critical Support: ₹2,000
The psychological level of ₹2,000 serves as the last line of defence before the stock could test significantly lower levels.
Key Resistance Levels:
Immediate Resistance: ₹3,200-₹3,400
The first major resistance zone where the stock has faced selling pressure during the recent downtrend. This area corresponds to the breakdown point from the ascending triangle.
Major Resistance: ₹3,800-₹4,000
A significant supply zone where multiple price rejections have occurred during the correction phase. This level also aligns with the 50% Fibonacci retracement of the entire rally.
Strong Resistance: ₹4,600-₹4,800
The descending trendline resistance (upper red line) currently intersects around these levels and represents a formidable barrier to upward movement.
All-Time High Resistance: ₹5,378.10
The psychological barrier where profit-booking intensified and marked the beginning of the current correction.
Technical Pattern Analysis:
Ascending Triangle Breakout (Completed):
The stock formed a well-defined ascending triangle pattern with higher lows and a flat resistance around ₹2,800. The breakout occurred with exceptionally strong volume (visible in the volume bars showing spikes of 1.45M shares), validating the pattern. This breakout was likely triggered by the US-India trade deal announcement.
Potential Double Bottom Formation:
The stock is attempting to form a double bottom pattern at the ₹2,600-₹2,800 support zone. A successful hold at these levels with a subsequent rally above ₹3,400 could validate this reversal pattern.
Critical Technical Levels Summary:
Key Level to Watch: ₹2,600
This is the make-or-break level. A decisive close below this support on heavy volume would signal continuation of the downtrend toward ₹2,400 or lower. Conversely, a strong bounce with volume confirmation could trigger a rally toward ₹3,200-₹3,400.
Reversal Confirmation Levels:
- ₹3,400: Break above would negate the descending channel's lower boundary
- ₹3,800: Reclaim would suggest intermediate trend reversal
- ₹4,200: Breaking this level would confirm the bearish phase is over
Fundamental and Sectoral Backdrop
Company Overview
Business Profile:
Garware Hi-Tech Films Limited is a leading global manufacturer of speciality performance polyester films with fully integrated "chip-to-film" operations. Founded in 1957, the company has transitioned from commodity polyester films to premium, high-margin speciality films.
Core Product Segments:
1. Paint Protection Films (PPF) - Automotive protection against chips and scratches (25% of revenue in Q3 FY26)
2. Sun Control Window Films - For automotive, architectural, and commercial applications
3. BOPET Films - Speciality films for packaging, thermal lamination, insulation
4. Architectural Films - For buildings and commercial spaces
Geographic Presence:
The company exports to over 90 countries across 5 continents, with the USA being the largest market, contributing 77% of revenues. The company has subsidiaries in the USA and the UK to service international clients.
Recent Financial Performance
The Q3 FY26 results (Disappointing) represent the weakest quarterly performance in recent periods, with margins at multi-quarter lows. The 38.87% QoQ profit decline has raised serious concerns about near-term demand dynamics and operational efficiency.
Growth Initiatives and Strategic Developments:
Capacity Expansion:
Paint Protection Film (PPF): The company has doubled its PPF capacity to 60 million square feet by 2026, positioning itself to capture growing demand in the automotive protection segment.
TPU Line: A new Thermoplastic Polyurethane production line is planned for commissioning in October 2026, requiring capex of ₹118 crore.
New Business Initiatives:
Garware Home Solutions: A direct-to-consumer (D2C) platform for architectural films launched with the first studio in Mumbai. This represents a strategic move to tap the domestic consumer market.
UAE Subsidiary: The board approved the establishment of a wholly-owned subsidiary in the UAE to strengthen export capabilities in the MENA region and expand international market presence.
Global Application Studios: Two new studios opened in the Middle East to enhance customer engagement and provide tailored solutions.
Product Launches:
The company introduced four new products in the automotive care segment, though specific details are not publicly disclosed in recent announcements.
Management Guidance and Outlook:
Forward-Looking Targets:
Revenue CAGR: 15-20% for FY26 and beyond
EBITDA Margins: Target range of 22-25%
Export Share: Increase to over 70% of total revenue
Value-Added Products: Aim for 85%+ contribution to overall sales
Strategic Focus Areas:
1. Increasing penetration in the US PPF market, particularly given the opportunity arising from XPEL's supplier realignment
2. Building the Indian PPF market through applicator training and studio expansion
3. Expanding the architectural films business, targeting ₹500 crore revenue within 3 years
4. Growing non-US markets by approximately 20% to reduce geographical concentration risk
Sectoral Context:
Industry Segment:
Garware operates in the Plastic Products - Industrial sector, specifically within the speciality films and packaging segment.
Sector Performance:
The packaging segment has shown moderate strength, gaining 9.07% recently, indicating sectoral tailwinds. However, the speciality films industry faces challenges from:
- Raw material price volatility (petrochemical derivatives linked to crude oil)
- Intense competition from global manufacturers
- Product commoditization in certain segments
- Regulatory changes affecting automotive and architectural applications
Market Position:
Garware is recognized as the world's No.1 vertically integrated "chip-to-film" manufacturing company. In India, it is the only manufacturer of Paint Protection Films, giving it a monopolistic advantage in the domestic market.
The speciality films market is experiencing growth driven by:
- Increasing automotive sales and premiumization
- Growing awareness about vehicle protection
- Rising demand for energy-efficient building solutions
- Expansion of packaging applications
Key Business Risks and Challenges:
US Tariff Impact:
The company faces significant headwinds from increased US tariffs (mentioned as rising to 50% in earnings calls). The PPF segment, contributing 25% of revenues, is most impacted due to high per-unit prices that amplify tariff effects.
Management Strategy: The company is managing this by sharing costs with customers while absorbing portions internally, and exploring supply chain diversification options outside the US.
Geographic Concentration:
With 77% of revenues from exports and the USA being the dominant market, the company faces concentration risk from:
- US economic slowdowns
- Trade policy changes
- Currency fluctuations
- Competitive pressures in key markets
Raw Material Volatility:
As petrochemical derivatives form the raw material base, any sharp increase in crude oil prices can compress gross margins, particularly in the commodity-linked Industrial Products Division (IPD).
Weak Q3 Performance:
The latest quarter showed alarming deterioration:
- Lowest revenue and operating profit in recent quarters
- Margin compression to multi-quarter lows
- Earnings declining 28.70% versus the previous four-quarter average
- Volume and demand pressures across segments
Competitive Advantages:
Vertical Integration:
The complete "chip-to-film" integration provides cost advantages, quality control, and supply chain resilience that competitors lacking this capability cannot match.
Technology Leadership:
Proprietary nano-dispersion technology and continuous R&D investment enable differentiated products with higher margins. The company holds technology leadership in dyed polyester films globally.
Distribution Network:
Established presence in 90+ countries with subsidiaries in key markets (USA, UK) and new expansion in the UAE provides strong distribution capabilities.
Domestic Market Monopoly:
Being India's only PPF manufacturer provides pricing power and first-mover advantage in the rapidly growing domestic automotive protection market.
Strong Balance Sheet:
Zero debt position (as per some reports) provides financial flexibility for growth investments and capacity expansion without leverage concerns.
Recent Stock Price Volatility Drivers:
Upper Circuit Hits:
On February 3, 2026, the stock hit a 20% upper circuit at ₹3,908.6, demonstrating extreme speculative interest. This followed similar sharp moves on January 22 (7.92% surge) and February 1 (8.1% gain), creating a two-day cumulative return of 32.34%. On Back of US-India Trade Deal News
My 2 Cents:
The technical chart tells a story of euphoria followed by harsh reality. The ascending triangle breakout captured optimism around growth initiatives and the US market opportunity, but the subsequent 50% correction reflects deteriorating fundamentals becoming apparent through weak Q3 results. But again Guidance is Strong and Trade Deal is Done.
Critical Questions for Investors:
1. Does the ₹2,600-₹2,800 support a genuine accumulation zone or a temporary pause before further decline?
2. Can management execute the turnaround needed to achieve 22-25% EBITDA margins given current headwinds?
3. Will the tariff situation stabilize or continue pressuring the crucial US market?
4. Are the recent circuit moves indicating smart money accumulation or retail speculation?
Scenarios to Monitor:
Bull Case Scenario:
- Operating margins recover toward 18-19% levels
- New capacity comes online successfully with a strong order book
- Stock holds ₹2,600 support and breaks above ₹3,400 with volume
- Technical pattern shifts from descending channel to ascending structure
Bear Case Scenario:
- Margins remain compressed below 16-17%
- US tariff pressures may intensify, impacting the PPF segment further
- Stock breaks below ₹2,600 support decisively
- Volumes remain elevated on the downside, confirming distribution
Base Case Scenario:
- Consolidation continues in ₹2,600-₹3,400 range for several quarters
- Gradual margin improvement but no sharp recovery
- Mixed quarterly results creating volatility
- Technical pattern remains range-bound until a clear fundamental catalyst emerges
Key Events and Data Points to Watch:
Immediate Term:
- Price action at ₹2,600 support zone - hold or break?
- Volume characteristics during any breakout attempt
- Q4 FY26 results (expected May 2026)
Medium Term:
- TPU line commissioning (October 2026)
- UAE subsidiary operational metrics
- Architectural films segment revenue trajectory toward ₹500 crore target
- Management commentary on US tariff mitigation strategies
Long Term:
- Achievement of 15-20% revenue CAGR guidance
- Margin expansion to 22-25% range
- Export share increasing to 70%+
- Value-added products reaching 85%+ contribution
For New Investors:
The current juncture offers a risk-reward scenario heavily dependent on one's conviction in management's turnaround ability. The technical setup suggests waiting for:
- Decisive break above ₹3,400 with volume for trend reversal confirmation
- Q4 results showing tangible improvement before committing capital
- Stabilization of support at ₹2,600 with multiple successful tests
For Existing Holders:
Those sitting on long-term gains should consider the deteriorating fundamentals seriously. The 38.87% quarterly profit decline and margin compression to multi-quarter lows suggest the worst may not be over. Risk management suggests:
- Partial profit booking at rallies toward ₹3,200-₹3,400
- Strict stop-loss below ₹2,500 to protect capital
- Reassessing holdings post Q4 FY26 results
So, Garware Hi-Tech Films presents a fascinating case study of a fundamentally strong business facing near-term headwinds. The technical chart reflects this dichotomy - a powerful long-term wealth creator now grappling with serious operational challenges.
The ₹2,600-₹2,800 support zone represents a critical decision point. If this level holds with improving fundamentals in Q4, the stock could stage a meaningful recovery. However, failure to defend this support or continued fundamental deterioration could trigger a deeper correction toward ₹2,000 or below.
The company's strategic initiatives (capacity expansion, geographic diversification, D2C platform) are directionally correct, but execution against the backdrop of US tariff pressures and margin compression will determine whether the current support becomes a launchpad or a false floor.
Given the high-risk, high-reward nature of the current setup, investors should approach with caution, maintain strict risk management discipline, and wait for clearer signals - both technical and fundamental - before making significant allocation decisions.
The coming quarter's results and price action at the ₹2,600 level will likely determine whether this speciality films giant can reclaim its former glory or faces an extended period of consolidation and repair.
Full Coverage on my Mid-Week Newsletter coming Wednesday.
Keep in the Watchlist and DOYR.
NO RECO. For Buy/Sell.
📌Thank you for exploring my idea! I hope you found it valuable.
🙏FOLLOW for more
👍BOOST if you found it useful.
✍️COMMENT below with your views.
Meanwhile, check out my other stock ideas on the right side until this trade is activated. I would love your feedback.
As per the Latest SEBI Mandate, this isn't a Trading/Investment RECOMMENDATION nor for Educational Purposes; it is just for Informational purposes only. The chart data used is 3 Months old, as Showing Live Chart Data is not allowed according to the New SEBI Mandate.
Disclaimer: "I am not a SEBI REGISTERED RESEARCH ANALYST AND INVESTMENT ADVISER."
This analysis is intended solely for informational purposes and should not be interpreted as financial advice. It is advisable to consult a qualified financial advisor or conduct thorough research before making investment decisions.  Long
Long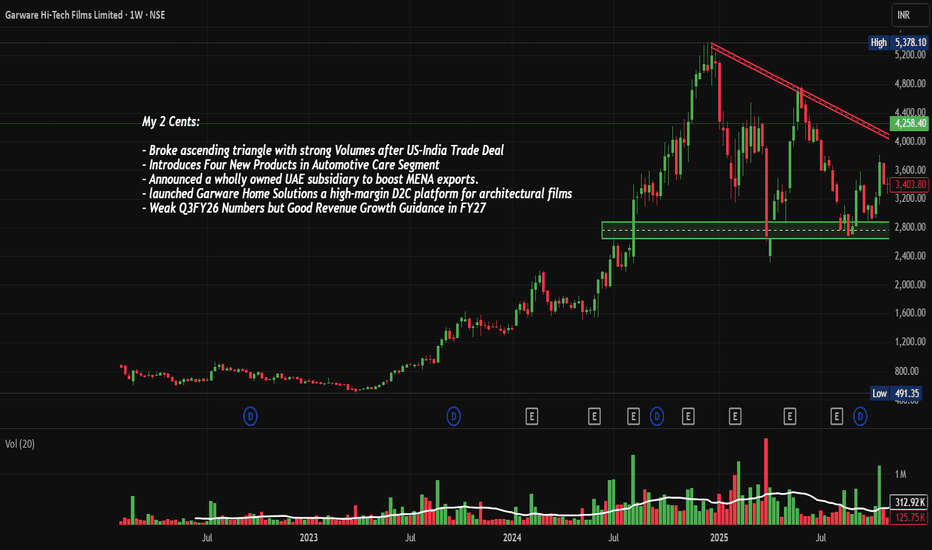
Long 
 Long
Long