Education
SPX GEX - Speculative Call Volume🔶 SPX – Positive GEX Above HVL, 7300 Call Cluster in Focus 🔶
SPX is currently trading in a clearly constructive options structure on the hourly chart.
Based on the Friday GEX profile, price is sitting above the High Volatility Level (HVL), which is currently around 7195. That keeps SPX inside a positive GEX regime, where price action typically becomes more controlled and volatility tends to compress compared to negative gamma conditions.
🔶 Current Options Structure 🔶
For the May 8 expiration, the main levels are clearly defined:
7195 – HVL / regime pivot
7150 – nearest protective put area / strongest put wall
7300 – nearest gamma cluster and strongest call wall
7350 – highest call open interest
The next important upside reference is the 7300 call wall, which currently acts as the closest major call-side positioning level above spot.
🔶 Interesting Flow Signal 🔶
The most interesting part of the profile is the 7425 strike.
That level is far out-of-the-money for a short-dated Friday expiration, yet it is showing the largest call volume on the board. With SPX trading around 7260, this looks like a highly speculative upside call flow.
This does not mean price has to move there, but it clearly shows where some traders are placing aggressive upside bets into the end of the week.
🔶 Macro Catalyst 🔶
One important caveat: NFP is due on Friday.
Non-farm payrolls can easily reset short-term positioning, volatility, and dealer hedging behavior, so the structure should be monitored dynamically.
🔶 Key Structure to Watch 🔶
Above 7195 HVL → positive GEX regime remains active
7300 → nearest call wall / upside reference
7350 → highest call OI
7425 → speculative call volume cluster
7150 → nearest protective put wall
As long as SPX holds above HVL, the structure remains supportive. The main question is whether price can continue rotating toward the 7300 call cluster, or whether the upcoming NFP event disrupts the positive gamma setup. Long 
US 500 - Inflation Risks and Employment Test the RallyThe US 500 index has been on quite a run recently, initially supported by a surge in risk sentiment from the start of April after a ceasefire was agreed between the US-Iran, but perhaps just as importantly by the shift of focus for traders back to a more optimistic stance regarding the impact of artificial intelligence on future corporate revenue after a period of uncertainty.
This up move has primarily been led by a surge in mega technology companies such as Apple, which briefly revisited all-time highs, and Alphabet that spiked to a new record, both after the release of stronger results last week. To put some numbers to it, the US 500 jumped 11% from its lows at 6518 on April 1st up to a record peak of 7277 on May 1st.
Moving forward, things could be trickier to navigate as traders face up to the old adage for stock markets - “sell in May and go away”. For example, tensions in the Middle East briefly ramped up on Monday with the US-Iran exchanging fire, as President Trump attempted to follow through on a weekend commitment to open the flow of Oil shipping from neutral countries through the Strait of Hormuz. This helped the US 500 to briefly drop back to 7178, however prices have since recovered to post new record highs at 7299 this morning after the White House signalled progress being made toward a final agreement between Washington and Tehran (Bloomberg).
The important issue traders are wrestling with seems to be, the longer energy prices stay elevated the greater chance of it feeding higher inflation in the US, an issue that could force the Federal Reserve to hike interest rates, which as a rule can weigh on risk sentiment, economic growth and corporate earnings.
A key component of the Fed decision making process could be the current health of the labour market. While, traders may pay attention to today’s release at 1315 BST of the US ADP private sector payrolls, or the weekly jobless claims update due for release on Thursday at 1330 BST, their key focus may be the latest Non-farm payrolls on Friday at 1330 BST. If this update shows US employment remains resilient it could convince policymakers that there is room to raise interest rates in June to regain control of inflation. A factor that could weigh on the recent US 500 rally, even lead to some profit taking.
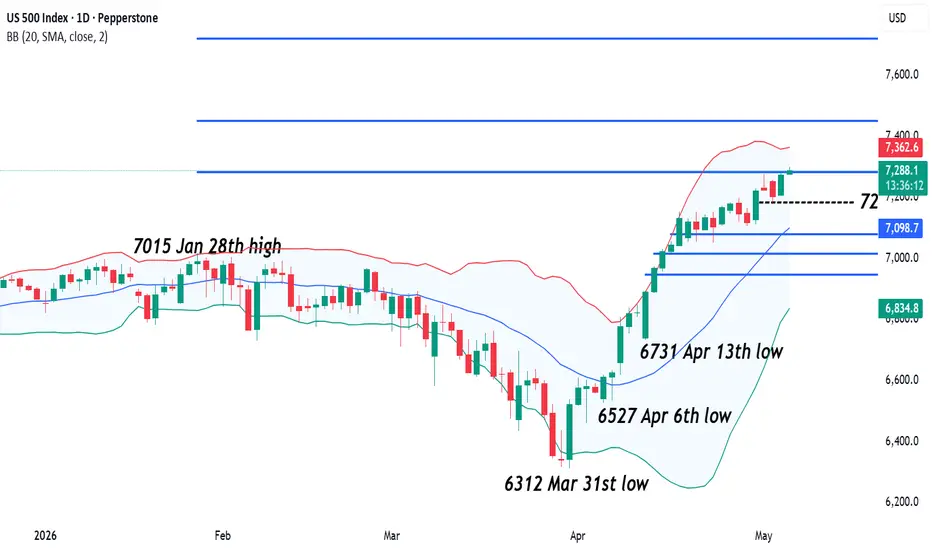
Technical Update: Watching Closing Defence of 7283 Fibonacci Extension Level
When an index pushes into uncharted territory of new all‑time highs, identifying meaningful resistance becomes inherently difficult because there are no historical reference points of previous highs to gauge price activity. In these situations, Fibonacci extension levels can provide a useful framework by projecting potential upside barriers based on prior price swings.
These extensions don’t guarantee where price strength will stall, but they can highlight levels where an advance may slow or even reverse, giving traders a focal point that might otherwise be absent. Being aware of these projected levels can help gauge where upside moves might begin to encounter resistance and where risk‑reward dynamics may shift, or if successful closing upside breaks are seen, when further upside momentum may emerge.
As the chart above shows, the US 500 index continues to find support, and the advance from the 31st March low (6312) has extended into new all‑time highs. However, the latest strength looks to currently be challenging resistance at 7283 (0645 BST), a level that aligns with the 38.2% Fibonacci extension of the January 28th to March 31st decline. How this level is defended on a closing basis could be important in determining the next directional move.
Potential Resistance Levels:
Having recently seen 7283 attempt to cap the latest advance, this level could be a key resistance focus for traders. While not a guarantee of continued strength, closing breaks above 7283 might encourage further attempts to extend the current positive momentum.
If closing breaks above 7283 are seen this week, the focus for traders may then shift toward higher Fibonacci extension levels as the next potential resistance points. This could see attempts to extend the uptrend toward 7450, which is the 61.8% extension, and if this level gives way, even toward 7720, which aligns with the 100% extension.
Potential Support Levels:
It has already been a sustained period of price strength, and it might be argued that over‑extended upside conditions may now be in place. If so, prices could be vulnerable to corrections as a reaction to the latest advance, particularly if the 7283 level continues to hold as resistance on a closing basis. As the chart below shows, the first key support may now stand at 7202, a level equal to half latest price strength. This may be the initial downside focus should weakness begin to develop.
If price weakness materialises after the latest advance, it may be closing breaks below 7202 that prove to be important. Such a move could then open scope for further downside toward 7081, which is the 38.2% retracement of the April 13th to May 6th advance. If 7081 were also to give way, weakness could extend toward 7014, the 50% retracement, and possibly even 6947, which is the 61.8% level.
The material provided here has not been prepared accordance with legal requirements designed to promote the independence of investment research and as such is considered to be a marketing communication. Whilst it is not subject to any prohibition on dealing ahead of the dissemination of investment research, we will not seek to take any advantage before providing it to our clients.
Pepperstone doesn’t represent that the material provided here is accurate, current or complete, and therefore shouldn’t be relied upon as such. The information, whether from a third party or not, isn’t to be considered as a recommendation; or an offer to buy or sell; or the solicitation of an offer to buy or sell any security, financial product or instrument; or to participate in any particular trading strategy. It does not take into account readers’ financial situation or investment objectives. We advise any readers of this content to seek their own advice. Without the approval of Pepperstone, reproduction or redistribution of this information isn’t permitted.
BTC Pushes $81.3K — Bull Regime Day 14, $82K–$84K Zone in SightFourteen bars into the Bull regime. Score 2.5, full alignment — EMA crossover, ADX, RSI momentum, and DI direction all confirming. No wobble, no regime wobble, no character change.
The prior idea flagged $82K–$84K as the next meaningful test after $80K cleared. That zone is now less than 1% away. Price has followed the same staircase structure from $68K throughout - no spike, no blow-off top, just sustained directional pressure with pullbacks that found support and moved on.
What the chart shows
The regime sequence is visible across the full lookback: Bear, a brief Bull attempt in early March that failed and flipped back to Bear, then a Range at the lows while the crowd was calling bottoms, and finally the Bull flip on 21 April. This Bull regime is now 14 bars old with a score holding at the top of the range.
Levels
$80K — former resistance, now the line that needs to hold on any pullback. A daily close back below $79K would start to crack the regime.
$82K–$84K — the zone where sellers showed up during the January breakdown. This is the first real supply test of the current regime.
Bias
Trend-following setups retain the edge while the regime holds. Mean-reversion against this structure has been the losing trade for 14 bars.
Regime track record: Bear → Range → Bull (21 April). Fourteen bars. Unbroken. Long 
Gold – Rate Hike Risks Test Resolve of Dip BuyersGold has been a difficult market to trade in recent weeks, and yesterday’s violent swing which saw a 2.5% drop from opening levels around 4620 to a low of 4501 was perhaps another reminder of why identifying key support and resistance levels can be invaluable to traders. These zones can act as potential directional pivot points and mapping them out in advance could be an essential step before committing to any new position.
Gold volatility, like all the major markets, is being driven by geopolitical events in the Middle East, and yesterday’s drop was in response to the US-Iran exchanging fire after US President Donald Trump promised over the weekend to reopen the Strait of Hormuz to shipping from neutral countries, while also urging China and US allies to provide assistance in making this commitment a reality.
Any escalation in the Iran conflict, keeps energy prices elevated. This fuels inflation concerns, which then increases market expectations for interest rate rises from the world’s major central banks, especially the Federal Reserve who are the most dominant. This negative spiral helps to weighs on Gold which pays no dividend or interest.
One positive for Gold bulls has been that recent falls have been met with safe haven demand and dip buying, perhaps in the hope that global central banks, led by the PBOC in China, may be happy to increase their holdings of Gold after reports last week confirmed that Q1 2026 was a record for central bank purchases. Traders may be watching price action closely to see if this continues in Q2.
Technical Update: Are Risks Developing for Further Declines?
A recent focus for Gold has been its inability to break and close above what was perceived as a potential resistance at 4848, a level equal to the 50% Fibonacci retracement of the January 29th to March 23rd sell-off. As the chart below shows, the failure to break above 4848, has resulted in price weakness and closing breaks below both the Bollinger mid-average (currently 4701) and now the 38.2% Fibonacci retracement level that stood at 4571.
While closing breaks of these types of support levels are not a guarantee of continued price weakness, traders may now be focused on identifying potential support and resistance levels to help judge where the next directional themes may lay.
Potential Resistance Focus:
Gold prices recently broken below support provided by the Bollinger mid-average. This average then turned lower to potentially skew risks towards a downtrend, meaning this may now be the first resistance level to focus on if attempts at a recovery materialise over the course of the week. The Bollinger mid-average currently stands at 4701, and successful upside closing breaks above this level may be required to open a further phase of price strength.
If closing breaks above 4701 are seen, it could open scope for further price gains towards the 50% retracement level which stands at 4848. Closing breaks above 4848 may lead to tests of the higher 61.8% retracement at 5024.
Potential Support Focus:
The latest close below support marked by 4571, which is the 38.2% Fibonacci retracement of the latest recovery, could lead to further price declines and shift the focus for traders toward deeper support levels.
As the chart above shows, this could see risks shift towards support marked by lower retracement levels. The 50% mid-point stands at 4481, which may be the next key support to monitor, although if this in turn was broken on a closing basis, it might suggest further weakness toward 4391, which is the lower 61.8% retracement.
The material provided here has not been prepared accordance with legal requirements designed to promote the independence of investment research and as such is considered to be a marketing communication. Whilst it is not subject to any prohibition on dealing ahead of the dissemination of investment research, we will not seek to take any advantage before providing it to our clients.
Pepperstone doesn’t represent that the material provided here is accurate, current or complete, and therefore shouldn’t be relied upon as such. The information, whether from a third party or not, isn’t to be considered as a recommendation; or an offer to buy or sell; or the solicitation of an offer to buy or sell any security, financial product or instrument; or to participate in any particular trading strategy. It does not take into account readers’ financial situation or investment objectives. We advise any readers of this content to seek their own advice. Without the approval of Pepperstone, reproduction or redistribution of this information isn’t permitted.
 Long
Long
 Short
Short
BTC Tests $80K — Bull Regime Day 13, UnbrokenBitcoin printed an intraday high of $80,605 today — the first touch above $80K since the January breakdown. Bull regime is now 13 bars deep on the daily with full trend score alignment at 2.5.
The regime timeline tells the story:
Late March: selling exhausted, ADX dropped below threshold, regime shifted from Bear to Range. Price chopped between $65K–$68K with no conviction in either direction.
Mid-April: Range gave way to a series of rapid regime flips — Bull, Bear, Bull — as the market tested direction. This is typical transition behaviour before a trend takes hold.
21 April onward: Bull regime locked in and hasn't broken since. Thirteen consecutive bars of green background on the chart. Price has ground from $68K to $80K in a staircase pattern — no vertical spike, no blow-off candle, just steady accumulation.
Why this matters structurally
Thirteen bars of unbroken regime is significant. Short-lived regimes (2–4 bars) often represent noise. Once a regime holds beyond 10 bars, it reflects genuine alignment across trend, momentum, and directional strength, not just a short-term impulse.
The $80K level
Today's candle touched $80,605 before pulling back. The daily close will be important. A close above $80K opens the path toward $82K–$84K — the zone where the January selloff accelerated. That's where the next meaningful supply sits.
A rejection here and close back below $79K would suggest $80K needs more work. Not a regime break — just a failed first attempt at a round number, which is common.
What shifts the view
The regime flips to Range if ADX drops below threshold — that would mean trend strength has faded and the grind is running out of steam. A close below $76K would likely trigger that shift. Until then, the regime favours trend-following over mean-reversion.
This is the third idea tracking this regime. The prior two called the Bear → Range → Bull transition and the $78.5K breakout. Both played out. The regime framework continues to hold.
This analysis uses the Bitcoin Market Regime Detector indicator (open-source, linked on my profile).
Not financial advice. Regime classification is a framework for strategy selection, not a standalone signal. Long 
 Long
Long
 Long
Long
BTC Breaks $78.5K Resistance — Bull Regime Day 10BTC has cleared the $78.5K resistance that has capped price for the past two weeks. Bull regime now at 10 bars on the daily, full trend score alignment at 2.5.
The setup coming into today:
Bear regime dominated March — EMAs stacked bearish, momentum confirming sellers in control. Price fell from $94K to the $58K–$60K lows.
Late March, ADX dropped below threshold as selling exhausted. Regime shifted to Range. Price chopped between $65K–$68K with no directional conviction.
Early April saw a brief Bull/Bear cycle as the market tested direction. Regime flipped Bull → Bear → Bull again in quick succession — classic transition behaviour before a trend establishes.
The current Bull regime started around 21 April and has held for 10 consecutive bars. Unlike the choppy early-April flips, this one has been clean — steady grind from $68K through $74K, $76K, and now $78.5K with no regime wobble.
Why $78.5K matters:
This level has acted as a ceiling since mid-April. Today's daily candle is printing +3% and trading above it. If the daily close holds above $78.5K, the next area of interest is the $80K psychological level and then $82K–$84K where sellers stepped in during the January breakdown.
What the regime tells you:
10 bars of unbroken Bull with maximum score alignment means trend, momentum, and directional strength are all pointing the same way. This is not a signal to chase — it's a signal that the environment favours trend-following setups over mean-reversion.
The playbook while Bull holds:
Favour long entries on pullbacks
Breakout trades have a structural edge
Mean-reversion shorts are fighting the regime
What would change the view:
A daily close back below $76K would weaken the trend score. If ADX drops below threshold, the regime flips to Range and the playbook shifts to neutral. Until then, no reason to fight the direction.
This analysis uses the Bitcoin Market Regime Detector indicator (open-source, linked on my profile).
Not financial advice. Regime classification is a framework for strategy selection, not a standalone signal. Long 
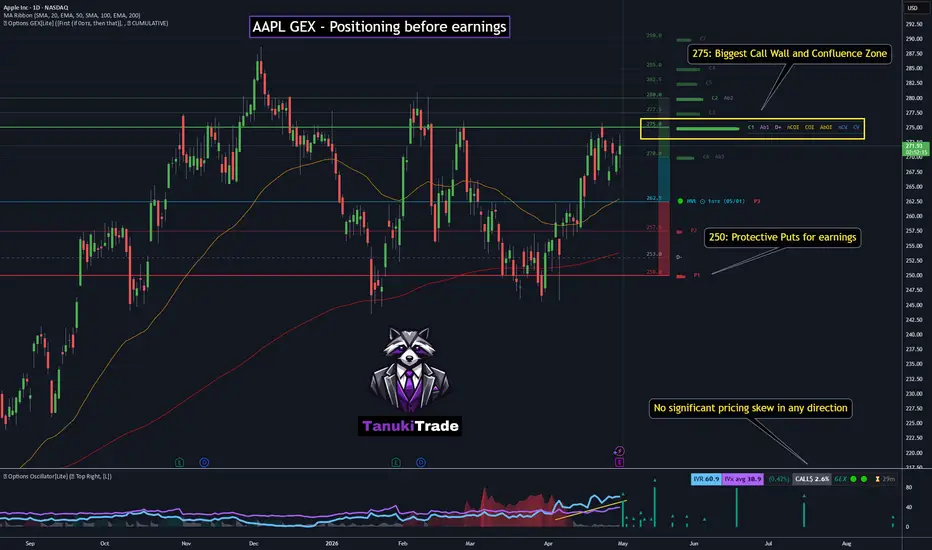
AAPL GEX - Positioning before earningsApple reports after the close today, and the options structure is getting interesting.
For tomorrow’s expiration, the main level on the TanukiTrade GEX profile is very clear: AAPL 275 is the key call-side cluster.
This is not just the primary call wall. It is also a major multi-confluence level, with several secondary metrics stacking in the same area: highest positive GEX, highest absolute gamma concentration, strongest call open interest, highest absolute open interest, strongest call volume today, and the strongest positive delta exposure.
In other words, a lot of the pre-earnings options activity is currently concentrating around the 275 strike.
What also stands out is that the structure extends from around 275 to 280, with C2 and C3 sitting just above it. So rather than one isolated strike, this looks more like a call-side gamma cluster above current price.
Spot is also trading well above the HVL, which means Apple is currently positioned in the upper part of the structure, not near the lower volatility pivot. On the downside, the first major protective put level is much lower, around 250, where P1 is currently showing up.
The detailed volume profile is telling a similar story: today’s flow is heavily tilted toward the call side ahead of earnings. That does not mean it has to resolve higher — earnings can obviously reset the entire structure overnight — but it does show where traders are currently focusing their speculative positioning.
Looking at the Options Oscillator, it shows no clear pricing skew in any direction based on options pricing for May 1 expiration. Oil (WTI) – Fresh Fears of Iran Conflict Escalation DominateOil (WTI) prices surged over 8% yesterday to 3-week highs above 110. The volatile price action was first driven by President Trump’s decision not to lift the US naval blockade of Iran’s ports, rejecting a proposal from Tehran to reopen the all-important shipping lane through the Strait of Hormuz in the process.
Then, more significantly American news website Axios reported that US miliary commanders have prepared a plan for a short and powerful wave of strikes across Iran to raise pressure on the regime. Perhaps unsurprisingly, this sent a shockwave across energy markets and helped Oil to extend its up move to a 3-week high of 113.288 earlier this morning, before edging back down to 111.42 at the time of writing (0645 BST).
Suddenly, after several weeks of relative calm where it was hoped, the ceasefire could lead to an eventual peace deal, it has potentially been flipped on its head and a military escalation to the conflict could be moving closer to a reality. Looking forward, traders may now be waiting on the next steps from the US administration. It has been reported President Trump is to be briefed later today by the Head of US Central Command and the actions following this meeting could be critical to whether Oil prices push toward the March high at 119.45 or reverse back to lower levels.
Technical Update: Recent Price Strength Still Has to Overcome Resistance Levels
Since Oil (WTI) accelerated sharply higher on March 9th to post a high of 119.450, price action, while certainly volatile, has broadly settled into a more balanced phase. As the chart below shows, this has formed a wide but clearly defined range, contained between the March peak at 119.450 and the 82.599 low posted on April 17th. This broad consolidation frames the key boundaries that traders may need to monitor moving into the weekend.
Given the relatively wide range, due to the elevated volatility, there may still be scope for price swings, even if they remain contained within the broader consolidation. In this environment, it may be useful to track the intermediate support and resistance levels inside the broader range to gauge shorter‑term directional potential. These internal reference points could help determine near‑term directional price themes, while the market continues to oscillate between the broader 119.450 and 82.599 boundaries.
Potential Resistance Levels:
In the short-term traders may be focused on the latest April 30th high at 113.288 as the first possible resistance. Recent attempts at strength have been held by this level, leading to a setback this morning, suggesting sellers could emerge here again. As a result, it could be useful to monitor how this level is defended on a closing basis to determine the near‑term directional bias.
As the chart above shows, a closing break above 113.288 could shift attention toward higher resistance levels. Such a move may open scope for tests of 117.896, the April 7th high, and potentially the March 9th extreme at 119.450. However, as noted earlier, it’s possible that only closes above 119.450 could suggest an upside break from the broader range.
Potential Support Levels:
While current price action may suggest the April 17th low at 82.599 continues to define the lower boundary of the broad sideways range, there are shorter‑term supports that may be worth considering. The first of these could be 106.039, which is equal to half Wednesday’s range. Closing breaks below 106.039 could increase the risk of further price declines. If weakness extends, attention could then shift to 101.575, which is the 38.2% Fibonacci retracement of the latest recovery.
A closing break below 101.575 might increase the risk of further downside pressure, exposing the next support at 97.957, which is the 50% Fibonacci retracement. If that level fails, focus could then even shift to the deeper 94.340 support, equal to the 61.8% retracement.
The material provided here has not been prepared accordance with legal requirements designed to promote the independence of investment research and as such is considered to be a marketing communication. Whilst it is not subject to any prohibition on dealing ahead of the dissemination of investment research, we will not seek to take any advantage before providing it to our clients.
Pepperstone doesn’t represent that the material provided here is accurate, current or complete, and therefore shouldn’t be relied upon as such. The information, whether from a third party or not, isn’t to be considered as a recommendation; or an offer to buy or sell; or the solicitation of an offer to buy or sell any security, financial product or instrument; or to participate in any particular trading strategy. It does not take into account readers’ financial situation or investment objectives. We advise any readers of this content to seek their own advice. Without the approval of Pepperstone, reproduction or redistribution of this information isn’t permitted.
Treasury Yields May Face UpsideU.S. Treasury yields climbed sharply in March. Now, after a period of consolidation, some traders may see further upside in the key 10-year rate.
The first pattern on today’s chart is the series of lower highs in the past month. TNX has pushed above that falling trendline, which may suggest its short-term decline is ending.
Second, yields held a 50 percent retracement of March’s surge. That may also be consistent with upward movement in yield.
Third, the 50-day simple moving average (SMA) had a “golden cross” above the 200-day SMA. That may reflect a longer-term uptrend.
Next, Bollinger Band Width recently squeezed to a three-month low. Could that compression give rise to a period of increased movement?
Finally, there may be catalysts for yields going forward with today’s Federal Reserve meeting and potential upward movement in energy prices.
TradeStation has, for decades, advanced the trading industry, providing access to stocks, options and futures. If you're born to trade, we could be for you. Learn more here about TradingView’s Broker of the Year!
Past performance, whether actual or indicated by historical tests of strategies, is no guarantee of future performance or success. There is a possibility that you may sustain a loss equal to or greater than your entire investment regardless of which asset class you trade (equities, options or futures); therefore, you should not invest or risk money that you cannot afford to lose. Online trading is not suitable for all investors. View the document titled Characteristics and Risks of Standardized Options at www.TradeStation.com . Before trading any asset class, customers must read the relevant risk disclosure statements on www.TradeStation.com . System access and trade placement and execution may be delayed or fail due to market volatility and volume, quote delays, system and software errors, Internet traffic, outages and other factors.
Securities and futures trading is offered to self-directed customers by TradeStation Securities, Inc., a broker-dealer registered with the Securities and Exchange Commission and a futures commission merchant licensed with the Commodity Futures Trading Commission). TradeStation Securities is a member of the Financial Industry Regulatory Authority, the National Futures Association, and a number of exchanges.
TradeStation Securities, Inc. and TradeStation Technologies, Inc. are each wholly owned subsidiaries of TradeStation Group, Inc., both operating, and providing products and services, under the TradeStation brand and trademark. When applying for, or purchasing, accounts, subscriptions, products and services, it is important that you know which company you will be dealing with. Visit www.TradeStation.com for further important information explaining what this means. Long 
ARM – Breakout Above 180 Triggers Gamma Squeeze🔶 ARM – Breakout Above 180 Triggers Gamma Squeeze, Extension Toward 200–220 🔶
ARM has now delivered the exact scenario we were watching.
Two days ago, we highlighted the repeated rejections at the 180 level (C1), noting that continued tests could eventually lead to a breakout. That level has now been cleanly broken, and the reaction was immediate — a classic gamma squeeze.
🔶 Context 🔶
The 180 level was not just a technical resistance, but the largest call GEX concentration, acting as a major positioning barrier.
👉 Once cleared, dealer hedging dynamics flipped:
Short calls forced hedging via underlying buying
Momentum accelerated as price moved into lower resistance territory
This is the textbook definition of a call-side gamma squeeze.
🔶 Current Structure 🔶
With 180 now cleared, price has entered a positive gamma extension zone.
Key levels:
200 – largest call wall, highest absolute GEX and open interest 🟢
220 – upper extension zone / next potential upside area 🟢
The 200 level now becomes the primary upside magnet, as it represents the next major concentration of positioning.
🔶 What Changed 🔶
Rejection zone → acceptance above C1
Contained rotation → directional expansion
Resistance → acceleration trigger
🔶 Reference 🔶
Original idea (2 days ago):
ARM has now transitioned from a repeated rejection setup into a full gamma-driven expansion phase.