Volume Indicator
Reliance: Beyond technical analysis Today earnings of Reliance industries were declared. It is very clear that the bottom-line of business took a good hit.
Now, RIL has issued the right issue. Here is my look at how as an investor you should look at it.
The right issue will technically reduce your ownership if you don't participate in the right issue. I think one can sell RIL from current level and add them back at around Rs 1260. You can use this profit to buy more shares. (In this case around 15%)
Why 1260?
There is a gap that will be filled by RIL in the near term & personally I have a bearish view on Reliance Industries for short term
Supporting points:
->Low delivery Volume: 28.47% as on 30 April 2020
->Heavy put writing: 1600 OI -> 1,118,000 with a significant increase in OI
1500 OI -> 1,163,000
->Siginificant rally in short term may lead to profit booking.
->After the right issue most of the stocks face heavy selling. (Personal Opinion)
Bollinger Bands + Volume
I have combined Volume with Bollinger bands to show a significant increase in volume. This states that Big/Smart money is present here.
Support/Resistance
I have used Fractals to identify S/R
Interesting twists, who is taking action and why?There is lot of twists herein:
By the looking left to right , while breaking out the price Congestion we have seen Invalid breakout in price. That why price suddenly fall.
Bullish forget of 3 candles was completely perfec t but, again we have seen valid heavy volume candle ...! Something is cooking in this stock.
Let look more closer to the 4hrs chart.
Very interesting:-
Who is selling?
Why selling?
Insider created fake break-up?
Investors will wait for new New low...!
War begin s between buyers and sellers:
Support has been already taken and price tries to move toward the control price.
E
PC JEWELLER ENJOY THE PROFITSHI TRADERS THIS IS MY 3RD ANALYSIS AS PER ME PC JEWELLERS ARE BREAKS THE RESITANCE AND CAME DOWN . IT IS BREAKS AGAIN GO FOR LONG
WAIT UNTILL RESITANCE BREAK . RISKY TRADERS GO LONG . THIS IS PURLY MY OPENION NOT FOR ADVICE . THIS IS FOR EDUCATIONAL PURPOSE ONLY FINAL DECISION IS YOURS .
IOB - Ready to take off?For a year, the stock has been trying to break out the current resistance umpteen times. Yesterday huge volumes were witnessed with a positive indication on MACD & RSI.
Buy above 29
SL - 28.35
Tgt1 - 32 ( 10 % )
Please provide your valuable feedback which would help me improve my ideas each time.
Mindtree classical Channel breakout !My experience tells that simple classical patterns work mostly and reward good, therefore, I am suggesting today a very Simple Channel breakout long trade setup. It does not require any explanation however, if there is any query please post it in comments.
MLong
BEL INTRADAY BUYBEL has been a very broad range and going nowwhere but yesterdays close had a bit of volume in it. Tomorrow if BEL crosses 182.80-182.90 levels with good volume and RSI crossing to above 70 levels im going to buy it for targets of 183.95-184.40.
Stops will be at the breakout candle low. If the trade risk reward ratio is uncomfortable its better not to trade it or trade as per your own risk appetite.
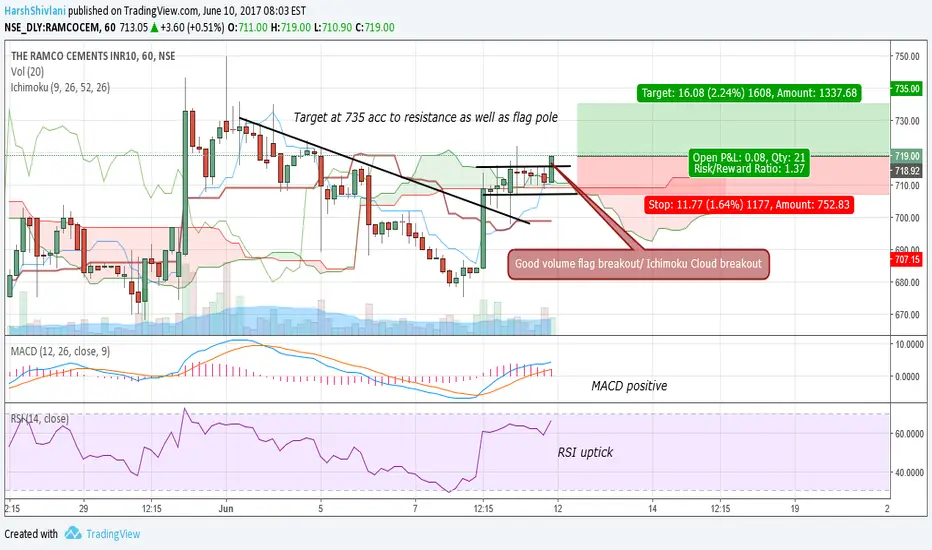
Dhampur Sugar Flag breakoout !The stock has formed a good pole and flag part with decreasing volume : showing the accumulation happened and gave breakout yesterday with good volume. All this make it a perfect Flag(Pennant) pattern to take advantage of. Entry best possible rate, Stop Loss 228, Target 255.
Marksans Pharma Pennant Breakout or Trap?I like to trade Flag(Pennant) pattern simply because it is relative smaller pattern so the holding period is less and risk to reward is mostly good. I've detected another pattern which looks promising as formed correctly fulfilling all the criteria. My only concern is its closing at the lower side forming a wick on double top zone. Is it an opportunity to enter cheap or a trap of a Supply Zone? Still I would take chance as small stop loss is affordable to me.
I would like to hear your views in this situation, please provide your valuable comments. Thanks!
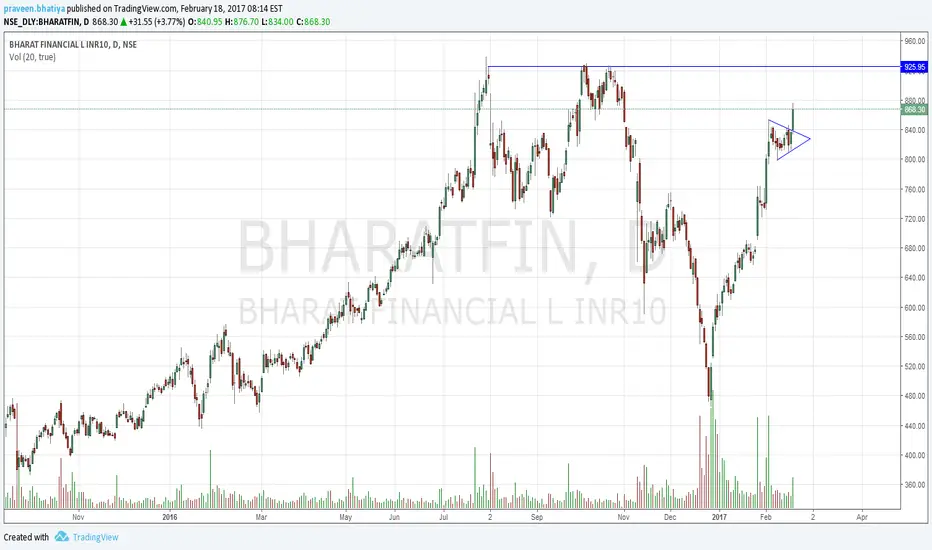
Bharat financial Buy Pennant BreakoutThe stock is clearly in Bull's hand moving vertically. Pennant pattern has given breakout yesterday with increased volume. It looks very promising for trading as well as investing. Traders can book profit around previous High approx 925 by providing SL 840. Investor can expect at least 25% capital appreciation for their patience.
BLong
GSPL Long Flag Breakout Flag pattern gave breakout today with good volume so one can consider buying the stock for the target of 168 - 174. Stop Loss 152 on closing basis.
GLong
Flag breakout Buy Prakash IndustriesThe stock moving vertically after giving the triangle breakout and formed a beautiful pole. The Flag pattern has given breakout with good volume after 5 days of consolidation. One can buy the stock for a target of above 75. One can even continue the stock as there is no resistance. Flags with upward breakouts do well at yearly high which is the case here.
DLF Long entry breakout !The stock was in downtrend but it seems there was good accumulation and it is going up. The stock formed a good pole and flag. It is at good entry point now. One can buy it now or on dips wherever he feels the Stop loss at 122( on closing basis) is affordable. Potential Flag target in the range of 136 - 145.