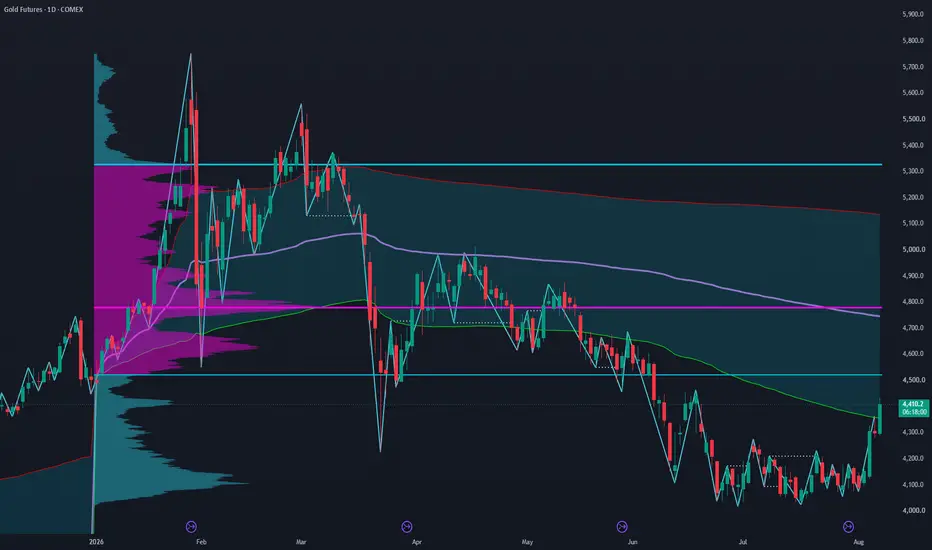
Gold Futures (GC): Daily Structure Suggests a Bottom Is In
Gold futures have spent the last several weeks carving out what looks like a genuine change of character on the daily chart, and price action over the last few sessions has confirmed it. Here's the structural read and what I'm watching next.
Market structure shift
Since the swing high in the 5,300–5,600 area earlier this year, GC has been in a clean sequence of lower highs and lower lows, with the decline accelerating into the 4,000–4,100 zone in July. That's where the character started to change.
The key event was a displacement through the last major lower high. Instead of the usual grinding rally that gets sold back into the range, price broke above the prior swing high with real momentum - the kind of move that shows aggressive buyers stepping in rather than short-covering drift. That displacement is what flips the daily structure from bearish to constructively bullish.
Just as important: the low that formed alongside that shift has now been protected for roughly 33 trading days. Every pullback since has held above it, which tells me sellers haven't been able to reclaim control even after the initial breakout momentum faded. A single higher low isn't proof of anything on its own, but one that survives multiple retests over a month starts to look like actual support, not a random print.
Put together: a displaced lower high plus a protected low - this is a textbook bullish market structure shift on the daily timeframe.
Where price is now:
GC has pushed back up into the first standard deviation band of the anchored VWAP, which is typically the first real resistance test after a structure shift like this. How price behaves here matters: a clean acceptance above the band supports continuation, while repeated rejection would be the first sign the move needs more time to consolidate before it can extend.
Targets: VWAP and yearly POC:
With the low now protected and structure bullish, the next two logical draws on liquidity are:
1. Anchored VWAP: the mean-reversion magnet price has been trading below since the decline began
2. Yearly volume profile POC (Point of Control): the price level with the heaviest traded volume over the past year, sitting well above current price and acting as a natural high-volume node for price to gravitate toward
Both levels represent areas where a large amount of prior business was transacted, which is exactly the kind of level a structurally bullish market tends to seek out once it starts trending.
The obstacle in between:
Before either target comes into play, price has to deal with the volume profile Value Area Low (VAL). This is the lower boundary of where 70% of volume traded over the reference period, and it often acts as short-term resistance on the first test - it's essentially the "floor of business" from the prior range, now being tested from below.
My expectation is that this level gets tested and ultimately breached, rather than holding as a hard ceiling. As long as the higher-low structure remains intact on any pullback into or through this zone, the broader bullish read stays valid. A breach of VAL followed by continued higher lows would be a strong confirmation signal on the way toward VWAP and the yearly POC.
What would invalidate this idea
Structure-based ideas live and die by the structure itself. If price closes back below the protected low that's held for the last 33 days, the bullish shift is broken and the picture reverts to "still building a base" rather than "trending higher." Watching how price handles VAL and the VWAP first SD band in the meantime will give the earliest clues either way.
This is a technical/structural analysis for educational discussion, not financial advice. Futures trading involves substantial risk of loss and is not suitable for all investors. Always do your own research and manage risk according to your own plan.
 Long
Long