Amazing swing trade idea on Affle on Weekly Time frameI daily make educational content videos for swing / positional trading Long05:33by Apoorv-Dubey_SEBI-RA414
MGL : Exciting Bullish Pattern Alert Exciting Bullish Pattern Alert! 📊 Pattern: Broadening Pattern 📌 Symbol/Asset: MGL 🔍 Description: Stock is about ti give breakout. If stock gives breakout then we can expect momentum after breakout. If resistance is not crossed then we can see fall upto support levels. 👉 Disclosure: We are not SEBI registered analysts, this is not a buy or sell recommendation. Technical patterns are just one piece of the puzzle. Consider conducting further research, consulting with a financial advisor, aLongby FiveCircles17
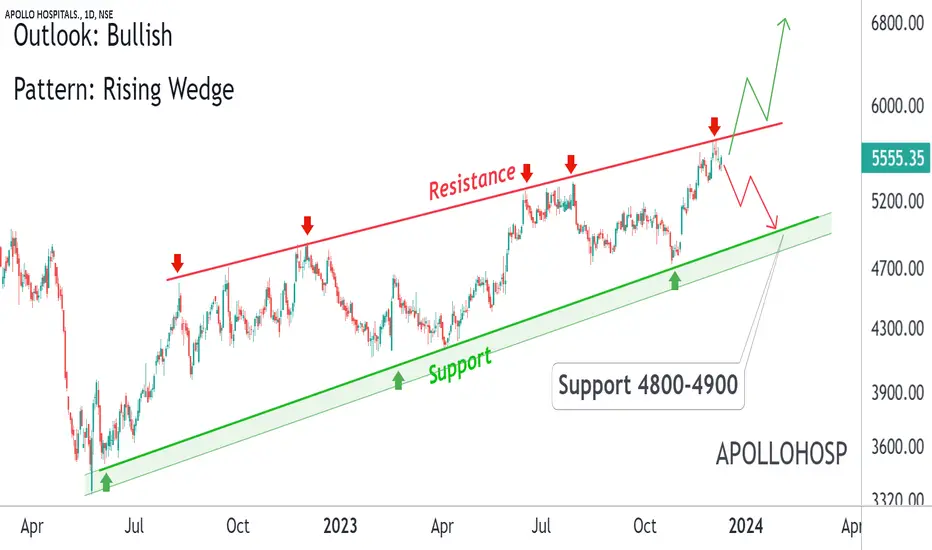
Apollo Hospital : Very Bullish Pattern Exciting Bullish Pattern Alert! 📊 Pattern: Rising Wedge 📌 Symbol/Asset: APOLLOHOSP 🔍 Description: Stock is in a rising wedge. We can see downside if resistance is intact. And stock can come towards 4800-4900 Or If stock gives breakout then we see huge momentum on the upside. 👉 Disclosure: We are not SEBI registered analysts, this is not a buy or sell recommendation. Shortby FiveCircles6
USDCAD LONGthis trade was taken for a long as soon as it passed the first break-out zone that was fixed by looking at the support and resistance zones that were set and once the target zone was crossed the force that it went was so fast that it hit the resistance zone in no time but what was predicted that it would cross the resistance zone and shoot out bullish didn't happen so had to take profit Mistakes to be corrected : entered in the middle of the trade by missing the trade alerts and set upLongby JasonGagarin0
Amazing swing trade idea for 6 December Markets I daily make educational content videos for swing / positional trading Long05:34by Apoorv-Dubey_SEBI-RA319
IGL : Super Bullish PatternExciting Bullish Pattern Alert! 🐂 📊 Pattern: Hut Pattern 📌 Symbol/Asset: IGL 🔍 Description: Stock is around the support. We can see huge bounce from hereon. 350-370 is the strong multi year support. 👉 Disclosure: We are not SEBI registered analysts, this is not a buy or sell recommendation. Longby FiveCircles218
Asian Paints : Multibagger Stock AnalysisAsian Paints is in a consolidation since 2 years. Pattern formation : Symmetric Triangle. Stock has corrected almost 25% from its highs. Support Area is coming around 2850-2900 Targets are coming around 4750-4800 Long03:09by FiveCircles3
Inverted Head & Shoulder BO in ChemplastBreakout of Inverted Head & Shoulder completed on Daily Time Frame. Long Position can be initiated. Stop Loss for the Long Position will be 475 on Weekly Closing Basis.Longby raigvivekUpdated 6
Borosil Renewal trading Near asupport with Double BottomCurrent Price is ~441 Currently trading near support levels. It is also forming W Pattern after recent down trend and now it may start upside move soon.Longby Aishwarya_Jain0
2 amazing swing trade ideas for 28 November markets I daily make educational content videos for swing / positional trading Long09:49by Apoorv-Dubey_SEBI-RA23
📈 Exciting Bullish Pattern Alert! 🐂📈 Exciting Bullish Pattern Alert! 🐂 📊 Pattern: Head & Shoulder 📌 Symbol/Asset: LALPATHLAB 🔍 Description: Stock has given a breakout of Head & Shoulder pattern and now retested the neck line. So its very likely stock will bounce from the neck line and we cann see momentum on the upside !!! 👉 Disclosure: We are not SEBI registered analysts, this is not a buy or sell recommendation. Technical patterns are just one piece of the puzzle. Consider conducting further research, consulting with a finaLongby FiveCircles4
Amazing swing trading idea for 23 November Markets I daily make educational content videos for swing / positional trading Long04:54by Apoorv-Dubey_SEBI-RA620
Amazing swing trading idea for 22 November Markets I daily make educational content videos for swing / positional trading Long08:21by Apoorv-Dubey_SEBI-RA429
📈 Exciting Bullish Pattern Alert! 🐂📈 Exciting Bullish Pattern Alert! 🐂 📊 Pattern: Brodening Pattern 📌 Symbol/Asset: OBEROIRLTY 🔍 Description: Stock has given the breakout of pattern. We can see huge upside from here on 👉 Disclosure: We are not SEBI registered analysts, this is not a buy or sell recommendation. Longby FiveCircles4
2 Amazing swing trade ideas for 3 November markets I daily make educational content videos for swing / positional trading Long04:57by Apoorv-Dubey_SEBI-RA321
Amazing swing trade idea on Cdsl for 1 November Markets I daily make educational content videos for swing / positional trading Long06:49by Apoorv-Dubey_SEBI-RA235
PRISM Johnson : Breakout Candidate Weekly Chart#prsmjohnsn #flagpattern #breakout Prism Johnson (Weekly) : Breakout Candidate >> Short term (1-3 Months) >> Good Consolidation after a Impulsive Move >> Flag Structure Visible, Breakout will give Good Upmove >> Good Weekly Volumes Spurt >> Good Strength Swing Traders can lock 10% profit & keep trailing Please Like or comment if u r Liking the analysis & Learning from it. Keep showing ur Love Disclaimer : This is not a Trade Recommendations & Charts/ stocks Mentioned are for Learning/EducLongby moneyfesttrading1
Amazing swing trade idea for 25 october markets I daily make educational content video for swing / positional trading Long04:16by Apoorv-Dubey_SEBI-RA219
3 Amazing swing trade ideas for 16 October markets I daily make educational content videos for swing / positional trading Long04:57by Apoorv-Dubey_SEBI-RA420
MONTECARLO - Reversal PatternDAILY CHART ANALYSIS OF NSE:MONTECARLO The Diamond Bottom pattern, also known as the Diamond Reversal pattern , is a technical chart pattern frequently used in technical analysis to identify potential trend reversals in financial markets, such as stocks, forex, and commodities. It is a rare pattern and is considered a reversal pattern, indicating a potential change in the direction of the prevailing trend. Here are the key characteristics of the Diamond Bottom pattern: Formation: Theby hardeepssethi0
BankNifty Monthly Expiry Trade PlanBankNifty Monthly Expiry Trade Plan Banknifty following a channel. either side breakout of this channel will initiate trending moveby mayureshk900
Bearish flag pattern in BNA bearish flag pattern can be seen in BN ~ Seller me take control from here but still buyers are trying uphold the price ~ Buyers at 400 & 300 level are taking support if that breaks with momentum candle that a active sellers ~ Also trenline support can make bounce towards days high. ~ Wait n watch for a good oppourtunity to enter. Note : Do your own analyisi before making any trading or investment by Price_actiontaker140
2 Amazing swing trade ideas for 12 Sep Markets I daily make educational content videos for swing / positional trading Long05:53by Apoorv-Dubey_SEBI-RA17
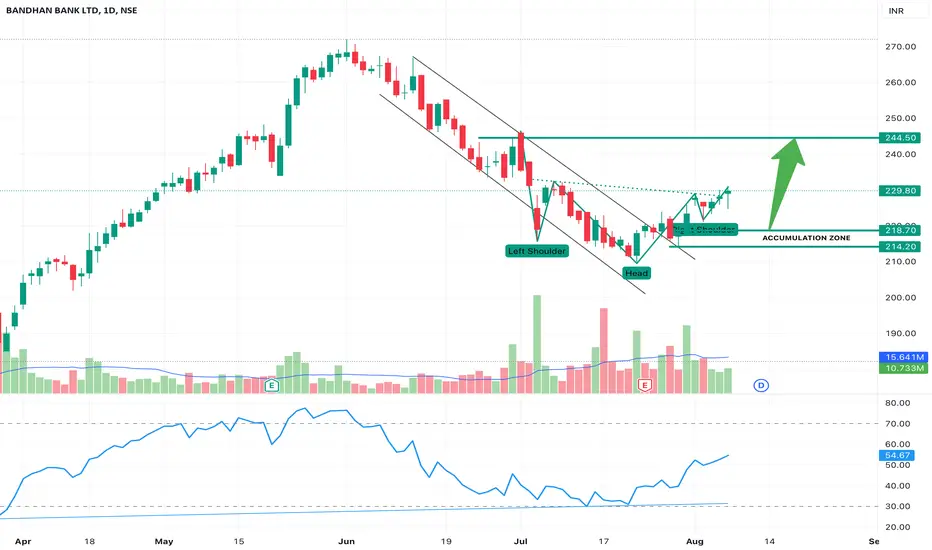
Bandhan Bank - Head and Shoulders Bottom"Head and Shoulders Bottom" or "Inverse Head and Shoulders" pattern formation on daily chart of BANDHANBNK. This pattern is often used by traders to identify potential trend reversals in financial markets, particularly in stocks. The pattern indicates a shift from a downtrend to an uptrend. Here's a breakdown of the pattern: Downtrend and Accumulation: The pattern typically forms after a prolonged downtrend. During this period, the price reaches a bottom and starts to consolidate, formiby hardeepssethiUpdated 5
 LongLong
 Long
 Short

 Long
 Long
 Long
 Long
 Long
 Long
 Long
 Long
 Long
 Long
 Long
 Long
 Long
 LongLong
 Long


 Long