Realtime example of TAIL trade on TATASTEEL4 tails at the value high with one excess and 2 tails found at the value low with one excess. The presently fromed tail is not at excess but its a breakdown channel.
Remarkable points , recently created tail has enough shadow as comparted all others.
Therefore, Possible to fall more OR create a series of tails .
W-pattern
STEEM/BTC good accumulation zone in last support areaSounds awesome and horrific in the same time eh..
just looking into steem/btc chart moving closer in the edge of descending triangle.
interesting what will happen..
from indicators seems oversold in daily RSI and stochastic RSI
and bullish divergence is sighted within MACD and Price action...
awesome.. but keep in mind this asset didnt have big liquidity as this asset have less than 15 usd million which easily get manipulated in price. but if it so, the price most being pump rather than b
S
ICICI Bank - White Swan - HarmonicsICICI Bank is forming a bullish white swan on the 30 min charts, and is expected to hit 352, before bouncing off to 370+
A good options trade can be taken on this basis, on the Jan'19 series.
.
.
.
.
.
.
.
.
.
Kindly consult your advisor before taking any decisions. We teach, and practice what we teach ;)
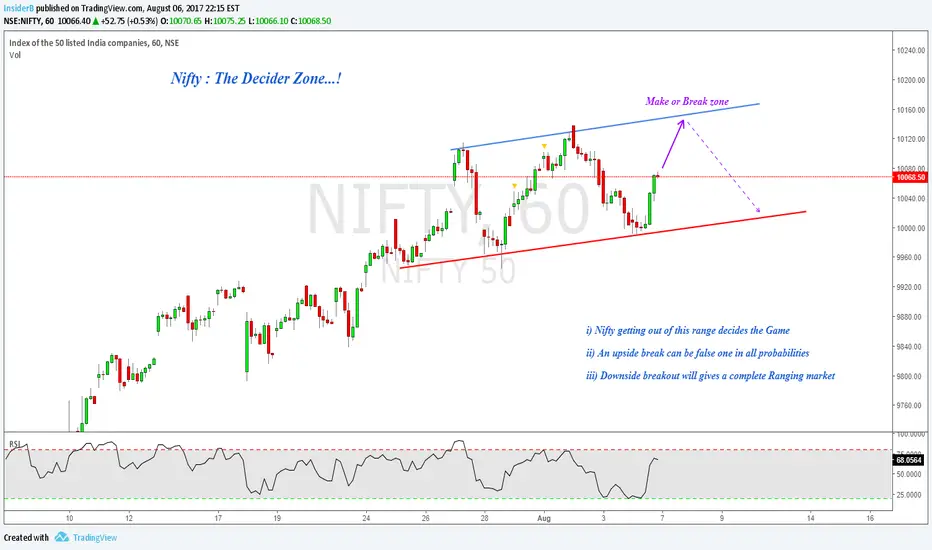
Nifty: The Investment PointsHi All,
The Investment Points:
It can be observed from this weekly chart that in the bear markets of 2011 and 2015, the Index formed bottoms near 200 EMA. Those yellow circled marked on the chart proved to be excellent buying/investment opportunities. If I have to load my money for greatest investments, it will be at the same point.
Nifty Took Support yeah...
Nifty took support from the 9950-10500 zone mentioned in my previous post. It bounced sharply for a gain of 600 points and still
Titan - Clear Head & Shoulder setupTitan has made perfect Head & Shoulder pattern on weekly charts and now breaking down from neckline support while volumes are jumping upwards, during the formation of H&S also one can see that with every fall volumes gone up while on green days volumes were comparatively lesser, this is perfect example of a neat H&S setup,
So as it is now breaking down below Neckline support so a good time to take short position and can trail sl with 100 Day EMA which is currently around 838.
Based on the de
AMARA RAJA BATTERY SHORTSell Amara Raja battery around 800
Target price 775
Strictly positional basis target
Trade as per risk appetite
Happy Trading
AShort
ZUARI GLOBAL LONGBuy Zuari Global at 218
Target price of 249
Long build up seen is yesterday's session. I expect a big move from charts
ZLong
Potential Consolidation BreakoutUnitech Ltd. is in a consolidation for a long time now. A triangle pattern called 'Descending Triangle Pattern' is forming on the 4 Hour time frame. Although, the text book definition of a 'Descending Triangle Pattern' is that the price usually break to the downside, however, that's not always the case.
Also, the RSI shows divergence + there is also an ongoing 'Flag Setup'. I will link my 'Flag Setup' idea below.
We'll wait for the breakout from the pattern and decide what our Target and Stop
Apollo Hospitals : Getting High on Drugs !Apollo Hospitals can be traded two ways :
i) On Pullback Entry which is shown as above , its not active yet. Only if we get pullback it gets activated.
ii) Can be traded as breakout from triangle, but the problem is when you get aggressive with your entry Risk gets wider, so you need to move it up above 1265's zone
Let's see whether we can get high without drugs... !
Raymond : The Complete Man !Raymond chart was bullish for last few days & closed a bit above the previous high's of 810's. There are many aspects one can interpret this chart above :
i) The ranging candle can be considered as Flag or Triangle depending on how you draw your lines & Not to worry, both are fine.
ii) If you don't trade simple patterns, then you can consider this as simple pullback to retest 810's, so on Reversal confirmation go for long trades, if its in your plan
If you go for hourly timeframe, you can s
Geojit Waving the FLAG towards higher highs Dear all
Bullisg Flag Pattern observed in Geojit (GEOJITFSL) Counter.. just sharing with you
Details are mentioned in the chart , if i am wrong please correct me and appreciable
Disclaimer: it purely my observation, Analysis and viewpoint ; Not a trade Recommendation
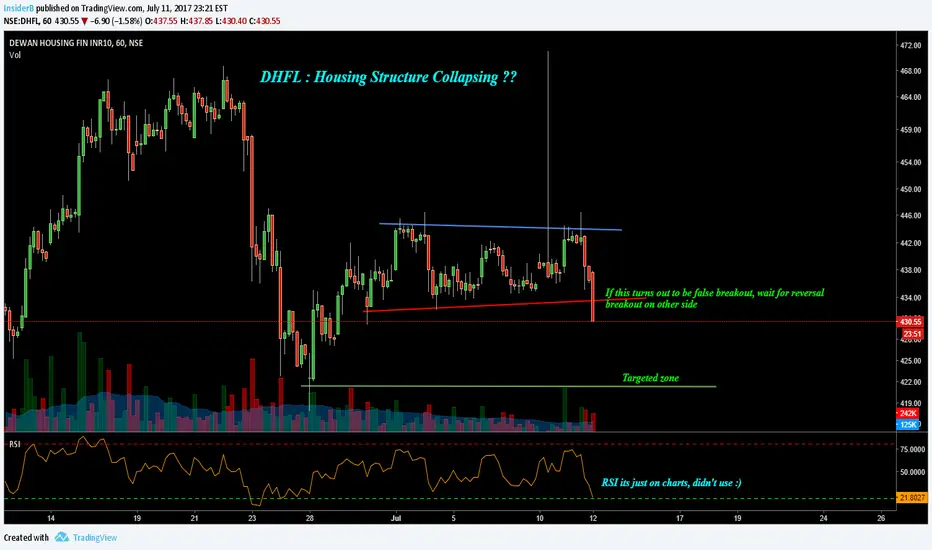
DHFL : Housing Structure Collapsing ?Simple consolidation breakout, the breakout is on right now, once its confirmed , Check with your plan & take trade positions in DHFL
Note : If you have doubts on, if we reverse our trade on false breakout, why we need to take that unnecessary loss on one side ? Well, we have tried here in tradingview itself manytimes, that reversing on false break covers the loss & either makes us break even or gets us something ( A little is ok when there is nothing ).
DShort
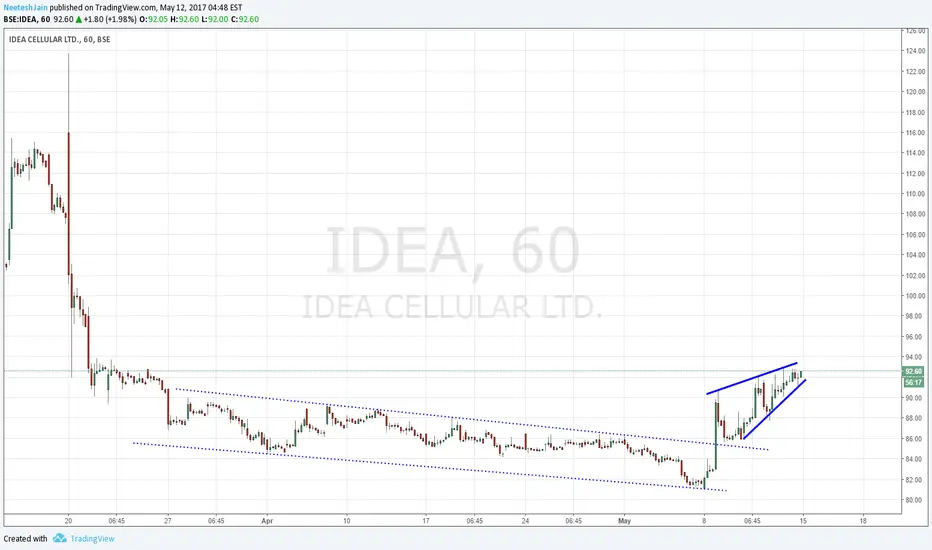
IDEA - Potential Continuation Pattern It is been observed on the hourly chart that the price action is forming a continuation pattern after breaking downward channel pattern.
It shall be a good opportunity to take a part in it once it closes above 93 levels.
I shall update the targets later.
#Watchlist
Regards