W-pattern
BALAJEE - Descending Triangle Meets Multi-Pattern ConfluenceOn the daily chart of Balajee, price action has formed a descending triangle right at the lower end of the trend:
๐ป Lower highs consistently pressuring horizontal support.
๐ฉ Price sitting within a clear demand zone, adding significance to the structure.
๐ Volume tapering off through consolidation, a classic triangle trait.
๐ Presence of a hidden counter-trend line (dotted) hinting at a potential broadening formation โ showing a rare multi-pattern overlap.
Such setups are important not for pred
455-Day Counter Trendline | From Breakdown to V-RecoveryThis weekly chart of Jio Fin Services Ltd illustrates a multi-phase price structure over 455 days:
๐น Initial Rally โ Kicks off from a defined accumulation base (grey zone), marking the start of a strong impulse leg.
๐น Consolidation Phase โ Price enters a descending triangle formation just below a historical resistance band.
๐น Breakdown โ Clean breakdown from the triangle pattern sends price sharply downward.
๐น V-Shaped Recovery โ A strong reaction off the original base zone leads to a sharp rev
Clear W Pattern in DogecoinDogecoin is making W Pattern in Weekly time frame๐ฐ๐ฐ
SL๐, Target๐ฏ and Entry๐ Points are Mentioned in chart.
After completion of W Pattern, the Coin is Likely to make a big Cup and Handle Pattern too๐ฑ๐ฑ
Note: This analysis is for Educational Purpose Only. Please invest after consulting a professional financial advisor.
Bank nifty correction start now?Bank Nifty
Current Price: 56,791.95 (Spot)
Bank Nifty has reversed lower from the resistance trendline, confirming selling pressure near higher levels.
A Dark Cloud Cover candlestick pattern combined with an emerging M-top formation indicates potential short-term bearish sentiment.
It can short here or any bounce use as shorting opportunity for target 56,056
Major resistance is 57,400-57,700
The index is forming a rising wedge pattern, a bearish structure suggesting potential for deeper cor
Radhika Jeweltech โ Classic Contraction PatternTimeframe: Weekly
Structure Observed: Contraction Pattern between Trendlines
Volume: Significant recent uptick ๐
Key Zones:
๐ด Supply Zone above 123
๐ข Dynamic Support from ascending trendline
๐ Active counter-trendline now breached
After months of lower highs and higher lows, the price has been squeezing into a classic contraction pattern between a descending orange trendline (acting as counter-trendline resistance) and a rising green trendline providing consistent support.
This weekโs candle
Inside Bar Ignites a Clean Breakout๐ข Simple Breakout Structure | Supply-Demand Flip
โ
Strong demand zone formed after multiple rejections
๐ป Previous supply zone clearly respected
๐ One active counter-trendline broken
๐ Breakout of mother candle with an inside bar setup
๐ Volume expansion on breakout
๐ Also broke a hidden resistance line, adding confluence
๐งญ Chart structure remains smooth and clear, respecting zones well
No predictions. Just structure.
One-Sided Broadening Pattern | Pure Price Action Storytelling๐น White Line: Captures the expanding higher-high resistance zone โ part of the broader one-sided broadening pattern. Each new high is breaching the prior, giving the top side its expanding identity.
๐น Horizontal Zone (Red to Green Shift): What once acted as a strong supply zone now flipped to a demand zone โ price has respected this region multiple times, marking its evolution.
๐น Red Line: A clean Counter-Trendline (CT) containing multiple touches, recently broken.
๐น Yellow Line: A hidden dia
SHRIRAM FINANCEHello & welcome to this analysis
After a very strong uptrend the stock went into a consolidation to form a cup & handle pattern, the handle being completed now in the form of a triangle.
As long as it does not break below 640 it has a high probability of breaking above the trendline at 700 for targets of 800 / 875 / 950
Good risk reward set up at the moment.
All the best
Nifty in a pole and flag pattern consolidation or M pattern.Nifty is in consolidation range waiting for the India US trade deal which has deadline of 9th july.
Based on the news the pattern can be made as Pole and flag if the news becomes positive.
Else, can make M pattern if deal doesn't happen.
Both side good targets are available.
Note: This analysis is for Educational Purpose Only. Please invest after consulting a professional financial advisor.
Punjab National Bank Flag Breakout Setup๐ Punjab National Bank (PNB) โ Flag Breakout Setup
Observed a classic flag pattern on the daily chart after a strong pole move in 2023โ24.
โ
Breakout above the channel confirmed with price action near 113.
โ
Entry plan: Watch for daily close >113 with volume.
โ
Stop-loss idea: Below 106.
โ
Target 1: 140 (first swing resistance).
โ
Measured move projection targets up to ~198 possible based on full flag pole.
Volume confirmation and broader market context will guide the actual trade trigger.
OPTIEMUS | Reclaiming Zones, Respecting Trendlines๐ฉ Price is navigating a critical structure:
White Line = Major CT (Control Trendline) โ currently acting as resistance.
White Zone = MTF Supply โก Demand Flip Zone โ price is holding above it.
Blue Zone = WTF Demand Pocket โ also reclaimed recently.
๐ After reclaiming both the blue and white zones, price is now consolidating just under the CT, possibly coiling up.
๐ง Not a prediction. No tips. Just structure-based storytelling.
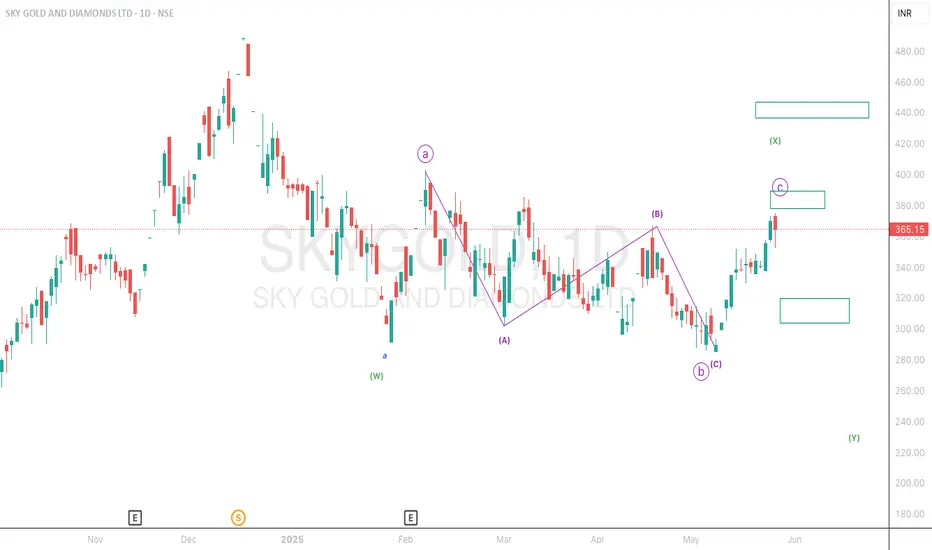
Too cloudy in sky gold and diamond..A consolidation phase is going on. as of now this script having correction or pullback value of 78.6% as its nature.
We need to wait and watch till the clouds disappear..
i am not a SEBI registered advisor. Before taking a trade do your own analysis or consult a financial advisor. I share chart for education purpose only. I share my trade setup.
CT Breakout + H&S! Whatโs Brewing in Udaipur Cement?๐ Chart Overview
A clean Counter-Trendline (CT) breakout is visible on the weekly timeframe.
The breakout also aligns with a classic Inverted Head & Shoulders structure.
The left shoulder, head, and right shoulder are all clearly formed, suggesting a potential reversal pattern.
๐ Hidden Resistance Lines
Dotted white lines represent hidden resistances, derived from prior swing highs/lows.
The extended hidden line from the top acts as future resistance, adding confluence to the zone.
๐ Monthly S
ULong
Bank Nifty Breaks Out: Classic W-Pattern Signals Bullish MomentuThis chart represents the **Nifty Bank Index** (BANKNIFTY) on a daily timeframe and showcases a technical analysis using:
1. **Fibonacci Retracement Levels**
2. **A Classic W-Pattern (Double Bottom)**
3. **RSI (Relative Strength Index)** at the bottom
---
### ๐ **Pattern Analysis**
#### ๐ Classic W-Pattern (Double Bottom)
- A W-pattern, also called a double bottom, typically indicates a **reversal from a downtrend to an uptrend**.
- Itโs clearly marked in yellow, showing the index formed two
Max Financial Services Ltd โ Trend Reversal in Play?๐ Technical Analysis Breakdown:
The yellow trendline shows a long-term support, which has held well despite recent corrections.
The red downtrend line indicates a recent bearish phase, which has now been broken with a strong bullish candle.
The stock has bounced from the trendline support, showing signs of strength.
Above all the strong Pinbar candle looks amazing for a candle close .
๐ Your Take? Do you see further upside or a pullback? Comment below! ๐
Identical patterns in Godfrey Phillips and Swan EnergyI showcase two identical patterns in Godfrey Phillips and Swan Energy in this video. I had previously traded Swan Energy, and because I journal my trades, I remembered its price action when I spotted the same setup in Godfrey Phillips.
This is the power of journaling! By maintaining a trading journal, you track your profits and losses and improve your ability to recognize repeating patterns and backtest data effectively.
Do you maintain a trading journal? Let me know in the comments!