XAUUSD: Rebound or Bull Trap Below 4,460? XAUUSD: Rebound or Bull Trap Below 4,460?
Market Context
Gold is trying to breathe after a sharp decline, but the bigger short-term picture is still under pressure.
Price dropped back toward the 4,300 area after failing to hold the previous recovery structure. On the daily view, gold remains below the 20-day EMA around 4,409, which keeps the short-term bearish tone alive. RSI near the mid-40s shows negative momentum, but not extreme oversold conditions yet. That means the market can still bounce, but the bounce may only be corrective.
Fundamentally, hawkish Fed comments continue to weigh on gold, while renewed US-Iran tensions may create short-term safe-haven reactions. This creates a mixed environment: buyers may react from demand, but sellers still control the structure unless gold reclaims key resistance.
Technical Structure
Gold has clearly shifted from last week’s strong upside move into a bearish correction.
The rejection from the upper structure was followed by a clean downside expansion, and price is now trading around 4,320. The current rebound is not enough to confirm a reversal yet.
The first area to watch is 4,350 - 4,365. This is nearby sell-side liquidity and may create a short-term reaction. If buyers step in from here, gold may attempt a deeper rebound.
But the real test is 4,440 - 4,460. This zone lines up with the bull trap retest area and sits below the current descending structure. As long as gold remains below this zone, the downtrend remains strong.
If price rejects from 4,440 - 4,460, sellers may push gold back toward 4,282, where a stronger buy reaction could appear.
Key Levels
Current Price: 4,320
Nearby Reaction Zone: 4,350 - 4,365
Bull Trap Retest Zone: 4,440 - 4,460
Daily EMA Pressure Area: 4,409
Smart Money Sell Base: 4,620 - 4,640
Premium Seller Zone: 4,660 - 4,670
Expected Buy Area: 4,282
Bearish Continuation: Below 4,320
Bullish Recovery: Above 4,460
Trading Plan
Primary Sell Scenario
Entry: 4,440 - 4,460 after bearish confirmation
SL: Above 4,490
TP: 4,365 / 4,320 / 4,282
Condition: Price must rebound into the bull trap retest zone and fail to reclaim structure. If sellers defend this area, the bearish correction can continue.
Early Sell Scenario
Entry: Below 4,320 after breakdown and retest
SL: Above 4,350
TP: 4,300 / 4,282 / 4,250
Condition: Gold loses the current rebound base and cannot reclaim it. This would show that buyers are still too weak to defend the recovery.
Buy Reaction Scenario
Entry: 4,282 after bullish confirmation
SL: Below 4,250
TP: 4,320 / 4,365 / 4,409
Condition: Price needs to retest the expected buy area and show a strong bullish rejection. This is only a reaction buy, not a full bullish reversal unless gold reclaims 4,440 - 4,460.
Bullish Recovery Scenario
Entry: Above 4,460 after breakout and retest
SL: Below 4,409
TP: 4,520 / 4,600 / 4,620
Condition: Buyers must break and hold above the bull trap zone. Only then does the bearish pressure start to weaken.
Overall Bias
Gold is rebounding, but the structure is still bearish below 4,440 - 4,460.
The current move looks more like a technical bounce after a sharp decline, not a confirmed recovery. Sellers still have the advantage while price remains below the 20-day EMA and below the bull trap retest zone.
If gold fails to reclaim 4,440 - 4,460, the next important downside area is 4,282. If buyers defend 4,282 strongly, a short-term rebound can happen. But if that zone breaks, the correction may expand deeper.
Best approach: do not chase the bounce. Wait for either a clean rejection from 4,440 - 4,460 or a confirmed bullish reaction around 4,282.
Will gold reclaim 4,460, or is this rebound only a trap before another drop?
 Long
Long
XAUUSD — 4,400 Rejects, 4,231 in Focus XAUUSD — 4,400 Rejects, 4,231 in Focus
Gold is looking heavy here. The chart already did the talking before the news even caught up. After losing the higher structure from last week, price rolled straight through the market and left that big FVG above untouched. Now we’re trading inside a fresh bearish channel, and every small bounce still looks like a weak refill rather than real strength.
Fundamentally, the backdrop is not helping bulls much. US yields pushing to record highs and rising expectations for a Fed hike this month are keeping pressure on gold. On top of that, the market is now waiting for the US ADP employment data, so short-term volatility can increase, but structurally I still lean bearish unless price proves otherwise.
From the chart, the main story is simple: gold broke down hard, failed to reclaim the imbalance around 4,490–4,525, and then continued printing lower highs inside the descending channel. The current area around 4,320 is not a bullish base yet. If price gives a small pullback into the trendline rejection zone around 4,380–4,405 and gets rejected again, I’d expect continuation lower toward 4,250 first, then the bearish extension target around 4,231.
For bulls to recover anything meaningful, they need to break the channel and reclaim that rejection zone cleanly. Until that happens, I still see rallies as sellable pullbacks, not reversal strength.
Key price zones to watch:
Current price area: 4,320
Trendline rejection zone: 4,380–4,405
Main FVG resistance: 4,490–4,525
Near downside support: 4,250
Bearish extension target: 4,231
Do you think ADP can save the bulls here, or is gold just setting up for one more leg lower?
Short 
 Long
Long
 Short
Short
NIFTY – INTRADAY TRADING PLAN 02-SEP-2026📊 ================================================== 📊
📅 Date: 02-Sep-2026 (Wednesday) — ⚡ WEEKLY EXPIRY DAY ⚡
🕐 Prepared: Sep-02-2026, 08:09 IST
📈 Prev. Close: 23,984.45 | Prev. High: 23,990.25 | Prev. Low: 23,959.15
📊 ================================================== 📊
🎯 KEY LEVELS TO WATCH TODAY
------------------------------------------------------
🔴 Last Intraday Resistance : 24,296
🟠 Opening Resistance : 24,188
⚠️ No Trading Zone : 23,947 – 23,989
🟢 Last Intraday Support : 23,853
🟢 Deep Support (Buyer's Zone): 23,737
------------------------------------------------------
📘 EDUCATIONAL NOTE:
Today is WEEKLY EXPIRY 🗓️ — expect HIGH VOLATILITY, sharp reversals, and rapid THETA DECAY on option
premiums. Market makers often try to "pin" price near max-pain levels late in the day. Gap openings
(100+ points) combined with expiry can cause exaggerated moves in the first hour, followed by
consolidation or reversal. Always wait for the 15-min candle close for confirmation before acting! 🔔
═══════════════════════════════════════════════════════
🟢 SCENARIO 1: GAP UP OPENING (100+ points, i.e., open above 24,090)
═══════════════════════════════════════════════════════
📈 What it means: Positive global cues push Nifty to open near/above Opening Resistance (24,188).
✅ Plan of Action:
1️⃣ If Nifty opens above 24,188 and 15-min candle CLOSES above it → Bullish continuation likely.
👉 Action: Look for CE (Call) buying on dips towards 24,150-24,170.
🎯 Target 1: 24,240 | 🎯 Target 2: 24,296 (Last Intraday Resistance)
🛑 Stop Loss: Below 24,090 (gap zone) on closing basis.
2️⃣ If Nifty opens gap-up but REJECTS from 24,188-24,296 zone (long upper wick):
👉 "Gap & Trap" scenario — expiry-day profit booking likely.
👉 Action: Avoid fresh CE buying at highs. Watch for reversal into No Trading Zone (23,947-23,989).
🎯 If NTZ breaks downward → PE opportunity towards 23,853.
📘 Tip: On expiry day, avoid buying deep OTM calls chasing a gap-up — theta will eat premium fast even
if the index moves sideways. 🚫💸
═══════════════════════════════════════════════════════
⚪ SCENARIO 2: FLAT OPENING (within ±100 points, near 23,900-24,080)
═══════════════════════════════════════════════════════
📊 What it means: No strong overnight bias; expiry-day range-bound action likely around No Trading Zone.
✅ Plan of Action:
1️⃣ ⚠️ NO TRADING ZONE: 23,947 – 23,989 → AVOID fresh positions while price is inside this zone.
This is a low-conviction area — wait for a clean breakout or breakdown.
2️⃣ Breakout Plan:
🔼 Sustained 15-min close ABOVE 23,989 → Bullish bias, target 24,188 → 24,296.
👉 Action: Buy CE on retest of 23,989-24,000 with SL below 23,947.
🔽 Sustained 15-min close BELOW 23,947 → Bearish bias, target 23,853 → 23,737.
👉 Action: Buy PE on retest of 23,947-23,930 with SL above 23,989.
📘 Tip: Expiry-day range moves can be choppy with fake breakouts (stop-hunts). Confirm with volume
and avoid trading the first 5-10 minutes of any breakout — let it retest before entry. ⏳
═══════════════════════════════════════════════════════
🔴 SCENARIO 3: GAP DOWN OPENING (100+ points, i.e., open below 23,884)
═══════════════════════════════════════════════════════
📉 What it means: Weak global cues push Nifty to open near/below Last Intraday Support (23,853).
✅ Plan of Action:
1️⃣ If Nifty opens below 23,853 and 15-min candle CLOSES below it → Bearish continuation likely.
👉 Action: Look for PE (Put) buying on pullback towards 23,853-23,870.
🎯 Target 1: 23,790 | 🎯 Target 2: 23,737 (Deep Support)
🛑 Stop Loss: Above 23,884 (gap zone) on closing basis.
2️⃣ If Nifty opens gap-down but RECLAIMS 23,853-23,884 zone (V-shape recovery):
👉 "Gap Fill" scenario — expiry-day short covering rally possible.
👉 Action: Avoid fresh PE buying. Watch for reversal into No Trading Zone (23,947-23,989).
🎯 If NTZ breaks upward → CE opportunity towards 24,188.
📘 Tip: On expiry days, PE premiums can crash rapidly even in a falling market due to time decay near
close. Book profits early instead of holding till the last hour. ⏰
═══════════════════════════════════════════════════════
🛡️ OPTIONS TRADING – EXPIRY DAY RISK MANAGEMENT TIPS
═══════════════════════════════════════════════════════
🔹 Expiry day = HIGH THETA DECAY — avoid holding naked long options through lunch hour (12-1 PM)
without a clear trend; premiums erode fast.
🔹 Never risk more than 1% of capital per trade on expiry day — volatility can wipe out premiums
within minutes.
🔹 Use STRICT stop losses — expiry-day reversals are sharp and can trap late entries.
🔹 Prefer slightly ITM options over far OTM "lottery tickets" for better delta and risk-reward.
🔹 Book partial profits quickly once Target 1 is hit — don't get greedy on expiry day.
🔹 Beware of "Max Pain" theory — price often gravitates towards the strike with maximum OI by close.
🔹 Avoid trading in the No Trading Zone (23,947-23,989) — low conviction, high whipsaw risk.
🔹 Do NOT carry option positions overnight on expiry day (they expire worthless if OTM).
🔹 Track India VIX — spikes indicate wider expected moves; adjust position sizing accordingly.
═══════════════════════════════════════════════════════
📝 SUMMARY & CONCLUSION
═══════════════════════════════════════════════════════
✔️ Key Resistance Zone: 24,188 – 24,296 → Sustained break = Bullish momentum on expiry day.
✔️ Key Support Zone: 23,853 – 23,737 → Sustained breakdown = Bearish momentum on expiry day.
✔️ No Trading Zone (23,947-23,989) → Stay out until a clear directional breakout/breakdown confirms.
✔️ Expiry day demands DISCIPLINE — theta decay, pin risk, and whipsaws are the biggest enemies
of option buyers today.
✔️ Let the first 15-30 min candle settle, respect stop losses, and book profits early — protecting
capital matters more than chasing every move. 💪
📘 This plan is purely for educational purposes to help understand how technical levels, gap
openings, and expiry-day dynamics can be combined into a structured trading approach. Markets are
dynamic — always adapt to live price action rather than rigidly following any static plan.
═══════════════════════════════════════════════════════
⚠️ DISCLAIMER
═══════════════════════════════════════════════════════
I am NOT a SEBI Registered Analyst. This content is shared purely for EDUCATIONAL PURPOSES ONLY
and should NOT be construed as investment/trading advice. Trading in equities, options, and
derivatives — especially on expiry days — involves substantial risk of loss and is not suitable
for all investors. Please consult a SEBI Registered Investment Advisor before making any
trading/investment decisions. I am not responsible for any financial losses incurred based on
this content. 🙏
📊 ================================================== 📊
``` Long 
JAMNAAUTOJamna Auto Industries Ltd. (NSE: JAMNAAUTO) displays a distinct macro impulse cycle on a 3-month (quarterly) candlestick chart, supported by strong balance sheet fundamentals as India's premier commercial vehicle (CV) suspension manufacturer.
1. Quarterly (3-Month Per Candle) Technical Structure
On the 3-month candlestick timeframe, each candle aggregates 90 days of price action, smoothing out short-term noise to highlight long-term institutional accumulation and structural trends.
* Macro Chart Configuration: Long-term base formation rising from single-digit lows, expanding into a secular uptrend with higher highs and higher lows.
* Key Support Zone (3M): ₹88.00 – ₹95.00 (confluence of historical demand zone and multi-year trendline support).
* Immediate Resistance Zone (3M): ₹145.00 – ₹152.50 (all-time high zone and multi-quarter supply cluster).
* Current Candle State: Price is consolidating near ₹120–₹122, displaying low volatility contraction within a broad quarterly range.
2. Elliott Wave Analysis (3-Month Supercycle Degree)
Under Elliott Wave Theory, price trends unfold in 5 motive waves (1-2-3-4-5) followed by a 3-wave correction (A-B-C). On the quarterly timeframe, Jamna Auto exhibits a classic 5-wave structural progression:
* Wave 1 (Initial Cycle): Historical structural rally that completed around the previous cyclical peak (~₹100–110 level).
* Wave 2 (Macro Corrective Retracement): Deep multi-quarter drop reaching the 2020 low near ~₹23–₹25. This wave retraced roughly 78.6% of Wave 1 without breaching Wave 1 origin, fulfilling the non-negotiable Elliott Wave rule.
* Wave 3 (Extended Impulse Leg): The strongest, volume-backed wave driving from ~₹25 to an all-time high of ~₹152.50. Wave 3 represents over 500% gains, making it the dominant impulse leg.
* Wave 4 (Current Quarterly Consolidation): The stock is currently completing Wave 4.
* Alternation Rule: Since Wave 2 was sharp and deep, Wave 4 is unfolding as a sideways, time-wise complex correction in the range of ₹90–₹125.
* Overlap Rule: Wave 4 low (~₹89.80) holds comfortably above the Wave 1 origin/breakout levels, preserving wave validity.
* Wave 5 (Projected Impulse): A decisive quarterly close above the ₹145–₹152 resistance zone confirms the onset of Wave 5. Fibonacci expansion target for Wave 5:
3. Fundamental Analysis
Jamna Auto Industries is India's largest manufacturer of tapered leaf springs and parabolic springs for commercial vehicles, holding over 60% market share in the domestic OEM segment.
| Metric | Current Value | Evaluation & Remarks |
| Market Capitalization | ~₹4,850 Cr | Small-Cap OEM supplier |
| Stock P/E Ratio (TTM) | ~20.5x | Reasonable valuation compared to auto-ancillary peers |
| Return on Capital Employed (ROCE) | ~28.0% | Strong operational efficiency and capital deployment |
| Return on Equity (ROE) | ~20.3% | High profitability relative to net worth |
| Debt to Equity Ratio | 0.01 (Virtually Debt-Free) | Clean balance sheet with minimal interest expense |
| Promoter Holding | 49.84% | Stable insider ownership with unpledged equity |
| Dividend Yield | ~1.74% – 2.06% | Consistent payout history |
Key Business Drivers & Risks
* Strengths: Debt-free balance sheet, dominant market position in leaf/parabolic springs, expanding aftermarket revenue share, and strong ROCE (28%).
* Risks: Cyclical dependency on the Commercial Vehicle (CV) industry volume, raw material cost fluctuations (steel), and client concentration risk with key OEMs like Tata Motors and Ashok Leyland.
Technical & Fundamental Confluence
The fundamental health (debt-free, 28% ROCE) aligns directly with the long-term technical structure. Wave 4 corrections on 3-month charts typically mark long-term accumulation zones for fundamentally sound companies before the final Wave 5 breakout.
 Long
Long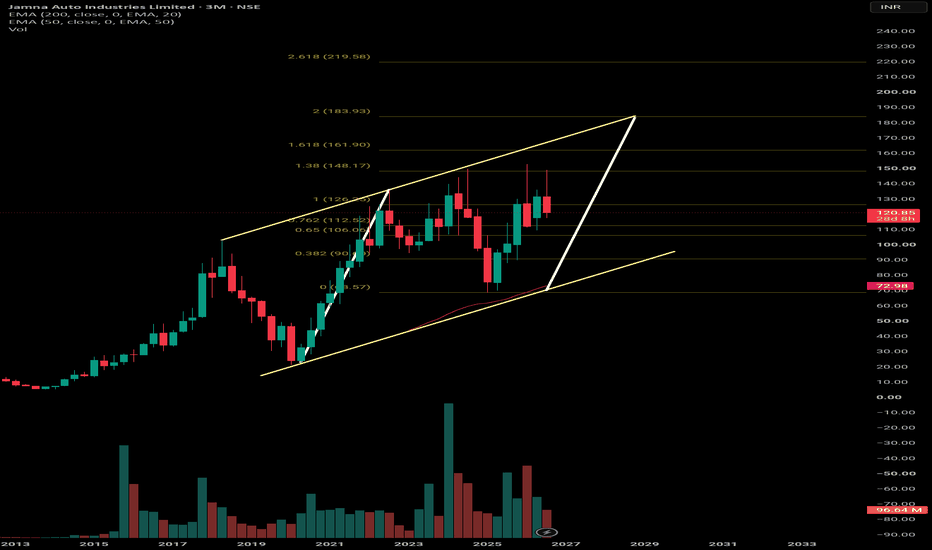
Education

 Education

Trading Masterclass #1Institutional trading means trading like hedge funds, banks, prop firms, and professional desks. They do not trade based on emotions, random tips, or gambling. They use systems, probabilities, risk control, position sizing, discipline, and psychology.
Retail traders often lose because they focus only on “entry.” Institutions focus on:
Risk Management
Capital Protection
Position Sizing
Probability
Psychology
Consistency
Repeatable Edge
In options trading, if you think like institutions, your results can improve significantly
 Education

 Education

Education

Global Financial MarketsGlobal financial markets are systems where people, companies, and governments buy and sell financial assets across the world. They help move money from those who have extra funds to those who need funds.
Main Types of Global Financial Markets:
Stock Markets – Buying and selling shares of companies (e.g., NYSE, NSE).
Bond Markets – Governments and companies borrow money by issuing bonds.
Foreign Exchange (Forex) Markets – Trading currencies like USD, EUR, INR.
Commodity Markets – Trading gold, oil, wheat, etc.
Money Markets – Short-term borrowing and lending.
Derivatives Markets – Contracts based on assets like stocks or currencies.
Importance:
Provide funds for business growth
Support international trade
Create investment opportunities
Help manage financial risks
Affect global economies
Example:
If the US stock market falls sharply, markets in Asia and Europe may also be affected because markets are connected globally. Education

Long 
XAUUSD – Gold Weakens Before Key U.S. Data XAUUSD – Gold Weakens Before Key U.S. Data
Gold is starting the new week under pressure after failing to hold the previous recovery structure.
Price is now trading around 4,423 after a sharp bearish impulse from the 4,580 – 4,600 area. The move shows that buyers lost control in the short term, while sellers are trying to keep price below the broken structure.
The market is now waiting for important U.S. data, with the U.S. dollar supported by risk-off sentiment, rising Treasury yields, and stronger expectations that the Fed may keep a hawkish tone into September. This is important for gold because higher yields and a stronger dollar usually reduce demand for non-yielding assets.
Technical structure
On the H1 chart, gold rejected from the upper area and created a strong bearish leg toward 4,397. After that, price moved into a small consolidation range below the descending short-term trendline.
The nearest resistance zone is around 4,480 – 4,520, where Fibonacci 0.618 and the previous sell order zone are aligned. If gold retests this area and fails to break above it, sellers may continue to defend the trend.
The key low is around 4,396. If price breaks below this level with clear momentum, the next liquidity area around 4,340 – 4,360 becomes the main downside target.
However, if gold can reclaim 4,520 and hold above it, the bearish pressure may weaken and price could attempt a recovery back toward 4,560 – 4,580.
Key price zones
Current price: 4,423
Nearest low: 4,396
Main liquidity support: 4,340 – 4,360
Sell order 0.618 zone: 4,480 – 4,500
Sell order Fibonacci zone: 4,505 – 4,520
Recovery confirmation: above 4,520
Trading scenario
Primary scenario – Sell on recovery
Sell zone: 4,480 – 4,520
Entry condition: bearish rejection, failed retest, or lower-timeframe bearish confirmation
Stop loss: above 4,520
Take profit 1: 4,396
Take profit 2: 4,360
Take profit 3: 4,340
Alternative scenario – Bullish recovery
Condition: H1 candle closes back above 4,520 and holds
Target: 4,560 – 4,580 first
If buyers regain strength above 4,580, gold may try to rebuild a stronger recovery structure.
Hannah’s view
Gold is not in a clean buying area yet. The short-term structure still favors sellers while price remains below 4,480 – 4,520.
For now, I prefer watching the reaction around the sell order Fibonacci zone. A weak recovery into this area may give sellers another chance to push price lower.
The key level is 4,396. If this low breaks, gold may continue toward the deeper liquidity zone near 4,340 – 4,360.
Main view: wait for confirmation around 4,480 – 4,520. No confirmation means no trade.
Do you think gold will reject from the Fibonacci sell zone, or will buyers reclaim 4,520 before the U.S. data?
Long 
GOLD IS BEING SQUEEZED – WHERE WILL THE NEXT BREAKOUT GO?Gold remains in a short-term downtrend. However, after the sharp decline, price has started to consolidate and is being squeezed into a narrow 4,400–4,460 wedge.
The key question now is: Is this a base forming for another move higher, or simply a pause before sellers extend the downside?
Resistance
4,470–4,480 │ 4,515 │ 4,542
Support
4,400 │ 4,340 │ 4,320 │ 4,300
🎯 TRADING SCENARIOS
Bullish scenario:
If price holds 4,400 and breaks above 4,470–4,480, followed by a break of 4,515, the recovery could extend toward 4,542.
Bearish scenario:
If 4,400 breaks, especially if price then loses 4,340, selling pressure could extend toward 4,320 → 4,300.
👉 For now: look for BUY opportunities near the lower range and short-term SELL opportunities near the upper range. Trade the direction of the breakout.
🧠 PERSONAL VIEW
What matters most to me right now is that selling pressure is slowing, but it has not disappeared. Therefore, I am not ready to conclude that the 4,400 area has completed its base-building process.
Price could continue to consolidate and move sideways as the market absorbs buying and selling pressure before the next expansion.
The next major catalyst is NFP on September 4.
Last month, Nonfarm Payrolls fell by 23,000 jobs, while June payrolls were revised down to +20,000. This makes the upcoming NFP especially important in determining whether the labor market weakness was temporary or part of a broader deterioration.
This data could also have a major impact on Fed rate expectations for September, which in turn could directly affect the U.S. dollar and gold.
⚠️ KEY IDEA
Do not rush to predict the direction.
I will watch how Gold behaves within the 4,400–4,460 range, especially around both boundaries.
Holding support → potential base for a rebound.
Breaking support → sellers remain in control.
For now, let price reveal its hand through the economic data and prepare for the big battle of the week: NFP. Short 
Apollo Hospitals: Consolidation and Strategic Entry LevelsOverview
Apollo Hospitals is moving inside a clean upward channel on the daily chart. The larger structural trend remains positive, well supported by the overall strength in the Nifty Pharma sector.
The Wave Structure
Wave (i) & (ii): Wave (i) topped at ₹7,870.5, and Wave (ii) found solid support at ₹7,080.0.
Wave (iii): Price hit a high of ₹9,050.0, perfectly matching the 1.618 Fibonacci extension zone.
Wave (iv): Currently consolidating to build energy for the next leg up.
How Wave (iv) Might Unfold
Scenario A (Triangle Pattern): Price holds above the local trendline and the ₹8,507.5 support level, coiling sideways before breaking out.
Scenario B (Channel Retest): Price tests lower toward the bottom blue line of the main upward channel before finding fresh buyers.
Entry Strategy & Confirmation
Entry Trigger: Buy only above ₹8,984.0 .
Volume Filter: Wait for good buying volume on the breakout candle to avoid false moves.
Upside Target: Wave (v) can push price toward the upper channel boundary around ₹9,400 – ₹9,600.
Clear Invalidation Levels
Pattern Weakness: A breach below ₹8,507.5 invalidates the immediate triangle setup and signals a deeper Wave (iv) retest.
Hard Setup Invalidation: Any drop below ₹7,870.5 (the Wave i high) completely invalidates this Elliott Wave count.
Disclaimer: This post is for educational purposes only and is not financial advice. I am not a SEBI-registered analyst. Please do your own research and manage your risk carefully.  Long
Long
NIFTY — WEEKLY EXPIRY TRADING PLAN | 01-SEP-2026
═══════════════════════════════════════════════
NIFTY 50 INDEX | WEEKLY EXPIRY (TUESDAY)
Prev Close: 24,051.95 | Prev Range: 24,044.65 - 24,074.95
═══════════════════════════════════════════════
🎯 KEY REFERENCE LEVELS
🔴 Major Resistance: 24,429 — Extended upside target
🔴 Last Intraday Resistance: 24,295 — Strong reaction zone
🟠 Opening Resistance Zone: 24,125 – 24,186 — Decision zone for bulls
⚪ Opening Support/Resistance Pivot: 24,043 — Bias-deciding pivot
🟢 Last Intraday Support: 23,947 — Strong reaction zone
🟢 Major Support: 23,856 — Extended downside target
📌 Note: Since 100+ points is being used as the Gap threshold for this weekly expiry, today's opening is classified as follows:
Gap Up → Open ≥ 24,152 (Prev Close + 100)
Gap Down → Open ≤ 23,952 (Prev Close − 100)
Flat Opening → Open between 23,952 – 24,152
---------------------------------------------------
🟢 SCENARIO 1: GAP UP OPENING (Open ≥ 24,152)
📖 Explanation:
A gap up of 100+ points on a weekly expiry day usually reflects strong overnight global cues or positive triggers. However, expiry-day gaps are prone to quick fade/profit booking, so the first 15-min candle must confirm sustainability before chasing longs.
✅ Plan of Action:
1. Do NOT buy Call options immediately at open — wait for price to hold above 24,186 (Opening Resistance zone) for 2-3 candles (15 min TF) confirming strength.
2. Bullish Continuation Trigger: Sustained trade above 24,186 → Buy CE (ATM/slightly OTM), Target 24,295, extended target 24,429.
3. Gap-Fill/Fade Trigger: If price rejects at 24,186–24,295 zone and slips back below 24,125, book CE profits and look for PE opportunity back toward 24,043.
4. Stop Loss (for CE Buyers): Below 24,125 (opening resistance turned support) on a closing basis (15 min).
5. ⚠️ Avoid fresh CE buying if index opens directly above 24,295 — risk of exhaustion gap; prefer waiting for a retracement entry near 24,186-24,225.
---------------------------------------------------
⚪ SCENARIO 2: FLAT OPENING (Open between 23,952 – 24,152)
📖 Explanation:
A flat opening near the pivot (24,043) means the market is undecided. On expiry days, flat opens often lead to range-bound movement until a clear breakout/breakdown of the Opening Support/Resistance zone occurs.
✅ Plan of Action:
1. Range Identification: Treat 24,043 as the pivot. Avoid initiating fresh positions in the first 15-30 minutes — let the market pick a direction.
2. Bullish Setup: Sustained break & 15-min close above 24,125 → Buy CE targeting 24,186, then 24,295.
SL: Below 24,043 (closing basis)
3. Bearish Setup: Sustained break & 15-min close below 24,043 → Buy PE targeting 23,947, then 23,856.
SL: Above 24,125 (closing basis)
4. Choppy/Range Scenario: If price oscillates between 24,043–24,125 without conviction, avoid directional option buying — consider a light Iron Condor / Short Straddle (defined risk) only if experienced in premium selling, given elevated expiry-day theta decay.
---------------------------------------------------
🔴 SCENARIO 3: GAP DOWN OPENING (Open ≤ 23,952)
📖 Explanation:
A 100+ point gap down suggests negative overnight sentiment (global sell-off, negative news, etc.). Similar to gap-up logic, wait for confirmation rather than shorting blindly at open, as gap-down opens often see a dead-cat bounce.
✅ Plan of Action:
1. Do NOT short/buy PE immediately at open — wait for price action confirmation below 23,947 (Last Intraday Support).
2. Bearish Continuation Trigger: Sustained trade below 23,947 → Buy PE (ATM/slightly OTM), Target 23,856, extended target further downside.
3. Gap-Fill/Recovery Trigger: If price reclaims 23,947–24,043 zone strongly, book PE profits and look for a CE opportunity back toward 24,125.
4. Stop Loss (for PE Buyers): Above 23,947 (support turned resistance) on closing basis (15 min).
5. ⚠️ Avoid fresh PE buying if index opens directly below 23,856 — risk of oversold bounce; wait for a pullback entry near 23,900-23,947 zone.
---------------------------------------------------
🛡️ OPTIONS TRADING – RISK MANAGEMENT TIPS
1. 📉 Theta Decay Awareness: On weekly expiry day, option premiums decay very fast, especially post 1:00 PM. Avoid holding naked long options for too long without price movement.
2. 💰 Position Sizing: Never deploy more than 2-3% of trading capital in a single expiry-day trade — expiry day volatility can wipe out premiums quickly.
3. 🎯 Defined Stop Loss: Always place SL as per the underlying index level, not just premium value, to avoid getting stopped out due to IV fluctuations.
4. 🔄 Avoid Overtrading: Stick to maximum 2-3 trades in a session. Revenge trading after a loss on expiry day is the #1 account killer.
5. 🧮 Use Spreads for Safety: Instead of naked option buying, consider Bull Call Spread / Bear Put Spread to reduce theta impact and define risk-reward clearly.
6. ⏰ Time-based Exit: If your trade hasn't hit target within 30-45 minutes of entry, consider trailing SL to cost or exiting — expiry-day moves are quick and sharp.
7. 📊 Avoid Trading in the Last Hour Blindly: Last hour (2:30-3:30 PM) sees unpredictable pinning/unwinding action near max pain — reduce size or avoid fresh entries.
8. 🚫 No Averaging Losing Positions: Never average a losing option buy position hoping for a reversal — cut losses early and preserve capital.
9. 📈 Volume & OI Confirmation: Always confirm breakout/breakdown levels with volume and Open Interest data (PCR, OI shift) for higher probability trades.
---------------------------------------------------
📝 SUMMARY & CONCLUSION
Today being a weekly expiry session, volatility and premium decay will play a much bigger role than usual. The market's reaction around the Opening Support/Resistance zone (24,043) and the Opening Resistance band (24,125-24,186) will set the tone for the day.
🟢 Gap Up (100+): Wait for confirmation above 24,186 before going long; else fade towards 24,043.
⚪ Flat Open: Let the pivot (24,043) decide direction; trade the breakout of 24,043-24,125 range.
🔴 Gap Down (100+): Wait for confirmation below 23,947 before going short; else expect bounce towards 24,043.
Always trade with a pre-defined stop loss and target, respect risk management rules, and avoid emotional decision-making, especially on expiry day when premiums move erratically.
═══════════════════════════════════════════════
Trade the Plan. Don't Plan the Trade Emotionally. 🎯
═══════════════════════════════════════════════
⚠️ DISCLAIMER: I am not a SEBI registered analyst/advisor. This trading plan is prepared purely for educational purposes based on technical chart analysis and should not be considered as investment/trading advice. Please consult a certified financial advisor and do your own research (DYOR) before making any trading or investment decisions. Trading in derivatives (Futures & Options) involves substantial risk of loss and is not suitable for all investors. Long 
NIFTY DAILY: Trendline Breakdown — 24,200 Is the Key LevelNIFTY is at a critical decision zone.
Daily trendline + ending diagonal support is under pressure.
🔴 Bearish below: 24,000 / trendline breakdown
🎯 Downside levels: 23,785 → 23,173 → 22,679 → 22,184
🟢 Bullish reversal only if: 24,200 closes above
Above 24,200 closing, the bearish setup gets invalidated and a fresh bullish move can be considered.
Key Level: 24,200 Closing Basis
Not a trade recommendation. Levels are based on technical structure.  Long
Long


