Nifty IT index bouncing back before the next big fallThe IT sector bear market in India is far from over. The broadening pattern can easily be read as a bottom formation by bullish analysts looking for the old story to come back, but it may not. The wave analysis suggests this may be wave B, completed as WXY, a complex pattern. We are bouncing back in wave ii of C now, which can last a few days, but wave iii of C down will probably unfold as the results season for IT stocks draws near. A repeat of what we saw in April 2026: an impulsive sell-off could repeat in July 2026. Wave C itself can take the index down to 22668. India is in a bull market that does not include Indian tech stocks.
Wave Analysis
Belrise Industries: Opportunity Often Appears When Optimism FadeBelrise Industries has completed what appears to be a Wave iii advance and is now retracing into the projected Wave iv support region.
The current pullback is testing the prior breakout area, which also aligns with a potential demand zone. From an Elliott Wave perspective, the ideal outcome would be a corrective decline that remains contained within this region before the larger trend attempts to resume.
At this stage, the quality of the correction is more important than its depth. A corrective structure would keep the impulsive count intact, while an impulsive decline would warrant a reassessment of the current wave interpretation.
The next few sessions should provide valuable information about the strength of the underlying trend.
Educational purpose only. Not investment advice.
NIFTY 50📈 Trend
Bias: Bullish
Price is making higher highs and higher lows.
Momentum remains positive as long as 24,300 holds.
🔴 Resistance Levels
R1: 24,430 – 24,450 (Immediate)
R2: 24,500
R3: 24,600
R4: 24,750
R5: 24,900 – 24,950
🟢 Support Levels
S1: 24,300
S2: 24,150
S3: 24,000 (Strong)
S4: 23,850
S5: 23,700 (Major Swing Support)
✅ Buy Above
24,450 (1H candle close)
🎯 Upside Targets
Target 1: 24,500
Target 2: 24,600
Target 3: 24,750
Target 4: 24,900–24,950
Stop Loss: 24,300
🔻 Sell Below
24,000 (1H candle close)
🎯 Downside Targets
Target 1: 23,850
Target 2: 23,700
Target 3: 23,500
Stop Loss: 24,150
🔑 Key Levels to Watch
24,450 → Breakout Trigger
24,500 → Strong Resistance
24,300 → Immediate Support
24,000 → Major Demand Zone
23,700 → Trend Reversal Level
📊 Trading Plan
Above 24,450: Stay bullish and buy on strength.
Between 24,300–24,450: Consolidation; wait for confirmation.
Below 24,300: Expect profit booking.
Below 24,000: Bears gain control, with downside toward 23,700–23,500.
ICICI BankImmediate Support
₹1,405–1,410 (buy-on-dips zone)
₹1,378–1,382 (major support)
₹1,345 (strong positional support)
Resistance
₹1,432 (first hurdle)
₹1,453 (major breakout level)
₹1,486–1,500 (next positional target after breakout)
Bullish Scenario
Hold above ₹1,410
Break and close above ₹1,432
Targets:
₹1,453
₹1,486
₹1,500+
Bearish Scenario
Close below ₹1,378
Downside targets:
₹1,345
₹1,324
Swing Trading Plan
Buy Zone: ₹1,400–1,410
Stop Loss: ₹1,378
Targets: ₹1,453 → ₹1,486 → ₹1,500+
Trend: 🟢 Bullish
Momentum: Positive
Strategy: Buy on dips while above ₹1,378. A decisive breakout above ₹1,432 can lead to fresh upside momentum.
Nifty Analysis for the week 06 June to 10 July, 2026Wrap up:-
In major time frame, we are in wave y of x of major wave 4. In wave y, wave a has been completed at 24601 and wave b is in progress.
In wave b, internal wave a is completed at 23813, wave b is treated as completed once nifty breaks 23909 and thereafter, wave c will proceed.
Disclaimer: Sharing my personal market view — only for educational purpose not financial advice.
"Don't predict the market. Decode them."
XAUUSD — EMA Uptrend Holds, Buy From Value Zone
Fundamental Analysis
Gold is holding a stronger recovery structure as traders continue to watch USD momentum, Treasury yields, and upcoming U.S. macro data.
For now, the technical structure remains constructive while price holds above the rising EMA support zone.
Technical Analysis
On the 1H chart, XAUUSD is trading around 4,155 after a strong bullish recovery from the lower structure. EMA 34, EMA 89, and EMA 200 are starting to turn upward, showing that buyers are gaining control of the short-term trend.
Price is currently testing the EMA 34 area, which is also close to the Fibonacci and trendline value zone. This is an important area because a bullish reaction here may confirm that the market is preparing for another continuation move.
The key buy zone is around 4,136 - 4,152. This zone aligns with EMA 34, Fibonacci support, and the rising trendline structure.
If buyers defend this area, gold may continue toward the previous high around 4,202, then 4,221. A stronger breakout may open the way toward the Fibonacci extension target around 4,312.
Important Key Levels
Current price area: 4,155
Main buy zone: 4,136 - 4,152
EMA 34 reaction area: around 4,152
EMA support area: 4,107 - 4,136
Short-term resistance: 4,202
Breakout resistance: 4,221
Main upside target: 4,281 - 4,312
Invalidation area: below 4,101
Trading Scenario
Main Buy Scenario
Entry: 4,136 - 4,152
Stop Loss: 4,101
Take Profit 1: 4,202
Take Profit 2: 4,221
Take Profit 3: 4,281 - 4,312
Buy Condition
The preferred setup is to wait for gold to hold the 4,136 - 4,152 buy zone. This area is important because price is testing EMA 34 while still holding above the rising EMA structure.
A buy setup becomes more valid if price forms bullish rejection from this zone, such as a long lower wick, bullish engulfing candle, higher low formation, or a clean reclaim above 4,160.
If price holds above the buy zone and breaks 4,202, the bullish continuation view becomes stronger. The next upside targets would be 4,221, then 4,281 - 4,312.
Alternative Sell Scenario
Entry: below 4,101 after breakdown confirmation
Stop Loss: 4,136
Take Profit 1: 4,079
Take Profit 2: 4,040
Take Profit 3: 4,020
Sell Condition
This is not the main view. A sell setup should only be considered if gold breaks below 4,101 and fails to reclaim the EMA support structure.
If price loses the rising trendline and closes below the EMA value zone, the bullish setup becomes weaker and gold may retest lower liquidity areas.
Entry Conditions
Wait for price to react around 4,136 - 4,152.
Look for bullish confirmation before entering buy.
Do not chase price if it moves directly into resistance.
A break above 4,202 confirms stronger bullish momentum.
If price breaks and holds below 4,101, the buy setup is invalid.
Overall, the main view remains bullish while XAUUSD holds above the rising EMA structure. Price is now testing EMA 34, so the preferred plan is to wait for a clean reaction from 4,136 - 4,152 before looking for continuation toward 4,202, 4,221, and 4,281 - 4,312.
Do you share the same bullish view on gold, or are you waiting for a stronger confirmation above 4,202?
KPIT TECHNOLOGIES : a good long term investment pick ?Note : This idea is purely for learning and educational purpose and it's not buying or selling recommendation.
1] Stock price has reached to yearly strong demand zone
2] According Elliot wave analysis, stock has completed one complete cycle (5 wave up and 3 waves down) and it could start a major 3rd wave.
3] Investment horizon : 3 to 5 years.
5] Follow stop-loss very strictly.
6] Never invest more than 5% capital in single stock.
Emmvee - Potential completion for 1st impulse wave - Book profit
Views expressed are based on Elliott Wave Principle
Emmvee Photovoltaic Power started forming its first impulse wave on 18 Dec 2025 after its listing in stock exchange.
W1 = Small five wave sequence
W2 = Flat correction where Wave C = 1x of Wave A (larger retracement)
W3 = Extended five wave sequence, achieved 2x of W1
W4 = Smaller degree correction
W5 = Extended five wave sequence, achieved 1x of W3
Details have been provided in the chart.
The stock has most likely completed its first impulse wave as above. Traders may book profit / trail stop loss.
XAUUSD — Early Week Pullback Before Bullish Recovery
Gold is trading around $4,167 after recovering strongly from the lower liquidity area. Price is now testing the short-term descending trendline, so the market may first create a pullback before the next bullish continuation attempt.
From an SMC perspective, gold has already swept the lower liquidity twice and created a recovery structure from the bottom. The current move is approaching a trendline reaction area, so an early-week rejection is possible. However, as long as price holds above the $4,095–$4,101 FVG buy zone, the recovery structure can still remain valid.
The main plan for the beginning of the week is to avoid chasing gold at the current price. If price rejects from the trendline area, gold may first pull back toward the $4,095–$4,101 buy zone. This zone is the key area where buyers may defend the structure before pushing price back toward $4,269, $4,283 and the strong liquidity area around $4,382.
Sell scalping setup
Condition:
Gold rejects from the descending trendline area around the current price and fails to break above the short-term resistance.
Entry: $4,167–$4,195 after bearish rejection
SL: above $4,230
TP1: $4,120
TP2: $4,095–$4,101
TP3: $4,029
Buy setup 1
Condition:
Gold pulls back into the FVG buy zone around $4,095–$4,101 and forms bullish rejection with lower timeframe MSS / CHOCH.
Entry: $4,095–$4,101
SL: below $4,029
TP1: $4,167
TP2: $4,269
TP3: $4,283
TP4: $4,382
Buy setup 2
Condition:
If gold breaks above the descending trendline and retests it as support, bullish continuation remains valid without waiting for a deep pullback.
Entry: above $4,195 after breakout retest
SL: below $4,120
TP1: $4,269
TP2: $4,283
TP3: $4,382
Sell setup
Condition:
Selling is not the main priority after a deep pullback. A stronger sell setup is only valid if gold reaches the $4,269–$4,283 FVG sell scalping zone and shows clear bearish rejection.
Entry: $4,269–$4,283 after rejection
SL: above $4,330
TP1: $4,195
TP2: $4,167
TP3: $4,095–$4,101
Key levels
Current price area: $4,167
Short-term trendline resistance: $4,167–$4,195
FVG buy zone: $4,095–$4,101
Sell-side liquidity: $4,029
FVG sell scalping zone: $4,269–$4,283
Strong liquidity: $4,382
Higher FVG resistance: $4,420–$4,455
Bullish continuation confirmation: clean break above $4,195
Bullish target confirmation: clean break above $4,283
Bullish invalidation: clean 2H close below $4,029
My current view is that gold may drop first at the beginning of the week before building another bullish recovery. The Prime Gold plan is to wait for price to pull back into the FVG buy zone around $4,095–$4,101, confirm bullish reaction, then follow the move toward the upper liquidity zones.
No confirmation, no trade.
MASON XAUUSD – Gold Holds Bullish Structure At Weekly Open
XAUUSD is trading around 4,181 at the start of the week after holding above the recent breakout structure. Price remains inside the rising trendline channel and above the Ichimoku support area, so the short-term bias is still bullish.
The priority view remains buy on pullback, especially if gold retests the 4,172–4,177 buy order zone and continues to hold above the key support area.
Technical View
Gold is still showing a bullish structure after the strong recovery from the 3,960 area. The market has created higher highs and higher lows, which shows that buyers are still controlling the short-term direction.
Price is currently moving inside a rising trendline channel. This channel is important because it shows the path of the bullish momentum. As long as gold holds above the lower trendline, the upside structure remains valid.
Ichimoku also supports the bullish view. Price is trading above the Ichimoku structure, while the cloud and Ichimoku lines below price may now act as dynamic support. This means pullbacks are still healthier than chasing price at resistance.
The 4,172–4,177 area is the key buy order zone on the chart. If gold pulls back into this zone and forms bullish rejection, it may confirm another higher low before continuing higher.
The 4,155 area is the key support zone. If price stays above this level, buyers still have the advantage. A breakdown below 4,155 would weaken the bullish structure and may create a deeper correction.
The main upside target remains the psychological resistance zone around 4,270–4,280, which also aligns with the Fibonacci 2.618 extension area. This is the next major zone where price may react.
Key Zones
Current price: 4,181
Buy order zone: 4,172–4,177
Key support zone: 4,155
Ichimoku support area: 4,093–4,052
Short-term resistance: 4,190–4,200
Psychological resistance zone: 4,270–4,280
Fibonacci extension target: 2.618
Invalidation: below 4,155
Trading Plan
Buy Priority: 4,172–4,177
Condition: wait for bullish rejection, higher low formation, or price holding above the rising trendline and Ichimoku structure.
SL: below 4,155
TP1: 4,200
TP2: 4,240
TP3: 4,270–4,280
Alternative Scenario
If gold breaks above 4,200 directly, wait for a retest of this level as support before looking for continuation toward 4,240 and the psychological resistance zone.
Sell View
Sell is not the priority while price stays above the rising trendline, the buy order zone, and the Ichimoku structure. A sell setup only becomes safer if gold breaks below 4,155 and fails to recover back above the key support zone.
Final View
Overall, gold continues to hold a bullish structure at the start of the week. The cleaner plan is to wait for a pullback into the 4,172–4,177 buy zone instead of chasing price near resistance. If this zone holds, the next upside focus remains 4,200, 4,240, and 4,270–4,280.
Will gold retest the buy order zone first, or continue directly toward the psychological resistance area?
You Found the X. But How Big Is the Canvas?The Trap of Looking at One Timeframe
It does not matter how clean the setup looks. It does not matter if the market structure on the daily is textbook perfect, higher highs, higher lows, clean breakouts, a beautiful EMA crossover. None of that context matters in isolation if you have not asked one simple question first.
Where is this on the bigger canvas?
What the Daily Shows
The daily chart tells a confident story. Market structure is healthy. Higher lows are forming. Maybe a breakout has occurred. Maybe the EMAs have crossed in the right direction. From this lens, everything looks constructive. A trader looking only here would feel justified in their read.
What the 6 Month Reveals
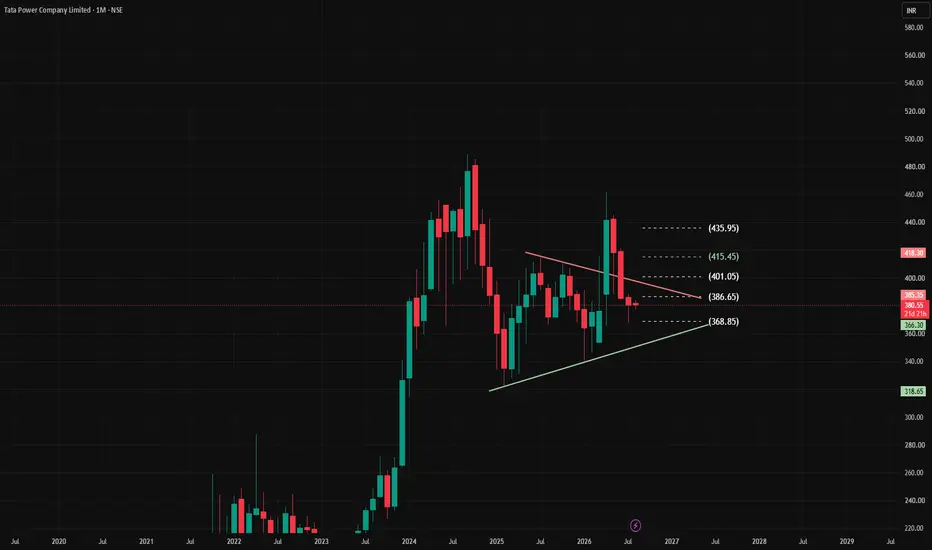
Switch to the left side of this post. The monthly chart. Zoom out and suddenly the same price area that looked like open space on the daily is sitting directly beneath a major counter trendline. Or inside a symmetrical triangle pattern that has been compressing for years. Or approaching a resistance zone that has rejected price multiple times across a decade.
The X that looked like opportunity on the daily is sitting at the edge of a wall on the monthly. Same price. Completely different story depending on which canvas you are reading it from.
The Multi Timeframe Habit
This is not about ignoring the daily. It is not about only trading the monthly. It is about making sure that whatever you observe on your working timeframe, you have visited the higher timeframe first to understand the location of that observation within the broader structure.
Disclaimer: This post is purely educational and observational in nature based on historical price action across multiple timeframes. It does not constitute financial advice, a forecast, or a recommendation to buy, sell, or hold any security. Multi timeframe analysis is a personal observational approach and does not guarantee future price behavior.
NIFTY — Trading Plan for 06 July 2026
🗓️ Date: Monday, 06 July 2026 | Timeframe: 15-Min |
"Plan your trade, Trade your plan — the market rewards discipline, not impulse."
🔑 KEY LEVELS TO WATCH — Chart Reference
Before diving into scenarios, let's understand the critical zones marked on the chart:
🟠 Opening Resistance (Orange Line — NO TRADE / Sideways Zone): 24,318
→ This is the neutral/indecision zone. Price hovering here = wait & watch. No aggressive trades.
🟥 Last Intraday Resistance Zone (Red Box): 24,347 – 24,373
→ Strong supply zone from previous session. Expect selling pressure here.
🟥 Major Resistance (Red Line): 24,528
→ This is the ultimate hurdle for bulls today. A breakout above this = strong momentum.
🟨 Opening Support Zone (Orange Box): 24,215 – 24,240
→ Key demand zone near open. Bulls need to defend this.
🟩 Last Intraday Support (Green Line): 24,166
→ Previous session's low support. A breakdown below confirms bearish sentiment.
🟩 Major Support (Green Line): 24,036
→ Strong demand zone. This is the target for bears if breakdown sustains.
🔵 Previous Close: 24,271.60
🚀 SCENARIO 1 — GAP UP OPENING (100+ Points Above Previous Close)
📍 Expected Open: Above 24,370 (i.e., 24,372+)
📖 What Does a Gap Up Mean?
A Gap Up opening of 100+ points indicates strong overnight buying interest — possibly driven by positive global cues, FII buying, or favorable macro news. However, a large gap up also brings the risk of a "gap fill" — where prices come back down to fill the gap. Smart traders never blindly buy a gap up; they wait for confirmation.
📐 Gap Up — Plan of Action:
🔶 Situation A: Market Opens Above 24,373 (Last Intraday Resistance Zone)
If Nifty opens directly above 24,347–24,373 (red resistance box), this zone now acts as support.
🟢 Bullish Trade Setup:
📍 Wait for the first 15-minute candle to form
📍 If price sustains and consolidates above 24,373 without breaking below
📍 Look for a pullback to 24,347–24,373 zone for a long entry
📍 Entry: 24,355 – 24,373 (on retest)
📍 Target 1: 24,450
📍 Target 2: 24,528 🎯 (Major Red Resistance)
📍 Stop Loss: 24,310 (below opening resistance orange line)
🧠 Educational Note: When previous resistance becomes support, it's called a "role reversal" — one of the most powerful concepts in technical analysis. The dashed teal line on chart shows this possible move upward.
🔶 Situation B: Gap Up But Market Struggles at 24,373 – 24,528 Zone
If Nifty opens in the 24,370–24,400 range but immediately faces selling at the red box (24,347–24,373):
🟠 NO TRADE ZONE — Wait & Watch
📍 This is the Orange zone — sideways or indecision
📍 Do NOT initiate any fresh positions immediately
📍 Watch for at least 2–3 candles to see direction
🔴 If price reverses below 24,318 (Orange Resistance Line):
📍 This becomes a Bull Trap signal
📍 Short Entry: Below 24,315 (after confirmation candle)
📍 Target 1: 24,240
📍 Target 2: 24,166
📍 Stop Loss: 24,375
🧠 Educational Note: A gap up that fails to hold its opening level is called a "Exhaustion Gap" — it signals that buyers are running out of strength. The red dashed arrow on the chart shows this reversal possibility.
🔶 Situation C: Strong Gap Up Above 24,450 (Directly Near Major Resistance)
📍 If market opens near 24,450–24,528, avoid chasing longs
📍 Wait for a pullback — do not buy at highs blindly
📍 Look for short setup near 24,528 with strict SL above 24,545
📍 Short Target: 24,373 → 24,318
⚠️ Tip: Extreme gap ups often lead to intraday reversals. Patience is the key!
✅ Gap Up — Summary Table:
Setup Entry Target 1 Target 2 Stop Loss
🟢 Long (Retest of 24,373) 24,355–24,373 24,450 24,528 24,310
🔴 Short (Fail below 24,318) Below 24,315 24,240 24,166 24,375
🟠 No Trade Zone 24,318–24,373 — — —
➡️ SCENARIO 2 — FLAT OPENING (Within ±50 Points of Previous Close)
📍 Expected Open: 24,220 – 24,320 (Near Previous Close of 24,271)
📖 What Does a Flat Opening Mean?
A flat opening near the previous close suggests market indecision — neither bulls nor bears are in control at the open. This is actually one of the best scenarios for intraday traders because the key levels are clean and price hasn't run away yet. Your job is to identify which side wins the early battle.
The Opening Support Zone (24,215–24,240) and Opening Resistance (24,318) on the chart are your battle lines. 🏳️
📐 Flat Opening — Plan of Action:
🔶 Situation A: Flat Open + Holds Above Opening Support (24,215–24,240)
If Nifty opens flat near 24,250–24,280 and the opening support zone 24,215–24,240 holds in the first 15 minutes:
🟢 Bullish Trade Setup:
📍 Look for a bounce from 24,215–24,240 zone (orange support box on chart)
📍 Entry on bullish 15-min candle closing above 24,260
📍 Entry: 24,260 – 24,275
📍 Target 1: 24,318 (Orange Resistance)
📍 Target 2: 24,347 – 24,373 (Red Resistance Box)
📍 Target 3 (if momentum): 24,528
📍 Stop Loss: 24,200 (below opening support zone)
🧠 Educational Note: The green zigzag line on the chart represents a possible bullish move where price bounces from support and tests resistance levels step by step. This is a classic "staircase bullish pattern" — higher highs and higher lows.
🔶 Situation B: Flat Open + Price Hovers Between 24,240 and 24,318
If Nifty opens flat and price stays stuck between 24,240 and 24,318:
🟠 NO TRADE — Sideways / Consolidation Zone
📍 This is the orange no-trade zone on your chart
📍 Market is in balance — wait for a clear breakout or breakdown
📍 Avoid scalping in this zone — it will chop your positions
📌 Wait for a decisive 15-min candle close above 24,318 OR below 24,215 before taking a trade.
🔶 Situation C: Flat Open + Breaks Below Opening Support (24,215–24,240)
If Nifty opens flat but immediately breaks below 24,215 with a strong bearish candle:
🔴 Bearish Trade Setup:
📍 Breakdown below 24,215 confirms bearish momentum
📍 Entry: Below 24,210 (on confirmation)
📍 Target 1: 24,166 (Last Intraday Support — Green Line)
📍 Target 2: 24,036 (Major Green Support)
📍 Stop Loss: 24,260 (back inside support zone)
🧠 Educational Note: When a support zone breaks, it becomes resistance. The red dashed downward arrow on the chart shows this possible bearish trajectory toward 24,036. This is called a "Support Breakdown" — a high probability short setup.
🔶 Situation D: Flat Open + Breakout Above 24,318 (Orange Resistance)
If price breaks and closes above 24,318 on 15-min timeframe:
🟢 Strong Bullish Signal:
📍 Entry: Above 24,320 (after breakout candle closes)
📍 Target 1: 24,373
📍 Target 2: 24,450
📍 Target 3: 24,528
📍 Stop Loss: 24,275
✅ Flat Open — Summary Table:
Setup Entry Target 1 Target 2 Stop Loss
🟢 Long (Bounce from 24,240) 24,260–24,275 24,318 24,373 24,200
🟢 Long (Breakout above 24,318) Above 24,320 24,373 24,528 24,275
🔴 Short (Break below 24,215) Below 24,210 24,166 24,036 24,260
🟠 No Trade 24,215–24,318 — — —
📉 SCENARIO 3 — GAP DOWN OPENING (100+ Points Below Previous Close)
📍 Expected Open: Below 24,170 (i.e., 24,171 or below)
📖 What Does a Gap Down Mean?
A Gap Down opening of 100+ points indicates strong selling pressure overnight — possibly due to negative global cues, FII selling, or adverse macro/geopolitical events. However, large gap downs can also be buying opportunities if key supports hold. The key is: don't panic, don't sell blindly — wait for confirmation.
With a 100+ point gap down, Nifty would open near or below the Last Intraday Support (24,166), making this a critical decision zone. 🎯
📐 Gap Down — Plan of Action:
🔶 Situation A: Gap Down Opening Near 24,166 (Last Intraday Support — Green Line)
If Nifty opens around 24,100–24,166 zone:
🟢 Potential Reversal / Bounce Trade:
📍 Watch first 15-min candle carefully
📍 If price holds above 24,100 and forms a bullish candle
📍 Entry: 24,130 – 24,150 (on reversal signal)
📍 Target 1: 24,215 (Opening Support zone)
📍 Target 2: 24,271 (Previous close)
📍 Stop Loss: 24,070
⚠️ This is a countertrend bounce — keep position size SMALL. Use it only if a clear reversal candle forms.
🔶 Situation B: Gap Down + Immediate Breakdown Below 24,166
If Nifty opens with a gap down and immediately breaks below 24,166 (green last intraday support line):
🔴 Strong Bearish Trade Setup:
📍 Do NOT try to catch the falling knife — wait for a dead cat bounce
📍 Wait for price to pull back to 24,166 (now resistance)
📍 Short Entry: 24,155 – 24,166 (on failed retest)
📍 Target 1: 24,036 (Major Green Support — Strong Target) 🎯
📍 Target 2: 23,950 (if momentum continues)
📍 Stop Loss: 24,210
🧠 Educational Note: The red dashed line arrow on chart shows this exact bearish scenario — price falls through support and heads toward 24,036. This is a "Support-to-Resistance Flip" trade — a textbook short setup in technical analysis.
🔶 Situation C: Gap Down But Quick Recovery Above 24,215
If Nifty gaps down but within 30 minutes recovers back above 24,215 (opening support zone):
🟢 Gap Fill Rally Setup:
📍 This signals that sellers are weak and buyers are absorbing the gap
📍 Entry: Above 24,220 (after recovery candle closes)
📍 Target 1: 24,271 (Previous close)
📍 Target 2: 24,318 (Orange Resistance)
📍 Stop Loss: 24,170
🧠 Educational Note: This is called a "Gap Fill" scenario — where the market rapidly recovers from its gap down and moves back toward the previous close. The teal dashed upward arrow on chart hints at this bullish recovery path.
🔶 Situation D: Extreme Gap Down (Below 24,036 — Major Support)
If Nifty opens below 24,036 (green major support line):
🟠 NO TRADE — Extreme Caution Zone
📍 Wait for at least 30–45 minutes before taking any trade
📍 Let the market settle — volatility will be extreme
📍 Watch for VIX levels — if VIX spikes, options premiums will be expensive
📍 Look for stability and then plan accordingly
✅ Gap Down — Summary Table:
Setup Entry Target 1 Target 2 Stop Loss
🟢 Bounce (Hold at 24,166) 24,130–24,150 24,215 24,271 24,070
🔴 Short (Break below 24,166) 24,155–24,166 24,036 23,950 24,210
🟢 Long (Gap Fill above 24,215) Above 24,220 24,271 24,318 24,170
🟠 No Trade Below 24,036 — — —
💡 RISK MANAGEMENT TIPS FOR OPTIONS TRADING
"Options can make you rich in a day — or wipe you out in an hour. Respect the instrument." 🙏
📌 Tip 1 — Never Risk More Than 1–2% Per Trade
📍 If your capital is ₹1,00,000 — your max loss per trade should be ₹1,000–₹2,000
📍 Options can go to zero. Always define your max loss before entering.
📌 Tip 2 — Avoid Buying Options in the First 15 Minutes
📍 The first 15 minutes are the most volatile
📍 Options premiums are highest (inflated IV) at open
📍 Wait for price to settle near a key level before buying options
📌 Tip 3 — Use ATM Options for Directional Trades
📍 For intraday directional trades (Gap Up/Down scenarios), prefer ATM (At The Money) options
📍 They have the best delta-to-premium ratio
📍 Avoid deep OTM options — they are lottery tickets, not trades
📌 Tip 4 — Time Decay is Your Enemy (If You're a Buyer)
📍 If you're buying options on weekly expiry day — every minute works against you
📍 Plan quick trades with defined targets — do not hold losing positions
📍 Exit by 2:30 PM at latest on expiry day — theta crush is brutal post 2:00 PM
📌 Tip 5 — Use Spreads to Reduce Cost and Risk
📍 Instead of buying a naked call/put, consider a Bull Call Spread or Bear Put Spread
📍 Example (Gap Up scenario): Buy 24,400 CE + Sell 24,500 CE
📍 This reduces premium cost and limits max loss
📌 Tip 6 — Never Average a Losing Options Position
📍 If your option is down 30–40% from your buying price — exit
📍 Averaging down on options is a dangerous habit — time decay makes it worse
📌 Tip 7 — Respect the Orange (No Trade) Zone 🟠
📍 When price is in the orange zone (24,240–24,318 on chart), avoid trading options
📍 Premium decay without movement = guaranteed loss for option buyers
📌 Tip 8 — Position Sizing Based on Scenario Confidence
📍 High confidence trade (clear breakout/breakdown with volume): 2 lots
📍 Medium confidence trade (bounce/reversal play): 1 lot
📍 Low confidence / news-driven: 0 lots — sit on hands
📌 Tip 9 — Set a Daily Stop Loss
📍 Decide before market open: "If I lose ₹X today, I stop trading."
📍 Stick to it. No exceptions. No revenge trading.
📌 Tip 10 — VIX Watch 👁️
📍 If India VIX is above 15 — options are expensive, prefer selling strategies or tighter entries
📍 If India VIX is below 12 — options are cheaper, buying strategies work better
📋 SUMMARY & CONCLUSION
🎯 Key Levels Recap:
Level Value Significance
🟥 Major Resistance 24,528 Ultimate bull target today
🟥 Resistance Zone 24,347 – 24,373 Previous intraday supply
🟠 No Trade / Opening Resistance 24,318 Indecision zone
⚪ Previous Close 24,271.60 Reference point
🟨 Opening Support Zone 24,215 – 24,240 Key demand zone
🟩 Last Intraday Support 24,166 Critical support
🟩 Major Support 24,036 Bearish target if breakdown
📝 Conclusion:
Nifty 50 enters Monday's session at 24,271.60 — sitting exactly between two important levels: the Opening Support Zone (24,215–24,240) below and the Opening Resistance (24,318) above. This creates a well-defined range for the first hour of trading.
🟢 Bulls need to: Break and hold above 24,318 → then target 24,373 → 24,450 → 24,528
🔴 Bears need to: Break below 24,215 → then target 24,166 → 24,036
🟠 In between (24,215–24,318): Respect the no-trade zone. Do not force trades. Let the market show its hand first.
The dashed lines on the chart remind us — trends are possible, not guaranteed. Trade what you SEE, not what you THINK will happen. 📊
Remember:
✅ Wait for confirmation
✅ Trade with defined risk
✅ Protect your capital above all
✅ One good trade is better than ten random ones
"The market gives opportunity every day — your job is to be ready, be disciplined, and be patient." 🧘
⚠️ DISCLAIMER
This trading plan is purely for educational and informational purposes only. The levels and scenarios mentioned are based on technical analysis of the chart and are subject to change based on market conditions.
I am NOT a SEBI Registered Research Analyst. This is NOT investment advice, NOT a buy/sell recommendation, and should NOT be treated as financial advice of any kind.
Trading in equity markets, futures, and options involves substantial risk of loss. Past performance is not indicative of future results. Please consult a SEBI Registered Investment Advisor before making any trading or investment decisions.
Trade at your own risk. The author holds no responsibility for any profit or loss arising from the use of this information.
📌 If you found this plan helpful, please Like 👍, Follow 🔔 and Share with fellow traders!
💬 Drop your views in the comments below — let's learn together!
Advanced Options TradingIn options trading, institutional traders usually have advantages over retail traders because they have access to better technology, market data, and experienced analysts. Institutions often use options to hedge portfolios, manage market exposure, and improve investment returns. For example, a fund manager may buy put options to protect investments during uncertain market conditions. Their trading strategies are usually more disciplined and data-driven compared to individual investors.
Option TradingPCR (Put-Call Ratio) – Institutional Trading Strategy
What is PCR?
PCR = Put OI ÷ Call OI
It shows market sentiment of big players in indices like NIFTY 50.
Institutional Psychology
2. How Big Players Use PCR
Retail buys options randomly
Institutions control PCR zones to trap traders
👉 You follow PCR = You follow smart money
📈 PCR Levels (Game Changer)
3. Key Zones
PCR < 0.7 → Bearish sentiment (too many Calls) → ⚠️ Reversal possible
PCR 0.7 – 1 → Neutral zone
PCR > 1.2 → Bullish sentiment (too many Puts) → ⚠️ Reversal possible
Institution Option TradingPCR means Put Call Ratio
It tells us how many Put options and Call options people are buying or trading.
Why it matters for institution trading
Big players mostly use options. So PCR helps us understand what big money may be thinking.
If PCR is high
More puts than calls.
Means traders are scared or taking protection.
Sometimes big players expect weakness.
If PCR is low
More calls than puts.
Means confidence in upside.
Sometimes market is bullish.
Why learn this
Price only shows movement.
PCR shows mindset behind movement.
Institutions think different
J&K Bank: A Healthy Pause or the Next Leg Higher?After a strong impulsive advance, J&K Bank appears to be entering a potential Wave (iv) correction.
The broader trend remains constructive, but this is the stage where patience becomes more valuable than prediction. If the current consolidation is indeed corrective, it could provide the foundation for the next impulsive move rather than signal a change in trend.
In strong markets, the best opportunities often emerge after the correction—not during the excitement of the rally.
For now, I'm watching how price behaves during this pullback. The character of the correction should reveal more than the rally itself.
Educational purpose only. Not investment advice.
NIFTY50 Elliott Wave Analysis | Triangle Pattern in Progress?In this post, I share my current Elliott Wave outlook for NIFTY based on the possibility of a large Wave (4) Triangle formation.
Current Scenario:
✅ Wave A, B and C appear to be completed.
✅ Wave C may have already ended near the recent low.
🔍 The market could now be developing Wave D, followed by a final Wave E before the larger trend resumes.
📈 A move towards the upper trendline is possible if this count remains valid.
Invalidation Levels:
❌ Above: 26,373.20
❌ Below: 21,758.40
A decisive breakout beyond either level would invalidate this triangle count, and the wave structure would need to be reassessed.
⚠️ Disclaimer:
This analysis is based on Elliott Wave probabilities, not predictions. Markets are dynamic, and alternate wave counts are always possible. Always manage your risk and follow your own trading plan.
📊 My channel is a public trading journal where I document my market analysis in real time.
No hindsight. No cherry-picked charts. Just my evolving thought process and Elliott Wave perspective.
If you enjoy objective market analysis:
👍 Like the POST
💬 Share your wave count in the comments
🔔 Subscribe for regular NIFTY and Bank Nifty Elliott Wave updates.
#Nifty #Nifty50 #ElliottWave #StockMarket #Trading #TechnicalAnalysis #WaveAnalysis #PriceAction #IndianStockMarket #NSE #SwingTrading #MarketAnalysis
Price Lied, RSI WhisperedThe Lower Low in Market Structure
Marked in yellow is a lower low. In basic market structure, when price makes a lower high followed by a lower low, it signals that the prevailing trend is pointing downward. Sellers are in control, and the structure confirms it visually
The RSI and How I Use It
At the bottom of the chart sits the RSI, the Relative Strength Index. It is a momentum oscillator that measures the speed and magnitude of price movements on a scale of 0 to 100.
The conventional way of using RSI is well known. Above 70 is considered overbought, a potential sell signal. Below 30 is considered oversold, a potential buy signal. Many traders use it this way and build entire strategies around those two numbers.
I don't.
In my trading journey, indicators have taken a back seat. Volume and EMA on higher timeframes do most of the heavy lifting. RSI only enters the picture for me in one specific scenario, and that is divergences. Not levels. Not overbought or oversold readings. Divergences only.
The Bullish Divergence Hidden Here
This is where the chart gets interesting. Price has made a strong, clear lower low. Market structure confirms it. Sellers look completely in control. But look at the RSI at the same time.
While price printed a lower low, RSI printed a higher low.
Price and momentum are telling two completely different stories. That disconnect is called a bullish divergence. The price action looks weak. But the momentum underneath it is quietly strengthening. This mismatch between what price is doing on the surface and what RSI is reflecting beneath it is one of the more thought provoking observations you can make on a chart.
It doesn't mean price will reverse. It doesn't mean anything is confirmed. It simply means the selling momentum, despite what the candles look like, was not as strong as the previous leg down.
Disclaimer: This post is purely educational and observational in nature. RSI divergence observations shared here are based on personal experience and chart reading habits and do not constitute financial advice, a forecast, or a recommendation to buy, sell, or hold any security.
Bank of Maharashtra: Preparing for the Final Leg 🚀 Bank of Maharashtra: Preparing for the Final Leg of Wave (V)?
The monthly chart continues to exhibit a strong long-term bullish structure. The stock has completed a healthy Wave (IV) correction and appears to be advancing in Wave (V), with prices trading comfortably above the 20-, 50-, and 200-month moving averages.
Key Technical Highlights:
✅ Elliott Wave structure indicates Wave (V) is in progress.
✅ Price is trading above all major moving averages, confirming the primary uptrend.
✅ RSI is around 70, reflecting strong momentum without any major bearish divergence yet.
✅ The stock has broken out of the Wave (IV) trendline and is holding above key support.
⚠️ Immediate resistance lies near the ₹92–93 pivot zone. A decisive monthly close above this level could trigger the next leg higher.
Trading Strategy
Entry: ₹89–93 (or on a monthly close above ₹93)
Stop Loss: ₹76.50 (monthly closing basis)
Target 1: ₹100
Target 2: ₹110
Target 3: ₹125 (extended Wave V target)
Time Frame: 6 Months
Risk–Reward: Approximately 1:2 to 1:3 for positional investors.
Conclusion: As long as the stock sustains above ₹76.5, the long-term trend remains firmly bullish. A breakout above ₹93 could mark the beginning of the strongest phase of Wave (V), making Bank of Maharashtra an attractive medium- to long-term positional opportunity.
XAUUSD: Weekly recovery may continue from buy zone.Gold is showing a stronger recovery structure after reacting from the lower area near 3,960–4,000. From Kelly’s view, the market is now trying to build a bullish continuation setup for next week, with price holding above the buy zone and pushing back towards the Fibonacci target area.
The key idea is simple: gold still needs confirmation, but the current structure supports a potential recovery move if the buy zone continues to hold.
⟡ Market structure
The chart shows gold completed a strong bearish move before finding support around the lower base. After that, price started to form higher lows and a cleaner recovery structure.
Gold is now trading around 4,175 after breaking back above the short-term recovery area. The nearest buy zone sits around 4,090–4,120, and as long as price holds above this area, the bullish recovery view remains active.
The first important upside target is the 4,260–4,285 Fibonacci area. If momentum continues next week, gold may extend towards 4,330 and 4,395.
➤ Key levels
◌ 4,090–4,120: buy zone and key weekly support
◌ 4,175: current reaction area
◌ 4,219: first confirmation resistance
◌ 4,260–4,285: Fibonacci target zone
◌ 4,330: next upside resistance
◌ 4,395: higher weekly target
◌ Below 4,090: area where the recovery setup weakens
⌁ Elliott Wave view
From an Elliott Wave perspective, gold appears to be developing a new bullish recovery sequence after completing the previous bearish wave structure.
The current move may be forming the early stages of a 5-wave recovery. Price has already built a base, created the first upside leg, and is now trying to hold above the buy zone before the next wave expands higher.
If gold holds the 4,090–4,120 area, wave 3 may continue towards the Fibonacci target around 4,260–4,285. After that, a short pullback could form wave 4 before wave 5 attempts to reach the higher resistance area near 4,330–4,395.
▸ Trading scenario
Preferred scenario: wait for price to hold above the buy zone and confirm bullish continuation.
Entry zone: 4,090–4,120 if bullish confirmation appears
Stop loss: below the confirmed reaction low or below 4,060
Take profit 1: 4,219
Take profit 2: 4,260–4,285
Take profit 3: 4,330
Take profit 4: 4,395 if wave 5 expands strongly
Alternative scenario: if gold breaks below 4,090 and fails to reclaim the buy zone, the recovery structure weakens. In that case, price may return to the lower base before building a new bullish setup.
⌁ Kelly’s view
For Kelly, this is a bullish recovery structure for next week, but not a reason to chase price blindly. The cleanest setup comes from a controlled pullback into the buy zone, followed by confirmation that buyers are still defending the structure.
Gold is trying to recover from the lower base.
If the buy zone holds, the next weekly move may continue towards the Fibonacci targets above.
Share your view below.
Advanced Info Service, Triangle Pattern Target, Gain +20% PROFITAdvanced Info Service, Triangle Pattern formed and Breakout above the Pattern. So the Next Target is 333 THB. Offering a Potential Profit of +20% ROI. Can you Guess the "Second Target"???.
I want to help People to Make Profit all over the "World".
State Bank of IndiaKey support levels
₹1,022–1,025: Immediate support
₹1,010: Strong support
₹998–1,000: Major support; a break below this would weaken the trend.
Key resistance levels
₹1,045–1,046: Immediate resistance
₹1,055–1,058: Strong resistance
₹1,069–1,070: Major breakout level.
Technical analysis
RSI is around 58, indicating positive momentum without being overbought.
MACD remains bullish, suggesting buyers still have control.
The stock recently closed around ₹1,040 after a mild pullback and remains below its 52-week high of ₹1,234.80.
Trading view
Above ₹1,046: Momentum can extend toward ₹1,055 and then ₹1,070.
Between ₹1,022 and ₹1,046: Likely to remain range-bound.
Below ₹1,022: Selling pressure may increase toward ₹1,010 and ₹1,000.
If you're trading intraday, swing trading, or investing for the long term, let me know your timeframe and your entry price, and I'll provide a more specific strategy with target and stop-loss levels.
ICICI Bank – Technical AnalysisICICI Bank is trading above its key moving averages and continues to show positive momentum. Recent technical indicators (RSI, MACD, ADX) remain constructive, suggesting the primary trend is still up.
📈 Key Resistance Levels
₹1,420–1,430 – Immediate resistance zone
₹1,450–1,470 – Strong supply zone
₹1,495–1,500 – Major resistance / 52-week high area
📉 Key Support Levels
₹1,390–1,380 – First support
₹1,360–1,345 – Strong demand zone
₹1,320–1,325 – Major swing support
Trading Scenarios
🟢 Bullish
Holding above ₹1,380–1,390 keeps the uptrend intact.
A decisive breakout above ₹1,430 can open the way toward ₹1,470–1,500.
🔴 Bearish
A close below ₹1,360 could trigger profit booking.
Below ₹1,325, the trend would weaken and a deeper correction becomes possible.
Swing Trading Plan
Buy Zone: ₹1,370–1,390
Stop Loss: Below ₹1,345 (closing basis)
Targets: ₹1,430 → ₹1,470 → ₹1,500
Overall View: ICICI Bank remains one of the stronger banking stocks. As long as it stays above the ₹1,360 support zone, the trend favors buying on dips rather than selling rallies.