The Most Dangerous Candle Is Often the One Everyone LikesA large bullish or bearish candle is one of the most attractive things on a chart. When traders see a strong green candle breaking a resistance level, the immediate thought is often, “The trend has started.” When a large red candle breaks support, many immediately expect further downside. The candle looks powerful, clean and convincing. But sometimes, that is exactly what makes it dangerous.
The problem is not the candle itself. The problem is what happens after everyone notices it. A strong candle attracts attention because it shows urgency. Traders who were waiting for confirmation enter late, breakout traders jump in, and traders who were on the opposite side may rush to exit. This sudden increase in participation can push price even further, making the move look stronger than it really is.
A Strong Candle Can Hide Weak Positioning
Imagine a stock has been moving sideways for several days. Suddenly, a huge green candle breaks above the range. The candle closes near its high, volume increases and everything looks bullish.
A trader who sees this for the first time may think the safest decision is to buy immediately.
But there is an important question to ask:
Who is buying at this point?
Some traders may have bought much earlier near the bottom of the range. They are already sitting on profits. New buyers, however, are entering after price has already moved significantly.
This creates an interesting situation. The candle may represent genuine buying, but it may also become the point where late buyers enter just before existing holders start taking profits.
That is why a strong candle should not automatically be treated as a signal to enter.
The Candle Is Information, Not Confirmation
One of the biggest mistakes traders make is treating one candle as a complete story.
A candle only tells us what happened during a particular period. It does not tell us what will happen next.
A large breakout candle tells us that buyers were aggressive during that period. It does not guarantee that buyers will remain aggressive afterward.
The next few candles are often more important.
If price breaks resistance and continues holding above it, the breakout becomes more convincing. But if price quickly falls back below the breakout level, the meaning of that original candle changes completely.
What looked like strength may have been a trap.
The Real Danger Comes From Chasing
There is nothing wrong with buying a breakout. The danger comes from buying simply because the candle looks impressive.
This is where emotions take over.
A trader sees price moving quickly and feels that waiting means missing the opportunity. The candle becomes bigger, the fear of missing out becomes stronger, and the trader enters without thinking about where the trade is invalidated.
Ironically, the stronger the candle looks, the more tempting it can be to chase.
Good trading is often about doing the opposite: when everyone is excited, slow down and examine the structure.
Ask where price was before the candle appeared. Ask whether the breakout is happening from an important level. Ask whether the candle is closing outside the range or merely pushing through it temporarily.
These questions are more useful than simply asking whether the candle is bullish or bearish.
Watch What Happens After the Candle
The candle itself is not the final signal. The reaction after it is often more valuable.
Suppose a stock produces a massive bullish candle above resistance. Instead of buying immediately, watch what happens next.
If price pulls back slightly, holds the breakout area and then starts moving higher again, the market is showing that buyers are willing to defend the new level.
But if price quickly falls back into the previous range, the breakout deserves much more suspicion.
The same logic works on the downside.
A huge red candle breaking support may look extremely bearish. But if price immediately recovers and closes back above the broken support, the breakdown may have simply collected stop-loss orders before reversing.
This is why the candle after the big candle can sometimes tell you more than the big candle itself.
Look at the Location, Not Just the Candle
A large candle in the middle of nowhere is not the same as a large candle appearing at an important market structure.
This is one of the simplest ways to improve candle analysis.
A huge bullish candle after a long decline and near a major support zone has a different meaning from a huge bullish candle that appears after price has already rallied sharply into resistance.
The shape may be almost identical.
The context is completely different.
Instead of asking:
“Is this a strong candle?”
Ask:
“Where did this strong candle appear?”
That small change in thinking can prevent many impulsive trades.
Sometimes the Best Trade Is the Second Move
You do not have to catch the first move.
This is something many traders struggle to accept.
Markets give multiple opportunities. If a huge candle breaks a level, you can wait for the market to prove whether that breakout is genuine.
Sometimes price will retest the broken level. Sometimes it will form a small consolidation above it. Sometimes it will completely reject the breakout.
Waiting may mean entering at a slightly higher or lower price than the first candle, but you may gain something much more valuable: **better information**.
The goal is not to enter as early as possible.
The goal is to enter when the probability and risk make sense.
The Lesson:
A powerful candle deserves attention, but it does not automatically deserve a trade.
The most dangerous candle can sometimes be the one that looks perfect because it creates the strongest emotional reaction. Everyone sees it. Everyone talks about it. Everyone wants to participate.
That is exactly when a trader should stop and ask what the market is actually doing.
A candle is only one piece of information. Its location, the preceding structure, volume, follow-through and reaction around the breakout level all matter.
Don't trade the candle because it looks strong. Trade the story behind the candle.
The market does not reward the trader who reacts fastest to every impressive candle. It rewards the trader who understands why that candle appeared and what price does next.  Education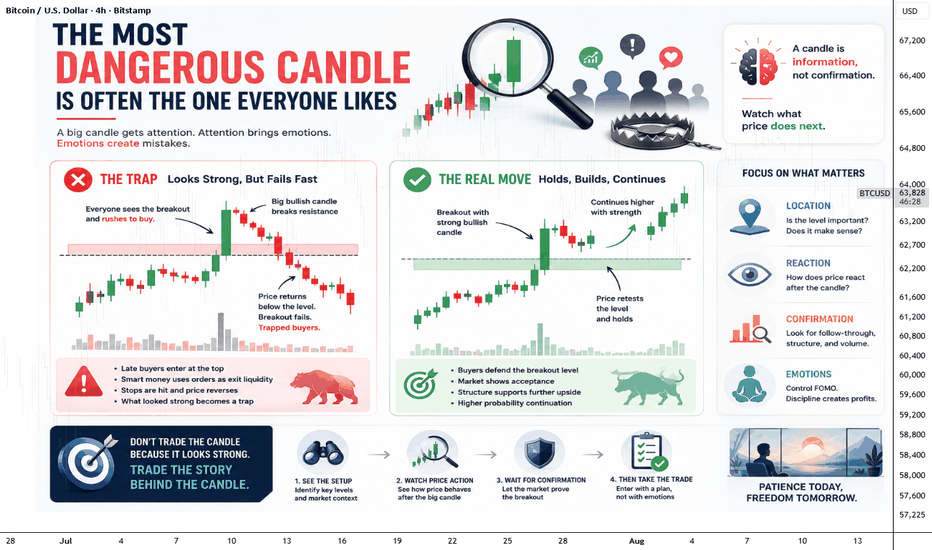
 Long
Long
BRIAN XAUUSD – GOLD HOLDS HIGH VALUE, BUT THE NEXT PULLBACKBRIAN XAUUSD – GOLD HOLDS HIGH VALUE, BUT THE NEXT PULLBACK MATTERS
Gold reacted strongly after the July inflation report came in line with expectations. Price pushed nearly 1% higher and continued to hold near the 4,400 area, trading around its highest level since early June.
At first glance, this looks clearly bullish. But the deeper market story is more interesting.
The CPI data did not remove the Fed risk completely. It only gave the market a reason to delay expectations for a September rate hike. The probability of a September move dropped quickly, but the risk for October and December is still not gone.
That means gold has already priced in a softer Fed path, while the market has not fully removed the tightening risk.
So now the chart becomes very important.
Technical structure
On the H1 chart, gold is still holding a bullish structure after reclaiming higher value.
Price is currently pulling back from the VAH Resistance Zone around 4,405 - 4,415. This zone is acting as short-term resistance after the CPI reaction.
The first key support is the POC Acceptance Zone around 4,355 - 4,365. If buyers defend this area, gold can build another push back towards the weekly high near 4,435.
Below that, the Lower Value Buy Zone around 4,310 - 4,320 is the deeper support where buyers may reload if the market needs a stronger correction.
Important zones
VAH Resistance Zone: 4,405 - 4,415
Short-term resistance where price is currently reacting.
POC Acceptance Zone: 4,355 - 4,365
Main value support and first buy-reaction area.
Lower Value Buy Zone: 4,310 - 4,320
Deeper support if gold corrects harder.
Weekly high: 4,435
Main breakout level buyers need to reclaim.
Target zone: 4,460 - 4,470
Next upside liquidity target if buyers break the weekly high.
Trading scenario
Buy reaction from POC Acceptance Zone 4,355 - 4,365
Entry:
Look for buy positions only if price pulls back into 4,355 - 4,365 and shows clear bullish rejection.
Stop Loss:
Below the POC Acceptance Zone or below the local sweep low.
Take Profit:
TP1: 4,405 - 4,415
TP2: 4,435
TP3: 4,460 - 4,470 if buyers break the weekly high with strength
This setup follows the current bullish value structure, but avoids chasing gold directly into resistance.
Final view
Gold is still strong, but the market is not completely risk-free.
The CPI reaction helped buyers, but Fed rate-hike risk has only been delayed, not fully removed. That is why I want to see whether price can hold value on the pullback.
If 4,355 - 4,365 holds, gold can retest 4,435 and possibly extend towards 4,460 - 4,470.
If this zone fails, the market may rotate deeper towards 4,310 - 4,320 before buyers return.
Gold is bullish above value.
But the next clean entry depends on the retest.
Will buyers defend the POC zone, or will CPI optimism fade into a deeper correction?
 Short
Short
XAUUSD: Bulls Defend 4,400, 4,450 Is the Next Battle XAUUSD: Bulls Defend 4,400, 4,450 Is the Next Battle
Market Context
Gold is trading around 4,396 after returning to test the 4,400 area while the market waits for the next US inflation catalyst: PPI.
The latest CPI data came in softer and matched expectations, helping reduce September Fed rate-hike bets. This triggered pressure on the US Dollar and Treasury yields, giving gold more support toward the upside.
However, price is now sitting near a short-term decision zone. The bullish trend is still active, but buyers need to defend 4,385 - 4,400 before the next push toward 4,440 - 4,450 can continue.
Key point: gold remains bullish, but 4,400 is the line buyers must protect.
Technical Structure
Gold is still trading inside a bullish structure after multiple BOS signals and strong upside continuation from the lower demand zones.
The current price is reacting inside the Buyer Hold Zone around 4,385 - 4,400. This is the nearest support area. If buyers hold this zone, gold can attempt another push toward the Upper Supply Zone at 4,418 - 4,440.
Above that, 4,440 - 4,450 is the liquidity peak. A clean breakout above this area would confirm stronger bullish continuation and may open the path toward higher targets.
If 4,385 - 4,400 fails, gold may correct deeper toward the Main Demand Zone around 4,360 - 4,370. Losing 4,360 would weaken the short-term trend and increase the chance of a retest toward 4,315 - 4,335.
Key Levels
Current Price: 4,396
Buyer Hold Zone: 4,385 - 4,400
Upper Supply Zone: 4,418 - 4,440
Liquidity Peak: 4,440 - 4,450
Main Demand Zone: 4,360 - 4,370
Deep Demand Zone: 4,315 - 4,335
Bullish Continuation Trigger: Above 4,450
Bearish Correction Trigger: Below 4,360
Trading Plan
Buy Scenario
Entry: 4,385 - 4,400
SL: Below 4,360
TP: 4,418 / 4,440 / 4,450
Condition: Price must hold the Buyer Hold Zone and show clear bullish confirmation. Buyers need to defend 4,400 with strength before continuation becomes valid.
Buy Breakout
Entry: Above 4,450 after breakout + retest
SL: Below 4,418
TP: 4,470 / 4,500 / 4,520
Condition: Price must break the liquidity peak with strong momentum, retest successfully, and continue forming higher lows. No chasing the first breakout candle without confirmation.
Sell Reaction
Entry: 4,418 - 4,440
SL: Above 4,460
TP: 4,400 / 4,385 / 4,370
Condition: Price reaches the Upper Supply Zone and shows bearish rejection. This is only a short-term reaction sell, not the main bias unless gold later breaks below 4,360.
Deep Pullback Buy
Entry: 4,360 - 4,370
SL: Below 4,315
TP: 4,400 / 4,418 / 4,440
Condition: If gold loses the first support and pulls back deeper, this zone becomes the cleaner re-entry area. Wait for strong rejection before considering a buy.
Breakdown Sell
Entry: Below 4,360 after breakdown + retest
SL: Above 4,400
TP: 4,335 / 4,315 / 4,300
Condition: Price loses Main Demand and fails to reclaim it. This would confirm that the bullish structure is weakening and a deeper correction may begin.
Overall Bias
Gold remains bullish while price holds above 4,385 - 4,400. The softer CPI data supports the recovery, but PPI is the next catalyst that can decide whether buyers continue toward 4,450 or the market pulls back first.
If 4,400 holds, the next target is 4,418 - 4,440, followed by 4,450 liquidity. A clean breakout above 4,450 can open the way toward 4,500.
If 4,400 fails, the market may need a deeper reset toward 4,360 - 4,370 before the next decision.
Best approach: follow the bullish structure, but wait for confirmation. Do not chase price directly into supply.
Will buyers defend 4,400 and break 4,450, or will PPI trigger one deeper pullback first? Long 
XAUUSD: Bulls Hold 4,400, 4,500 Comes Into Focus XAUUSD: Bulls Hold 4,400, 4,500 Comes Into Focus
Market Context
Gold is trading around 4,399 as buyers continue to defend the short-term bullish structure. Price is now testing the 4,400 area again while the market waits for key US inflation data.
The US Dollar remains stuck in a narrow range as traders balance US-Iran uncertainty, elevated oil prices, and fading expectations for a September Fed rate hike. This mixed macro backdrop keeps gold supported, but also makes the next breakout highly dependent on confirmation.
The daily structure still points toward a possible test of the 200-day SMA near 4,500, with RSI supporting the bullish recovery. However, price is already close to short-term resistance, so execution matters.
Key point: gold remains bullish above 4,360 - 4,375, but buyers need to break 4,425 - 4,435 to unlock the next upside leg.
Technical Structure
Gold is moving inside a clean upward trend after a strong bullish expansion from the lower base. The chart shows higher highs, higher lows, BOS signals, and price still respecting the upper trendline structure.
The 4,400 level is now the psychological decision area. Staying above this level keeps bullish pressure active, but the real breakout zone is 4,425 - 4,435.
If buyers break through 4,425 - 4,435 with strength, gold may continue toward the next resistance at 4,450 - 4,470. Above that, the bigger market focus shifts toward 4,500.
The nearest support is 4,360 - 4,375. This is the Immediate Buy Reaction zone. If price pulls back and holds there, buyers may attempt another push higher.
Below that, 4,315 - 4,335 is the Main Reload Zone. Losing 4,360 would not fully break the trend, but it would increase the chance of a deeper pullback into this reload area.
Key Levels
Current Price: 4,399
Nearest Peak / Breakout Zone: 4,425 - 4,435
Target Resistance: 4,450 - 4,470
Psychological Target: 4,500
Immediate Buy Reaction: 4,360 - 4,375
Main Reload Zone: 4,315 - 4,335
Structure Base Demand: 4,225 - 4,250
Bullish Continuation Trigger: Above 4,435
Correction Risk: Below 4,360
Trading Plan
Buy Pullback
Entry: 4,360 - 4,375
SL: Below 4,335
TP: 4,400 / 4,425 / 4,450
Condition: Price must pull back into the Immediate Buy Reaction zone and show clear bullish rejection. Buyers need to defend 4,360 to keep the short-term trend healthy.
Buy Breakout Continuation
Entry: Above 4,435 after breakout + retest
SL: Below 4,400
TP: 4,450 / 4,470 / 4,500
Condition: Price must break 4,425 - 4,435 with strength, retest successfully, and hold above the breakout zone. Avoid chasing the first candle into resistance without confirmation.
Deep Reload Buy
Entry: 4,315 - 4,335
SL: Below 4,250
TP: 4,360 / 4,400 / 4,435
Condition: If price loses 4,360 and corrects deeper, this becomes the cleaner re-entry zone. Look for strong bullish reaction before considering continuation.
Sell Reaction
Entry: 4,450 - 4,470
SL: Above 4,500
TP: 4,435 / 4,400 / 4,375
Condition: Price reaches target resistance and shows bearish rejection. This is only a reaction sell, not the main bias, unless gold later breaks below 4,360.
Breakdown Sell
Entry: Below 4,360 after breakdown + retest
SL: Above 4,400
TP: 4,335 / 4,315 / 4,250
Condition: Price loses the Immediate Buy Reaction zone and fails to reclaim it. This would confirm a short-term correction toward the Main Reload Zone.
Overall Bias
Gold remains bullish while price holds above 4,360 - 4,375. The structure is still strong, but price is now close to the next breakout zone, so chasing the high is not ideal.
If buyers break 4,425 - 4,435, the next upside path opens toward 4,450 - 4,470 and possibly 4,500.
If 4,360 fails, gold may need a deeper reload toward 4,315 - 4,335 before the next bullish attempt.
Best approach: follow the trend, but wait for confirmation. Either buy a clean pullback into support or wait for a confirmed breakout above 4,435.
Will buyers break 4,435 and drive gold toward 4,500, or will CPI trigger one deeper pullback first?
Long 
XAUUSD 4400 hold — 4450 still the bait XAUUSD 4400 hold — 4450 still the bait
That 4,400 reclaim is not dead yet.
Gold got rejected near 4,450, pulled back, and now it’s sitting right back around the buyer hold zone. This is where the chart gets interesting.
Not because it’s clean.
Because it’s messy enough to trap both sides.
We already had the bigger bullish leg. BOS after BOS. Buyers defended structure, pushed price higher, then price started ranging under the high. Now gold is testing the 4,385 - 4,400 zone again. If buyers are still in control, they should not let this area break too easily.
The macro side is also sitting right on the edge. CPI came in soft, so the market started pricing less heat from inflation. Now everyone is waiting for PPI. That data can either confirm the cooling story or shake the whole move hard. So yeah, volatility risk is real.
Main bias stays bullish while gold holds above 4,357.
The first job is simple: defend 4,385 - 4,400. If price holds there and pushes back above 4,429, then 4,450 becomes the next liquidity target. Above that, 4,500 is still sitting there like the big magnet.
Trading scenario:
Buy idea only if gold holds the 4,385 - 4,400 buyer zone and gives a clean reaction back above 4,410.
Entry zone: 4,385 - 4,410 after confirmation
Deeper buy zone: 4,357 - 4,370 if price sweeps lower and reclaims
Stop loss: below 4,320
TP1: 4,429
TP2: 4,450
TP3: 4,500
No hold, no buy. Don’t chase candles before PPI.
If gold closes hard below 4,357, this bullish idea gets messy fast. Then price can slide back toward the main demand zone around 4,315 - 4,325.
For now, I’m reading this as pullback into buyers, not full reversal.
You think 4,400 holds, or does PPI force one deeper sweep first?
Short 
 Long
Long
LTM Looks Interesting || 4,784 is The Key Level To Watch ||A Classic Elliott Wave Reversal Setup. 🌊
LTM has once again bounced from a strong multi-year demand zone, the same level that has repeatedly attracted aggressive buying in the past. From an Elliott Wave perspective, the ongoing correction appears to be approaching completion, making this an interesting chart to monitor.
🔍 Elliott Wave Perspective
The chart suggests that LTM has completed a Double Three (W-X-Y) corrective pattern.
Wave (W): First corrective decline into the major support zone.
Wave X: Recovery rally before the next corrective phase.
Wave (Y): Final corrective leg, once again ending at the same historical demand area.
The repeated defense of this support increases the probability that the larger correction may be complete.
📌 Strong Historical Demand Zone
One of the strongest observations on this chart is how consistently buyers have defended the same support.
✅ Major reversal in 2022.
✅ Another strong reversal during 2025.
✅ Current price has once again reacted positively from the same demand zone.
When price repeatedly respects the same level over several years, that area becomes technically very significant.
✅ First Bullish Confirmation
Although the support looks promising, confirmation is still required.
The first bullish signal will be a decisive breakout above ₹4,784.
Until then, this remains a recovery attempt rather than a confirmed uptrend.
Once this level is reclaimed, market structure begins to shift in favor of the bulls.
🎯 Potential Upside Roadmap
If ₹4,784 is successfully reclaimed and sustained, the next important levels become:
₹6,400 Zone: Previous swing resistance where sellers have repeatedly entered the market.
₹7,300–₹7,600 Supply Zone: A major long-term resistance area that has rejected price multiple times in the past.
This upper zone is likely to witness profit booking and could become a strong obstacle before any larger breakout.
❌ Invalidation
After a confirmed breakout above ₹4,784, the bullish Elliott Wave count remains valid as long as price holds above ₹3,528.
A sustained move below this level would invalidate the current bullish scenario and require a fresh wave count.
📈 Trading Plan
Bullish Confirmation: Above ₹4,784
Invalidation: Below ₹3,528 (after confirmation)
Resistance 1: Around ₹6,400
Resistance 2: ₹7,300–₹7,600
The chart is currently at an attractive location from a risk-reward perspective. However, support alone is not enough—confirmation is essential. Let the market prove its strength before expecting a sustained rally.
Warning ⚠
This analysis is for educational purposes only and represents an Elliott Wave interpretation, not financial advice.
#LTM #ElliottWave #DoubleThree #TechnicalAnalysis #PriceAction #SwingTrading #PositionalTrading #TradingView #StockMarket #NSE #SupportAndResistance #WaveAnalysis #Investing #ChartAnalysis #DIVISLAB #ElliottWave #RunningTriangle #TriangleBreakout #SwingTrading #PositionalTrading #StockMarket #NSE #TechnicalAnalysis #TradingView #PriceAction #WaveAnalysis #Investing #ChartAnalysis #TradingView #Forex #PriceAction #NikhilKanal #iElliottician #IndianEW #EWinHindi #XAUUSD #Gold #ElliottWave #BNF #NIFTY  Long
Long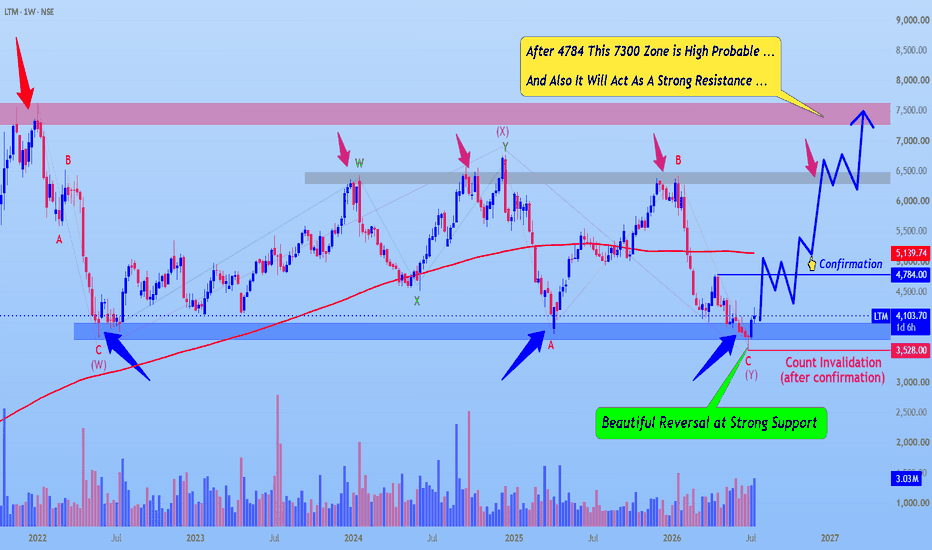
 Short
Short
 Short
Short
 Short
Short
Long 
Education

 Education

 Education

Long 
 Long
Long

 Long
Long
Short 
XAUUSD: Bullish trend above 4,280 remains.Gold is still holding a strong bullish structure after the sharp recovery from the lower accumulation base. From Kelly’s view, the current chart suggests that XAUUSD may be moving through a short-term ABC correction before continuing higher towards the Fibonacci resistance target.
The key idea is simple: gold remains bullish overall, but price may need a healthy pullback before the next upside wave becomes cleaner.
⟡ Market structure
The chart shows gold made a strong impulsive move from the lower area and reached the 4,390–4,430 region. After that, price started to slow down near the Sell wave B zone, which is normal after a strong rally.
Current price is trading around 4,394. This area is close to short-term resistance, so Kelly would not chase buys directly here. A controlled correction into support would create a better setup.
The first reaction zone is around 4,340–4,360, marked as the Buy scalping area. If the correction becomes deeper, the stronger support is around 4,270–4,290, where the chart marks the Fibonacci buy zone and possible end of wave C.
➤ Key levels
◌ 4,390–4,410: Sell wave B / current resistance reaction area
◌ 4,340–4,360: Buy scalping zone
◌ 4,270–4,290: Fibonacci buy zone / possible end wave C
◌ 4,520–4,540: Fibonacci 2.618 target resistance
◌ Below 4,270: area where the bullish setup starts to weaken
◌ Above 4,410: stronger bullish continuation confirmation
⌁ Elliott Wave view
From an Elliott Wave perspective, gold appears to have completed a strong bullish impulse and may now be forming a corrective ABC structure.
Wave A may be the first pullback from the recent high.
Wave B is reacting near the 4,390–4,410 resistance area.
Wave C may still pull price lower towards 4,340–4,360 or deeper into 4,270–4,290.
If wave C ends inside the Fibonacci buy zone and buyers defend it, gold may continue into the next bullish wave towards the 4,520–4,540 Fibonacci resistance target.
▸ Trading scenario
Preferred scenario: wait for gold to correct into support and show bullish confirmation.
Entry zone 1: 4,340–4,360 if bullish reaction appears
Entry zone 2: 4,270–4,290 if deeper ABC correction happens
Stop loss: below the confirmed wave C low or below 4,250
Take profit 1: 4,410
Take profit 2: 4,450
Take profit 3: 4,520–4,540
Alternative scenario: if gold breaks below 4,270 with strong bearish pressure, the bullish ABC setup weakens. In that case, price may need more time to rebuild support before the next upward continuation.
⌁ Kelly’s view
For Kelly, the main trend is still bullish, but the market is now near a resistance zone after a strong rally. The better plan is patience.
If gold corrects into 4,340–4,360 or 4,270–4,290 and buyers defend the zone, the next bullish wave may continue towards the Fibonacci 2.618 target.
Gold remains in a bullish structure.
A clean ABC pullback may prepare the next move higher.
Share your view below. Long 
Long 
Long 
XAUUSD 4404 squeeze — buyers walking into 4435? XAUUSD 4404 squeeze — buyers walking into 4435?
That reclaim above 4,400 is the story now.
Gold pulled back, held the 4,356 - 4,361 structure, then pushed straight back into 4,404. That is not weak price action. Sellers tried to kill the move. They didn’t.
Now price is sitting right under the Order Block around 4,430 - 4,435.
That is the tricky part.
Main bias stays bullish while gold holds above 4,356. We already had the BOS, then the pullback, then buyers stepped back in. Clean enough. But I’m not chasing longs straight into 4,430. That zone can easily become a trap if late buyers jump in too high.
Macro is helping gold stay bid for now. The market is waiting for US inflation data, USD is still stuck in a range, oil remains firm, and Fed hike expectations for September have cooled a bit. So yeah, gold has room to keep pressing higher. But CPI can shake this chart fast.
The cleaner play is simple. If price dips toward 4,390 - 4,404 and holds, buyers can try to attack 4,430 again. Break that area, and 4,450 becomes the next draw. After that, the big psychological target is 4,500.
Trading scenario:
Buy idea only if gold holds above 4,390 - 4,404 and gives a clean continuation reaction.
Entry zone: 4,390 - 4,404 after confirmation
Stop loss: below 4,356
TP1: 4,430 - 4,435
TP2: 4,450
TP3: 4,500
No hold above 4,390, no buy. Don’t chase into the OB.
If gold closes hard below 4,356, this bullish setup gets messy. Then price can slip back toward the lower Order Block around 4,323 - 4,330.
For now, I’m reading this as BOS first, OB test next.
You think gold clears 4,435 before CPI shakes it? Long