Beyond Candlesticks: Reading the Intent Behind Every MoveMost traders learn candlesticks before they learn anything else about price action.
They learn what a hammer looks like.
They memorize engulfing patterns.
They study dojis, shooting stars, inside bars, and pin bars.
But after a while, something becomes obvious:
Knowing what a candle is called doesn't tell you why it happened.
A bullish candle doesn't automatically mean buyers will continue pushing price higher.
A bearish candle doesn't guarantee that sellers are taking control.
The real skill is learning to look beyond the candle and understand the behavior behind the move.
Because every price movement is the result of decisions.
A Candle Is the Result, Not the Reason
Think about a large bullish candle.
A beginner might simply say:
"Buyers are strong."
But that's only the beginning of the analysis.
Ask a few more questions.
Where did the candle appear?
What happened before it?
Was price sitting at major support?
Did sellers attempt to push lower first?
Did the candle break an important resistance level?
Was there strong participation behind the move?
What happened immediately afterward?
Suddenly, one candle becomes part of a much bigger story.
The candle shows you what happened.
Context helps you understand why it may have happened.
Price Is a Conversation Between Buyers and Sellers
Markets are constantly negotiating.
Buyers want lower prices.
Sellers want higher prices.
When one side becomes more aggressive, price starts moving.
Imagine a stock trading around ₹500.
Buyers are willing to purchase at ₹500, but sellers are asking ₹501.
If buyers become increasingly eager, they may accept ₹501, then ₹502, then ₹503.
Price starts moving higher.
The chart records this process as candles.
But behind those candles are thousands of decisions.
That's why price action can be viewed as a conversation between market participants.
The chart is simply the record of that conversation.
Don't Just Look at Direction—Look at Effort
One of the most useful questions you can ask is:
How much effort did the market need to move this far?
Suppose price rallies strongly but reaches an area of resistance and suddenly struggles.
Candles become smaller.
Upper wicks become longer.
Several attempts to move higher fail.
The market is still technically moving upward, but the behavior is changing.
Buyers are making an effort.
But the result is becoming weaker.
That difference between effort and result can provide an important clue.
Sometimes the market tells you that momentum is running out before the trend actually reverses.
Rejection Tells a Story
Price doesn't always move cleanly.
Sometimes buyers push price into a level and sellers immediately respond.
Price falls back.
A long upper wick appears.
That wick tells you something important:
Higher prices were rejected.
The same principle works in reverse.
Sellers push price lower.
Buyers step in aggressively.
Price recovers.
A long lower wick appears.
Lower prices were rejected.
But remember: rejection isn't an automatic trade signal.
A wick becomes more meaningful when you understand where and why it appeared.
Watch What Happens After the Move
One of the biggest mistakes traders make is reacting to the first candle.
Price breaks resistance.
They buy immediately.
Price drops back below the level.
They panic.
Instead, watch what happens next.
A strong breakout should ideally show acceptance above the previous resistance.
Price may retest the level.
If buyers defend it and price continues higher, the breakout gains credibility.
But if price quickly falls back into the previous range, the story changes.
The market may have rejected the breakout.
The reaction after the move can be more informative than the move itself.
The Importance of Location
A candle doesn't exist in isolation.
Its location matters.
A bullish candle in the middle of a random range may not tell you much.
A bullish candle appearing after a sharp decline at a major support zone can be much more interesting.
Why?
Because traders are already watching that area.
Previous buyers may defend their positions.
New buyers may see an opportunity.
Short sellers may begin taking profits.
The same candle can have completely different meaning depending on where it appears.
This is why experienced traders don't simply scan for patterns.
They study the environment around the pattern.
When Price Struggles to Continue
Sometimes the most valuable information comes from what price fails to do.
Imagine a stock has been trending higher for weeks.
It reaches a new high.
But instead of accelerating, price begins struggling.
Several candles test the same area.
Upper wicks appear.
Breakouts don't follow through.
Momentum becomes weaker.
This doesn't automatically mean the trend will reverse.
But it tells you something has changed.
The buyers are no longer getting the same results they were getting earlier.
That is worth paying attention to.
Failed Moves Can Be More Powerful Than Successful Ones
Markets often reveal their intentions through failed attempts.
Suppose price breaks below support.
Sellers enter.
Breakdown traders join.
Stop losses are triggered.
But price quickly climbs back above the support level.
Now the breakdown has failed.
What happened?
Sellers tried to take control.
They couldn't hold the lower prices.
Buyers absorbed the selling pressure and pushed price back into the range.
Those trapped sellers may now need to close their positions.
Their buying can add fuel to the reversal.
A failed move can therefore become the beginning of a much stronger move in the opposite direction.
Think About Who Is Trapped
Whenever price makes a sharp move, ask:
Who is likely trapped here?
If price suddenly breaks above resistance and then falls back below it, breakout buyers may be trapped.
If price breaks below support and quickly recovers, short sellers may be trapped.
Trapped traders matter because eventually they may need to exit.
Their exits can create additional buying or selling pressure.
This is one reason understanding market psychology can be more useful than memorizing dozens of patterns.
Trends Are Built One Decision at a Time
A strong trend doesn't appear from nowhere.
It develops through a series of decisions.
In an uptrend, buyers repeatedly prove willing to pay higher prices.
Pullbacks are absorbed.
Previous highs are broken.
Support levels hold.
Higher highs and higher lows develop.
In a downtrend, the process is reversed.
Sellers repeatedly accept lower prices.
Rallies are sold.
Support levels break.
Lower highs and lower lows develop.
Instead of seeing market structure as a collection of lines, think of it as evidence of who is consistently winning the battle.
Consolidation Is Also Information
Not every important move is fast.
Sometimes the market becomes quiet.
Candles get smaller.
Price moves sideways.
Volatility decreases.
Many traders become bored and stop paying attention.
But consolidation can be extremely informative.
It tells you that buyers and sellers have reached a temporary agreement.
Neither side is strong enough to move price significantly.
Eventually, something changes.
New information arrives.
Orders build up.
One side becomes more aggressive.
The balance breaks.
Price begins searching for a new level.
The quiet period was not meaningless.
It was part of the process.
Don't Try to Predict Every Candle
The goal of price action isn't to predict exactly what the next candle will look like.
That's impossible to do consistently.
A better approach is to build a scenario.
For example:
"If price holds this support zone and buyers regain control, I may consider a long setup."
Or:
"If price breaks this resistance but immediately falls back below it, the breakout may have failed."
This approach keeps you responsive instead of emotionally attached to one prediction.
You don't need to know what the market must do.
You need to know how you will respond to what it actually does.
The Chart Is Telling You a Story
When you look at a chart, try reading it like a story.
Price rises.
Sellers appear.
The market pulls back.
Buyers defend support.
Price rallies again.
Resistance is tested.
The breakout fails.
Sellers become aggressive.
The trend changes.
Every stage contains information.
The more you practice reading this sequence, the less dependent you become on individual candlestick patterns.
You begin to see the relationship between:
Price → Reaction → Participation → Psychology → Market Structure.
Final Thoughts
Candlesticks are useful.
But they are only the language.
The real skill is understanding what the language is saying.
A candle tells you where price moved.
A sequence of candles tells you how price behaved.
Market structure tells you who is gaining control.
Volume can provide clues about participation.
Liquidity can help explain where price may be attracted.
And psychology helps explain why traders react the way they do.
So the next time you see a familiar candlestick pattern, don't immediately ask:
"What pattern is this?"
Ask:
"What just happened?"
"Who tried to take control?"
"Who failed?"
"Who might be trapped?"
And most importantly:
"What is price telling me about the behavior of buyers and sellers?"
Because the real edge isn't in recognizing more candles.
It's in understanding the story behind them.
Don't just read the candle. Read the intent behind the move.
XAUUSD: 4,264 – The Line That Defines Control XAUUSD: 4,264 – The Line That Defines Control
Market Context
Gold is currently trading around 4,326 after a strong impulsive rally from the lower accumulation base. The bullish momentum is still intact, but price is now reacting directly into a major resistance area at 4,330 – 4,365.
This is the type of zone where the market naturally slows down. After a strong expansion, smart money often starts taking profit, while late buyers begin to enter. That creates short-term imbalance and volatility.
Key idea: the trend is still bullish, but price is no longer in a “safe buy zone”. It is now in a decision area.
Technical Structure
The overall structure remains bullish with clear higher highs and higher lows. However, the current price action shows exhaustion near resistance.
The 4,330 – 4,365 zone is acting as immediate supply. Price has already started reacting from this area, which signals that sellers are defending it in the short term.
The most important level on the chart is 4,264. This is the structural support that defines whether the bullish trend continues or transitions into a correction.
As long as price holds above 4,264, buyers remain in control. If this level breaks, the market is likely to shift into a deeper pullback phase toward 4,235 – 4,255.
Below that, the broader demand remains at 4,020 – 4,055, with deeper liquidity around 3,955 – 4,000, but those zones are only relevant if momentum fully shifts bearish.
Key Levels
Current Price: 4,326
Immediate Resistance: 4,330 – 4,365
Liquidity Zone: 4,360 – 4,370
Key Structural Support: 4,264
Pullback Buy Zone: 4,235 – 4,255
Major Demand: 4,020 – 4,055
Deep Demand: 3,955 – 4,000
Bullish Continuation Trigger: Above 4,370
Bearish Shift Trigger: Below 4,264
Trading Plan
Buy Pullback
Entry: 4,235 – 4,255
SL: Below 4,205
TP: 4,300 / 4,330 / 4,365
Condition: Only take this setup if price clearly reacts bullishly inside the zone. The market must show rejection of lower prices before continuation is valid.
Buy Breakout Continuation
Entry: Above 4,370 after breakout + retest
SL: Below 4,330
TP: 4,400 / 4,430 / 4,465
Condition: Wait for a clean breakout of liquidity, followed by a successful retest. Avoid chasing impulsive candles without confirmation.
Sell Reaction (Scalp)
Entry: 4,330 – 4,365
SL: Above 4,380
TP: 4,300 / 4,264 / 4,255
Condition: Only valid if price shows clear rejection from resistance and fails to sustain above 4,370. This is counter-trend and short-term only.
Breakdown Sell
Entry: Below 4,264 after breakdown + retest
SL: Above 4,300
TP: 4,255 / 4,235 / 4,205
Condition: Requires a clean break of structure. If 4,264 fails to hold and retest is rejected, bearish momentum will likely expand.
Overall Bias
The market remains bullish as long as price holds above 4,264. However, price is currently sitting inside a resistance zone, meaning volatility and rejection risk are elevated.
If 4,264 holds, buyers still have the potential to push price back toward 4,330 – 4,365 and possibly a breakout toward 4,370+.
If 4,264 breaks, the market is likely to rotate into a corrective phase toward 4,235 – 4,255.
The key is simple:
Trend is bullish, but timing is everything.
Do not chase resistance. Let the market show its hand at 4,264.
 Short
Short
Triangle PatternIf the market breaks below the triangle pattern, it will be a strong indication of further downside momentum. In that case, the price has a clear path toward the (S2) $3,600 level.
Considering the decline from $4,700, the market may take some time to consolidate around the current zone. We could see sideways movement for a couple of days—or even longer. However, if the price breaks below the $4,023 level, it would confirm a strong bearish move with a high probability of further downside.
Be mindful of the " Dissecting Resistance " line. Even if the market breaks out of the triangle pattern to the upside, failing to break and hold above this resistance level could invalidate the bullish breakout and pave the way for a different market structure. A successful break and close above this level could signal the beginning of a gradual recovery. The first major resistance (R1) is around $4,300. If the market sustains above this level, it could extend its rally toward the next key resistance (R4) at $4,700.
The coming week will be crucial. Keep a close eye on the market structure and make your trading decisions wisely.
Remember, making profits is our goal, but protecting our capital should always be the top priority. Stay focused on the market and invest time in learning. Once you've mastered the learning phase, you won't need to walk or run—you'll be ready to fly.
Protect your capital, manage your risk, and trade safely.
 Long
Long
Pine Labs Ltd. – Has the Corrective Phase Come to an End?ChartTheWave IPO Watch (III)
Pine Labs Limited is a leading fintech company providing point-of-sale hardware, software and digital payment solutions across India and several Asian markets.
Following its listing on 14 November 2025, the stock entered a prolonged corrective phase rather than forming an immediate impulse wave. Let's analyse its current structure through the Elliott Wave Principle.
The Larger Correction
The entire decline unfolded as a Zigzag (5-3-5), one of the three primary corrective structures under the Elliott Wave Principle.
Wave A
Simple. Developed as a Wave 1 Extension, with the impulse terminating near 78.6% of the first candle's projected length using the Trend-Based Fibonacci Extension (TBFE). The internal five-wave structure is clearly visible.
Wave B
Corrected as a simple three-wave (ABC) structure.
Wave C
Wave C developed into an elongated impulse, consisting of the following structure:
Wave 1: Advanced to approximately 1.618× the first candle.
Wave 2: Retraced close to 78.6% of Wave 1.
Wave 3: Extended significantly, reaching approximately 2.414× the length of Wave 1 while developing its own five internal sub-waves.
Wave 4: The initial rally exceeded the price territory of Wave 1 and therefore could not be labelled as Wave 4 under the impulse rules. The subsequent swing high provided the valid Wave 4 count.
Wave 5: Completed at approximately 78.6% of the combined length of Waves 1–3, completing the Zigzag correction.
What Is Happening Now?
Following the completion of the larger correction, the stock began developing a new impulse wave. The initial advance encountered resistance near the 50% TBFE level and subsequently corrected as a Flat structure. Based on the current wave count, this Flat correction appears to have completed on 31 July 2026, with the stock beginning to form higher highs and higher lows, suggesting that the next impulse may already be underway.
ChartTheWave View
If this wave interpretation remains valid, the recent completion of the Flat correction could present an opportunity to participate in the developing impulse. 135 is key validation level. Maintain a stop loss below 135.
IPO Watch Learning
One of the biggest mistakes investors make after an IPO is assuming every decline is a buying opportunity. Under the Elliott Wave Principle, patiently waiting for a completed corrective structure often provides a significantly better risk-reward profile than buying into an ongoing correction.
 Long
Long
XAUUSD 4371 ATH held — 4230 pullback? XAUUSD 4371 ATH held — 4230 pullback?
That 4,371 reaction is the whole chart right now.
Gold ripped hard from the 4,150 base, broke structure, cleared 4,290, then tapped the ATH zone around 4,371 and started respecting it. Yeah, buyers had control. No doubt.
But this is not where I chase longs.
Price is stretched. Really stretched.
The run from the lower Order Block around 4,150 - 4,170 into 4,371 was aggressive. Now gold is sitting near 4,328, right under the ATH reaction area. That usually means one thing: late buyers are exposed.
Main bias for this setup is bearish pullback while gold stays below 4,371.
The first level I’m watching is 4,290. That’s the short-term support and the Fib reaction area. If price loses 4,290, the pullback can open toward the nearest Order Block around 4,230 - 4,250. That is the cleaner demand zone. Not the top. Not the middle. The real reload area.
If sellers push harder, the deeper OB around 4,150 - 4,170 is still sitting below as the bigger discount zone.
Trading scenario:
Sell idea only if gold rejects below 4,371 or loses 4,290 with clean pressure.
Entry zone: 4,328 - 4,350 after rejection
Alternative entry: below 4,290 after breakdown confirmation
Stop loss: above 4,371
TP1: 4,290
TP2: 4,250
TP3: 4,230
Final target: 4,170 - 4,150
No rejection, no sell. No breakdown, no chase.
If gold closes strong above 4,371, this pullback idea is cooked. Then buyers can hunt new highs again.
For now, I’m reading this as ATH respected first, liquidity pullback next.
You think 4,371 rejects properly, or gold forces one more breakout?
Short 
XAUUSD — 4,218 Could Reload the Week XAUUSD — 4,218 Could Reload the Week
Gold is opening the new week from a much stronger position than before, but the chart is also reminding us not to chase the move too late.
Last week, price built pressure from the lower range, broke through the 4,116.415 breakout area, and expanded hard toward the 4,300 zone. That move was not just a small bounce anymore. It was a real shift in short-term structure, with BOS confirming that buyers had taken control of the flow.
Now gold is holding around 4,320.240, but after such a strong climb, the market may need to breathe. For newer traders, this is the key lesson: even in a bullish market, price often pulls back to fill imbalance before the next continuation. That pullback is not always weakness. Sometimes it is simply the market returning to a cleaner area where buyers can step in again.
The main zone I am watching is the FVG between 4,171.793 and 4,218.740. If gold drops into this area and holds, I would see it as a healthy correction rather than a bearish reversal. That zone is like the “reload area” for the new week. If buyers defend it, price may build another push back above 4,320 and start hunting higher liquidity near 4,360.
My main view is bullish while gold stays above the FVG. The structure still supports buyers, but the best continuation setup would come after a controlled pullback, not from chasing near the highs.
This bullish idea becomes weak if gold loses 4,171.793 and fails to recover. Below that, the deeper order block around 4,080.682 becomes the next area to watch.
Key price zones to watch
Current reaction area: 4,320.240
Main demand / FVG reload zone: 4,171.793 - 4,218.740
Bullish confirmation zone: clean reclaim above 4,320.240
First upside liquidity target: 4,360
Main upside target: 4,380 - 4,400
Lower support if buyers fail: 4,171.793
Major lower order block: 4,080.682
Invalidation: clean close below 4,171.793
Do you think gold needs to pull back into 4,218 before continuing higher, or can buyers push straight through 4,320 this week?
Short 
Beneath the Surface: Flip Zones, Supply, and PatternsThis post is educational and observational in nature based on historical price action. It is not a forecast or a trading recommendation
Flip Zone (White zone)
A resistance zone that, once broken and sustained above, converted into support. This shift in character is what defines a flip zone, a level whose role changes from holding price down to holding price up.
Counter Trendline (White line)
A trendline drawn against the direction of the primary trend, used to track corrective or pullback phases within a larger structure.
Supply Zone ( Red zone )
A price area where sellers have historically overwhelmed buyers, rejecting advances and capping price on multiple prior attempts.
Hidden Broadening Pattern (Dotted Orange Lines)
A broadening pattern that isn't immediately obvious on the chart, formed by widening highs and lows rather than a contracting range. Because it sits quietly beneath the more visible structures, it's often overlooked despite reflecting increasing volatility within the broader move.
The Bigger Picture
This chart layers four separate elements together, a flip zone, a counter trendline, a supply zone, and a hidden broadening pattern, all coexisting within the same price history. Recognizing how these structures sit relative to one another, rather than viewing any single one in isolation, offers a deeper read of the chart's overall behavior.  Long
Long
Gold H3: Bulls dominate, new target!Gold has just broken out decisively from the high liquidity zone of 4.145–4.195, where it has repeatedly blocked previous increases.
The strongly expanding candle range shows that the buyers have really dominated, but the RSI is entering the overbought zone so buying around 4,295 is no longer attractive.
My preferred scenario is that XAUUSD corrects to retest the breakout zone.
If the price holds 4,150–4,195 and there is a bullish reaction above H3, the old resistance will officially turn into support, creating the foundation for the next uptrend towards 4,400.581.
Macro is strengthening the upward direction: the USD and US bond yields weaken, private employment data cools and the market reduces expectations that the Fed will raise interest rates in September. This is a favorable environment for gold to maintain its strength.
The breakout confirmed the bulls' advantage; What we need to wait for now is a nice enough pullback, not chasing a candle that has run too far. Long 
How Can One Institution Buy $1 Billion Without Moving the MarketWhen a retail trader buys one lot of EUR/USD or a few shares of a stock, the market barely notices. The order is so small that it gets matched almost instantly. But what happens when a large institution wants to buy $1 billion worth of an asset? Surely placing such a massive order should send the price soaring. Surprisingly, it usually doesn't.
The reason is simple. Institutions cannot afford to move the market against themselves. If they bought everything at once, they would push the price higher with every order, forcing themselves to pay more and more. Instead of rushing into the market, they use a completely different approach, one that is built on patience, planning, and liquidity.
Every Big Trade Has a Big Problem
The biggest challenge for an institution is not deciding what to buy. The real challenge is finding enough sellers.
Every trade needs two sides. If an institution wants to buy $1 billion worth of an asset, someone else must be willing to sell the same amount. At a single price level, there are usually not enough sell orders available. If the institution keeps buying aggressively, it quickly consumes all the available liquidity and forces the price higher.
For this reason, the goal is not just to buy. The goal is to buy without significantly changing the market price.
Why Institutions Never Buy Everything at Once
Imagine trying to fill a swimming pool using one huge bucket of water. It would create a massive splash and waste a lot of water. Using a smaller bucket repeatedly is much more controlled.
Institutions think the same way. Instead of placing one enormous order, they divide it into hundreds or even thousands of smaller orders. These orders are executed over time, allowing them to build a large position while keeping the market relatively stable.
To retail traders, nothing unusual seems to be happening. Behind the scenes, however, billions of dollars may already be changing hands.
Why the Market Suddenly Stops Moving
Many traders become impatient when price starts moving sideways. They assume the market has become weak or directionless.
In reality, a ranging market is often where institutions do most of their work. While price moves back and forth within a relatively small range, large buyers and sellers continue exchanging positions. This allows institutions to accumulate their positions without causing dramatic price movements.
What appears to be a quiet market is often one of the busiest periods for institutional activity.
Why False Breakouts Happen
Sometimes there simply isn't enough liquidity inside the range. Institutions still need more sellers before completing their buying.
As price moves above resistance or below support, many retail traders react immediately. Some enter breakout trades, while others have their stop losses triggered. These new market orders provide fresh liquidity for institutions to continue executing their positions.
To retail traders, this looks like a genuine breakout. But in many cases, it is simply a temporary move created by the market searching for additional liquidity. Once enough orders have been filled, price may return back into the range before eventually moving in its intended direction.
The Real Move Begins
By the time the market finally breaks out and starts trending strongly, institutions have often completed most of their buying. Retail traders see the breakout as the beginning of the move, but for institutional traders, the important work happened much earlier during the accumulation phase.
This is why experienced traders often pay close attention to consolidation rather than only focusing on breakouts. The strongest trends are frequently built during the quietest period
My Thoughts
Institutions do not have a secret button that allows them to buy billions without affecting price. Instead, they solve a liquidity problem through patience, order splitting, and careful execution. They accumulate positions gradually, take advantage of periods of consolidation, and sometimes wait for liquidity to appear before completing their trades.
The next time you see a market moving sideways, don't assume nothing is happening.
Sometimes, the quietest charts are where the biggest players are making their biggest decisions.
BrightRally_Research on TradingView  Education
Short 
Long 
 Education


XAUUSD: Bullish Wave 5 targets upward.Gold is showing a clear bullish recovery after breaking away from the lower accumulation base. From Kelly’s view, the current structure suggests that XAUUSD is no longer only moving sideways; buyers are trying to build a larger Elliott Wave continuation towards the upper Fibonacci target.
The key idea is simple: gold remains bullish, but after a strong push, the better setup is to wait for a controlled pullback before following the next upside wave.
⟡ Market structure
The chart shows gold previously traded under a strong downtrend structure, but the latest recovery has changed the short-term rhythm. Price has pushed above the lower base and is now reacting around 4,341, close to the first important resistance area.
This area is important because price may pause here after a strong impulse move. A pullback from this zone would not automatically break the bullish view. Instead, it may form wave 4 before the market prepares for another upward move.
The main buy zone to watch is 4,180–4,198. If gold corrects into this area and buyers defend it, the next bullish leg may continue towards the higher Fibonacci target zone around 4,520–4,560, where the chart marks the possible end of wave 5.
➤ Key levels
◌ 4,180–4,198: main buy zone and possible wave 4 support
◌ 4,341: current price reaction area
◌ 4,380–4,400: near resistance and breakout checkpoint
◌ 4,520–4,560: target end wave 5 / Fibonacci extension zone
◌ Below 4,180: area where the bullish setup starts to weaken
◌ Below 4,100: deeper invalidation area for the current wave count
⌁ Elliott Wave view
From an Elliott Wave perspective, gold appears to be forming a bullish 5-wave structure after the previous bearish cycle slowed down near the lower base.
Wave 1 created the first strong recovery move.
Wave 2 corrected but held above the structure base.
Wave 3 is now pushing price into the 4,340 resistance region.
Wave 4 may form as a healthy correction back into 4,180–4,198.
If this buy zone holds, wave 5 may continue towards the 4,520–4,560 Fibonacci target area.
This is why Kelly would not chase gold directly after the strong rise. The structure is bullish, but the cleaner entry usually comes after the market retests support and confirms buyers are still active.
▸ Trading scenario
Preferred scenario: wait for gold to correct into the buy zone and show bullish confirmation.
Entry zone: 4,180–4,198 if bullish confirmation appears
Stop loss: below the confirmed wave 4 low or below 4,150
Take profit 1: 4,341–4,380
Take profit 2: 4,400
Take profit 3: 4,520–4,560
Alternative scenario: if gold breaks below 4,180 with strong bearish pressure, the bullish wave 5 setup becomes weaker. In that case, price may need to rebuild a deeper support base before the next bullish continuation becomes reliable.
⌁ Kelly’s view
For Kelly, the main structure is still bullish. Gold has already shown strong buying pressure, and the current move looks like part of a larger Elliott Wave recovery.
The cleanest plan is to wait for the pullback. If 4,180–4,198 holds, gold may continue the next bullish wave towards the upper Fibonacci target.
Gold is in a bullish continuation phase.
If the buy zone holds, wave 5 may extend higher.
Share your view below. Long 
XAUUSD – Weekly Recap: Gold Surged, But 4,420 Is The Real Test XAUUSD – Weekly Recap: Gold Surged, But 4,420 Is The Real Test
Gold has ended the week with a powerful bullish recovery.
From the early-week range around 4,050, price broke above multiple resistance zones, reclaimed 4,165, continued through 4,205, and reached the 4,300+ area with strong momentum. Buyers clearly controlled most of the week.
But now gold is approaching a much bigger decision zone.
Price is trading around 4,341, close to the upper part of the broader descending channel. The next major resistance sits around 4,420, where Fibonacci, trendline pressure, and previous sell-order structure are coming together.
This is where the market may decide whether the weekly rally becomes a larger bullish reversal — or only a strong correction inside the bigger bearish channel.
WEEKLY TREND SUMMARY
This week started with gold moving inside a quiet range around 4,050 – 4,085.
At first, buyers lacked confidence, but the structure changed once price defended the lower buy zones and started breaking resistance step by step.
The key turning point came when gold broke above 4,165. After that, bullish momentum expanded quickly toward 4,205, then continued higher as buyers followed through.
By the end of the week, gold reached the 4,300+ area and showed one of the strongest recovery phases in recent sessions.
However, the weekly close is now near a major long-term resistance area. This means the rally is impressive, but the next reaction around 4,420 will be very important.
FUNDAMENTAL ANALYSIS
Gold received support from softer Fed expectations, weaker USD pressure, and lower Treasury yields during the week.
The market also continued to watch geopolitical risk and central bank gold demand, both of which can support gold when uncertainty rises.
However, inflation risk and future Fed policy remain important. If the Fed becomes more hawkish again or the U.S. dollar recovers strongly, gold may face profit-taking near higher resistance.
For now, the fundamental background supports the recovery, but the chart is approaching a technical resistance zone where buyers need confirmation.
TECHNICAL ANALYSIS – SMC + FIBONACCI
From an SMC perspective, gold has created a strong bullish displacement from the lower accumulation area.
The breakout above 4,165 confirmed that buyers were no longer just defending support — they were taking control of the short-term structure.
Price then continued higher and is now approaching the sell order Fibonacci + trendline zone around 4,420. This area is important because it aligns with the upper boundary of the broader descending channel.
If gold rejects from 4,420, a corrective pullback toward 4,224 may appear. This would not immediately destroy the bullish recovery, but it would show that the larger channel resistance is still respected.
If buyers break and hold above 4,420, the structure becomes much more interesting. That would suggest gold is trying to escape the broader bearish channel and build a stronger medium-term recovery.
KEY PRICE ZONES
Current price: 4,341
Major resistance: 4,420
Sell order Fibonacci + trendline zone: 4,400 – 4,420
Strong support: 4,224
Short-term bullish support: 4,300 – 4,320
Previous breakout support: 4,205
Main downside target if rejection confirms: 4,224
Deep Fibonacci extension target: 3,744
Bullish confirmation: Above 4,420
Invalidation for short-term bullish structure: Below 4,224
TRADING SCENARIOS
Buy Scenario – Continuation View
Buy Zone: 4,300 – 4,320
Entry: Bullish reaction, liquidity sweep, lower-timeframe CHoCH, or strong support hold
SL: Below the nearest swing low
TP1: 4,400
TP2: 4,420
Breakout Buy Scenario
Condition: Clean break and hold above 4,420
Target: Higher recovery extension if momentum continues
Sell Scenario – Reaction From Major Resistance
Sell Zone: 4,400 – 4,420
Entry: Bearish rejection, failed breakout, or lower-timeframe bearish CHoCH
SL: Above the rejection swing high
TP1: 4,300
TP2: 4,224
Breakdown Sell Scenario
Condition: Clean break below 4,224
Target: Lower channel areas, with 3,744 as the deeper Fibonacci extension target if bearish pressure expands
MY VIEW
Gold had a very strong week.
Buyers controlled the move from the lower range and pushed price through several important resistance zones. That is a clear sign of strength.
But now the easy part may be over.
The 4,400 – 4,420 area is the real test. If buyers break this zone, gold may start a stronger medium-term recovery. If sellers reject it, the market may pull back toward 4,224 before deciding the next direction.
For me, this is not a place to chase blindly. It is a place to watch reaction.
Gold is strong — but 4,420 will tell us whether this rally is real continuation or only a powerful correction inside the bigger channel.
Do you think gold will break above 4,420 next week, or will sellers defend the trendline again?
Short 
XAUUSD: Breakout Week, 4,234 Must Hold XAUUSD: Breakout Week, 4,234 Must Hold
Market Context
Gold closes the week with a strong bullish recovery after buyers stepped in aggressively from the lower imbalance zone and pushed price higher with clear momentum. The week started with hesitation around 4,050 - 4,070, but once short-term structure was broken, buyers took full control.
Macro support came from softer USD, easing geopolitical tension, cooling inflation expectations, and reduced probability of aggressive Fed tightening. However, the move is now extended, meaning the market is no longer in “easy entry” mode — it is in “confirmation or pullback” mode.
Key point: structure has flipped bullish, but 4,234 is the line that defines continuation or correction.
Weekly Recap
Early week: Price held above deep demand and started building a base from 4,050 - 4,070.
Midweek: Market broke internal structure, reclaimed 4,119, and expanded toward 4,148 - 4,172.
Late week: Momentum accelerated, breaking 4,245 and 4,260, then pushing into the 4,300+ region.
Current view: Daily CHoCH confirms bullish shift, but price is now pressing into higher timeframe resistance.
Technical Structure
Gold is currently trading around 4,341 after a strong impulsive daily candle. The structure shows a clean bullish recovery, with price now clearly detached from the main accumulation zone.
Main support sits at 4,100 - 4,234. This is the Buy FVG Zone where buyers previously stepped in, and it remains the most important area on the chart.
As long as price holds above 4,234, bullish continuation remains valid, with upside expansion toward 4,428 - 4,513.
Above that, the major supply / OB zone sits at 4,700 - 4,708. This is where strong profit-taking or reversal pressure is expected if momentum extends.
The higher liquidity target remains 4,886, but this only becomes relevant if price can accept above 4,513 and build continuation structure.
Key Levels
Current Price: 4,341
Main Buy Zone: 4,100 - 4,234
Key Support: 4,101
Resistance Zone: 4,428 - 4,513
Strong OB Resistance: 4,700 - 4,708
Buyside Liquidity: 4,886
Lower Liquidity: 3,960
Bullish Continuation: Above 4,513
Bearish Risk: Below 4,234
Trading Plan
Buy Pullback
Entry: 4,100 - 4,234
SL: Below 4,101
TP: 4,428 / 4,513 / 4,700
Condition: Price retraces into the FVG Buy Zone and shows clear bullish reaction. The key is defense of 4,234 — if that level fails, the setup is invalid. Deeper entries near 4,100 require strong rejection confirmation, not early anticipation.
Buy Continuation
Entry: Above 4,513 after breakout + retest
SL: Below 4,428
TP: 4,700 / 4,708 / 4,886
Condition: Market must break resistance with momentum, then retest and hold. Avoid chasing breakout candles — wait for acceptance and structure confirmation.
Sell Reaction
Entry: 4,428 - 4,513
SL: Above 4,540
TP: 4,341 / 4,234 / 4,100
Condition: Price reacts bearish at resistance zone. This is a counter-trend scalp only unless structure fully flips below 4,234.
Strong OB Sell
Entry: 4,700 - 4,708
SL: Above 4,750
TP: 4,513 / 4,428 / 4,234
Condition: Price reaches major supply zone and shows exhaustion. This is where larger players may take profit and initiate reversal pressure.
Breakdown Sell
Entry: Below 4,234 after breakdown + retest
SL: Above 4,341
TP: 4,100 / 4,000 / 3,960
Condition: Loss of 4,234 invalidates bullish structure. Retest failure confirms shift back to bearish expansion.
Overall Bias
Gold ends the week in a clear bullish structure shift. Buyers have successfully broken the previous downtrend and are now controlling price above key levels.
Next week, 4,234 is the most important level on the chart. Holding above it keeps bullish continuation toward 4,428 - 4,513 in play. A clean breakout above 4,513 opens the path toward 4,700 - 4,708.
If price loses 4,234, the market likely needs a deeper correction back into 4,100 before any new bullish expansion.
Best approach: stay with the trend, but do not chase extension. Let price come into value (4,100 - 4,234) or confirm breakout above resistance before engaging.
Will buyers defend 4,234 and continue the expansion, or is the market preparing for a deeper reset before the next leg up?
Long 
XAUUSD 4295 broke — 4475 is the next bait
XAUUSD 4295 broke — 4475 is the next bait
That weekly close is not quiet anymore.
Gold spent the week pretending it was still stuck. Early on, price was chopping around 4,050 - 4,080, buyers looked unsure, sellers kept trying to fade every bounce.
Then the trap showed up.
Price held the lower structure, built from the 4,025 base, reclaimed 4,146, then ripped straight through 4,295. That level was the real gate. Once gold cleared it, late shorts had a problem.
Now price is sitting around 4,341, and yeah, momentum is clearly bullish. Not perfect. Not clean. But strong enough that I’m not trying to short this just because it “looks high”.
Main bias stays bullish while gold holds above 4,295.
The next liquidity draw is 4,359 first. Above that, 4,421 is the clean magnet. If buyers keep pressing, 4,475 and 4,504 are sitting higher like unfinished business.
But the big danger zone is the OB premium zone around 4,550 - 4,575. That is not a place to blindly chase. That is where I expect a serious reaction if price gets there.
Trading scenario:
Buy idea only if gold holds above 4,295 and gives a clean continuation setup.
Entry zone: 4,295 - 4,341 after confirmation
Stop loss: below 4,213
TP1: 4,359
TP2: 4,421
TP3: 4,475
Final target: 4,550 - 4,575
No hold above 4,295, no chase. Simple.
If gold closes hard below 4,213, this bullish continuation idea gets messy. Then the breakout starts looking like a trap.
For now, I’m reading this as weekly breakout first, premium liquidity next.
You think gold tags 4,475 before sellers wake up?
Long 
 Long
Long
RECLTD: A Possible Elliott Wave Roadmap for Wave ⑤With Wave ④ appearing complete, RECLTD may be at the beginning of Wave ⑤ of the larger Wave III.
The chart presents one possible Elliott Wave roadmap for how Wave ⑤ could unfold.
=> Proposed Structure
(1): Initial impulsive advance with a projected move of approximately 84.23%.
(2): Corrective pullback.
(3): If the Elliott Wave structure develops as expected, this wave could become the strongest and longest segment.
(4): Consolidation.
(5): Final push to complete Wave ⑤, which would also complete the larger Wave III, with a projected advance of approximately 942.25%.
📊 Technical Structure
✅ Long-term ascending channel remains intact.
✅ The projected roadmap anticipates the development of Wave (1), (2), (3), (4), and (5) to complete ⑤, which in turn completes Wave III.
These projections are illustrative, not guaranteed price targets, and are meant to visualize one potential path if the bullish Elliott Wave count continues to unfold.
❌ Invalidation
The current Elliott Wave count remains valid as long as price holds above ₹303.00.
A decisive break below this level would invalidate this bullish scenario.
*******************************************************************************************
Warning ⚠
This analysis is shared for educational purposes and reflects one possible Elliott Wave interpretation. It is not financial advice.
*******************************************************************************************
#RECLTD #ElliottWave #Wave3 #ImpulseWave #TechnicalAnalysis #WaveAnalysis #TradingView #PriceAction #StockMarket #SwingTrading #PositionalTrading #MarketStructure #NSE #NikhilKanal #ElliottWave #LeadingDiagonal #Zigzag #DoubleZigzag #TripleZigzag #CorrectiveWaves #WaveAnalysis #TechnicalAnalysis #TradingEducation #PriceAction #TradingView #MarketStructure #StockMarket #NikhilKanal #ElliottWave #TradingEducation #MotiveWave #ImpulseWave #LeadingDiagonal #EndingDiagonal #WaveAnalysis #TechnicalAnalysis #PriceAction #TradingView #StockMarket #MarketStructure #TradingPsychology #NikhilKanal #ElliottWave #TradingEducation #LeadingDiagonal #EndingDiagonal #Triangle #WaveAnalysis #TechnicalAnalysis #PriceAction #TradingView #MarketStructure #NikhilKanal #ElliottWave  Long
Long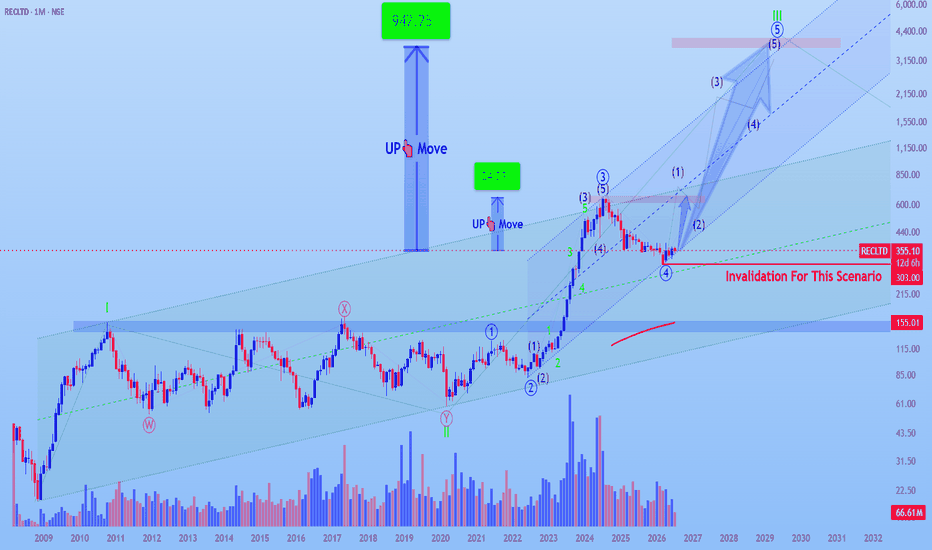
XAUUSD — 4,341 Was the Fake Breakout XAUUSD — 4,341 Was the Fake Breakout
Gold gave us a very strong week, but the way it ended is the part that interests me most.
Earlier in the week, price defended the lower structure around 4,015 - 4,030, then started building higher lows. Once gold reclaimed 4,116.415, the chart shifted tone quickly. Buyers stepped in with real momentum, pushed through the old resistance, and drove price all the way into the upper liquidity area above 4,300.
But after that strong run, the market did what it often does near emotional highs — it hunted liquidity. Price stretched into the 4,341.935 area, printed a fake breakout, then started rejecting back below the highs. For newer traders, this is where the story changes. A breakout is only strong if price can hold above it. When price breaks higher, attracts late buyers, then falls back inside the range, that move can become a trap.
That is why my main view after this weekly close is bearish for a correction while gold stays below 4,341.935. The bullish move was real, but the current reaction suggests price may need to rebalance before another clean upside attempt.
The first area I am watching is the order block around 4,232.900 - 4,241.673. If this zone fails, gold may continue toward 4,177.565, then the FVG around 4,110.255 - 4,111.210. That lower FVG is important because it is where the breakout leg began to accelerate, so price may want to revisit it if sellers keep control.
This bearish correction idea becomes weak only if gold reclaims 4,341.935 and holds above it. Until then, I see the weekly high as a possible liquidity grab, not a confirmed continuation.
Key price zones to watch
Current reaction area: 4,294.985 - 4,341.935
Main supply / fake breakout zone: 4,341.935
Bearish confirmation zone: clean break below 4,232.900
First downside order block target: 4,232.900 - 4,241.673
Next downside liquidity target: 4,177.565
Main downside FVG target: 4,110.255 - 4,111.210
Lower support if selling expands: 4,025.510
Invalidation: clean reclaim and hold above 4,341.935
After this strong weekly rally, do you see 4,341 as a real breakout level, or was that the trap before gold returns to fill the FVG below?
Short 


