Long
Long
XAUUSD — 4,240 Became the Launchpad XAUUSD — 4,240 Became the Launchpad
Gold finally gave the kind of move buyers were waiting for, and compared with yesterday, this was not just a small recovery — it was a strong expansion candle that changed the short-term tone of the chart.
Price had already been building pressure around the 4,060 - 4,120 area, but the real message came when gold broke through the previous resistance and reclaimed the 4,160 area. That level matters because it was not only a technical barrier, but also close to the area where momentum needed to prove itself. Once price pushed above it, the market stopped looking like a weak bounce and started acting like a real bullish continuation.
For newer traders, this is the simple read: when price breaks a key resistance, then pulls back into the old supply zone and holds, that zone can flip into support. Right now, the 4,230 - 4,245 area is the zone I am watching closely. If gold breathes back into this area and buyers defend it, the next push may continue toward the upper liquidity around 4,300 and possibly 4,330.
My main view is bullish while gold stays above 4,230. The softer USD tone, easing Hormuz-related fears, weaker Fed hike expectations, and stronger daily momentum all support the idea that buyers are trying to keep control.
This bullish idea becomes weak if gold loses 4,230 and fails to recover. A deeper break below 4,160 would tell me the breakout has lost strength, and price may need to rebalance lower before another continuation attempt.
Key price zones to watch
Current reaction area: 4,260 - 4,300
Main demand / flipped supply zone: 4,230 - 4,245
Bullish confirmation zone: clean hold above 4,245
First upside liquidity target: 4,300
Main upside target: 4,320 - 4,330
Lower support if buyers fail: 4,160 - 4,180
Major lower liquidity: 4,100 - 4,120
Invalidation: clean close below 4,230, stronger below 4,160
Do you see this strong breakout as the start of a bigger bullish leg, or would you wait for gold to retest 4,240 before trusting the next push?
 Long
Long
XAUUSD — 4,070 Became the Spring XAUUSD — 4,070 Became the Spring
Gold dipped into the 4,070 area, but the reaction from that zone feels more like a controlled pullback than a clean bearish breakdown.
Price came back into the Golden Zone around 4,060 - 4,070, tested the 0.5 - 0.618 retracement area, then pushed higher instead of falling deeper. That is the part I like most on this chart. For newer traders, this zone matters because when price pulls back into a balanced area after a bullish leg, buyers often need to defend it if the next continuation move is still alive.
The bigger story is that gold is trying to build strength again after holding above 4,030.570 and 4,019.240. The bounce from this lower base shows that sellers failed to fully control the move, and now price is pushing back toward 4,116.185 - 4,120.145. If buyers can stay above this area, the market may start hunting the next upside liquidity around 4,141.715.
My main view is bullish while gold holds above the Golden Zone. The macro background still needs caution because traders are watching US-Iran developments and the upcoming US jobs data, so I do not expect every move to be smooth. But structurally, the chart is showing a cleaner recovery attempt.
If gold breaks and holds above 4,120.145, the next magnet becomes 4,141.715, then 4,159.475. This bullish idea becomes weak only if price loses 4,060 and fails to recover. A deeper break below 4,030.570 would tell me the recovery base has failed.
Key price zones to watch
Current reaction area: 4,106.750 - 4,120.145
Main demand / Golden Zone: 4,060 - 4,070
Bullish confirmation zone: clean hold above 4,116.185 - 4,120.145
First upside liquidity target: 4,141.715
Main upside target: 4,159.475
Lower support if buyers fail: 4,030.570
Major lower liquidity: 4,019.240 - 3,996.055
Invalidation: clean close below 4,030.570
Do you see this 4,070 reaction as buyers defending the Golden Zone, or would you wait for 4,120 to break before trusting the next bullish push?
Long 
BRIAN XAUUSD – GOLD BREAKS TRENDLINE, BUT THE REAL TEST IS AHEADBRIAN XAUUSD – GOLD BREAKS TRENDLINE, BUT THE REAL TEST IS AHEAD
Gold is trading around the 4,070 area after a slight pullback during the Asian session. The market is still waiting for clearer direction as traders watch US-Iran negotiations, the possibility of a temporary deal to reopen the Hormuz Strait, and the US July employment data later this week.
From a macro view, gold is caught between two opposite forces. Any progress in US-Iran talks can reduce safe-haven demand, while weak US jobs data could pressure the dollar and support gold again. This makes the current price action very sensitive to liquidity zones.
Technical structure
On the H1 chart, gold has broken above the descending trendline, which is the first sign that sellers are losing short-term control.
Price is now trading above the previous support structure and moving inside a recovery phase. However, gold is approaching the upper resistance area, so this is not the best place to chase buy blindly.
The main buy area is the Buy POC around 4,085 - 4,095. If price pulls back into this zone and holds, buyers can build another push higher.
Below that, the Support confirm sell zone around 4,060 - 4,065 is the key line to watch. If gold breaks below this area, the recovery structure becomes weaker.
Important zones
Support confirm sell: 4,060 - 4,065
Key support. If lost, short-term bullish pressure weakens.
Buy POC: 4,085 - 4,095
Main buy reaction zone if price pulls back and holds.
Short-term resistance: 4,107
First resistance and intraday reaction level.
Upper resistance: 4,127 - 4,130
Next upside target if buyers continue to control the structure.
Major resistance: 4,160 - 4,165
Higher liquidity zone if momentum expands strongly.
Trading scenario
Buy reaction from Buy POC 4,085 - 4,095
Entry:
Look for buy positions only if price pulls back into 4,085 - 4,095 and shows clear bullish rejection.
Stop Loss:
Below the Buy POC or below the local support structure.
Take Profit:
TP1: 4,107
TP2: 4,127 - 4,130
TP3: 4,160 - 4,165 if buyers keep momentum
This setup follows the current trendline breakout and uses the Volume Profile support as the main buy-reaction area.
Final view
Gold is showing a better recovery structure after breaking the downtrend line, but the market is not risk-free.
The key is whether buyers can defend the Buy POC zone. If gold holds above 4,085 - 4,095, the next push towards 4,127 and possibly 4,160 remains possible.
If price loses 4,060 - 4,065, the breakout becomes weak and sellers may regain pressure.
For now, I prefer waiting for a pullback into value instead of chasing price near resistance.
Breakout is important.
But acceptance above value is what confirms the move.
Would you buy the POC retest, or wait for gold to clear 4,130 first?
Long 
Amagi Media Labs – Has the First Impulse Wave Reached Maturity?
ChartTheWave IPO Watch (II)
Amagi Media Labs, one of Bengaluru's unicorn startups, is a cloud-native software company that provides technology solutions for television broadcasters and streaming platforms worldwide. Since its listing, the stock has appreciated by approximately 120%. Let's analyse its current structure using the Elliott Wave Principle.
Wave Structure
Wave 1
Developed as a clean five-wave impulse , completing on 6 May 2026.
Wave 2
Corrected as a simple ABC structure.
Retraced approximately 38.2% of Wave 1 before completing on 22 May 2026.
Wave 3
Developed into an extended impulse , with Sub-wave (iii) also extending internally.
Achieved approximately 1.414× the length of Wave 1 before peaking on 29 June 2026.
Wave 4
Corrected to the 1.0 Trend-Based Fibonacci Extension (TBFE) level of Wave 1, where it found support before resuming the uptrend.
Wave 5
Is unfolding as a smaller five-wave impulse.
Based on the current structure, the move appears to have potentially completed near:
61.8% of the combined length of Wave 1 to Wave 3, and
78.6% of the length of Wave 3.
The internal wave subdivisions are consistent with a completed impulse.
Additional Observation
The RSI is showing bearish divergence, indicating that momentum has weakened despite the recent price highs.
Conclusion
Based on the current Elliott Wave structure and momentum characteristics, the first impulse wave appears to be nearing completion or may already have completed. If this interpretation remains valid, a corrective phase should be expected before the next larger-degree advance begins.
For investors who participated in the move from lower levels, this could be an appropriate stage to review positions and consider partial or full profit booking based on their individual investment strategy and risk tolerance, rather than assuming the trend will continue uninterrupted.
 Short
Short
XAUUSD: Breakout paves the way toward 4,250OANDA:XAUUSD has just staged a strong rally, surging past a resistance zone that had previously capped the price multiple times.
Trading above the EMA34/89 cluster indicates that short-term momentum has decisively shifted in favor of the buyers.
The 4,115–4,150 zone is the area to watch now. If any upcoming pullback holds above this range and forms a rejection wick or a bullish engulfing pattern on the H2 chart, the former resistance zone could officially flip into support.
Once the breakout structure is confirmed, I expect gold to push past 4,180–4,200 and extend its gains toward the 4,220–4,250 target zone, with 4,250.914 being the most notable level.
The macroeconomic backdrop also supports this bullish outlook, as the US dollar and Treasury yields weaken while the market awaits further labor data to assess the likelihood of continued Fed rate hikes. A lower-yield environment is helping gold maintain its appeal.
Buy zone: 4,115–4,150
Confirmation: Bullish H2 reaction and holding above 4,115
Primary targets: 4,220–4,250
Invalidation: Clear H2 close below 4,100 Long 
Old Patterns Never Really Leave the ChartThis post is educational and observational in nature based on historical price action. It is not a forecast or a trading recommendation.Charts used are older than 3 months
A: Inverse Head and Shoulders
Point A marks an inverse head and shoulders pattern, a reversal structure formed by a low, a deeper low, and a higher low, typically preceding a shift in momentum to the upside.
B: The Breakout Candle
Point B marks the breakout candle, the candle that confirmed the move above the pattern's neckline.
C: The Fakeout
Point C marks a fakeout that followed, shaking out weaker positions before the real move continued. How far a fakeout can extend before reversing is never known in advance, which is part of what makes this phase difficult to trade in real time.
D: The One Sided Rally
Point D marks a one sided rally, a sustained upward move with limited pullback, following the fakeout.
E: The Old Pattern Trendline as Future Support
Point E highlights a trendline originally formed as part of the earlier pattern structure, which later went on to act as support for future price action.
The Bigger Picture
This chart is a reminder that patterns rarely disappear once they play out. The lines and structures formed during an old pattern often continue to serve as reference points long after that pattern has technically completed, later acting as support or resistance when price revisits the same area. Old structure tends to leave a lasting imprint on the chart, and recognizing that imprint is part of reading price history with depth  Long
Long
NIFTY : INTRADAY TRADING PLAN | 06-Aug-2026𝗧𝗶𝗺𝗲𝗳𝗿𝗮𝗺𝗲: 15 Min | 𝗟𝗮𝘀𝘁 𝗖𝗹𝗼𝘀𝗲: 24,624.65 (+52.40 / +0.21%) | 𝗥𝗮𝗻𝗴𝗲: 24,570.20 - 24,624.65
━━━━━━━━━━━━━━━━━━━━━━━━
🔎 𝗞𝗘𝗬 𝗟𝗘𝗩𝗘𝗟𝗦 𝗧𝗢 𝗪𝗔𝗧𝗖𝗛
🔴 𝗘𝘅𝘁𝗲𝗻𝗱𝗲𝗱 𝗥𝗲𝘀𝗶𝘀𝘁𝗮𝗻𝗰𝗲 — 𝟮𝟰,𝟵𝟭𝟰 (𝘥𝘢𝘴𝘩𝘦𝘥 / 𝘶𝘯𝘤𝘰𝘯𝘧𝘪𝘳𝘮𝘦𝘥 𝘴𝘸𝘪𝘯𝘨 𝘵𝘢𝘳𝘨𝘦𝘵)
🔴 𝗢𝗽𝗲𝗻𝗶𝗻𝗴 / 𝗟𝗮𝘀𝘁 𝗜𝗻𝘁𝗿𝗮𝗱𝗮𝘆 𝗥𝗲𝘀𝗶𝘀𝘁𝗮𝗻𝗰𝗲 — 𝟮𝟰,𝟳𝟯𝟭 (𝘔𝘢𝘫𝘰𝘳 𝘙𝘦𝘴𝘪𝘴𝘵𝘢𝘯𝘤𝘦)
🟠 𝗢𝗽𝗲𝗻𝗶𝗻𝗴 𝗥𝗲𝘀𝗶𝘀𝘁𝗮𝗻𝗰𝗲 / 𝗦𝘂𝗽𝗽𝗼𝗿𝘁 — 𝟮𝟰,𝟲𝟮𝟭 (𝘳𝘪𝘨𝘩𝘵 𝘢𝘵 𝘤𝘶𝘳𝘳𝘦𝘯𝘵 𝘱𝘳𝘪𝘤𝘦 - 𝘕𝘰-𝘛𝘳𝘢𝘥𝘦 𝘡𝘰𝘯𝘦)
🟢 𝗢𝗽𝗲𝗻𝗶𝗻𝗴 / 𝗟𝗮𝘀𝘁 𝗜𝗻𝘁𝗿𝗮𝗱𝗮𝘆 𝗦𝘂𝗽𝗽𝗼𝗿𝘁 — 𝟮𝟰,𝟰𝟲𝟮
🟢 𝗕𝘂𝘆𝗲𝗿'𝘀 𝗦𝘂𝗽𝗽𝗼𝗿𝘁 𝗭𝗼𝗻𝗲 — 𝟮𝟰,𝟮𝟴𝟮 - 𝟮𝟰,𝟯𝟭𝟱 (𝘥𝘦𝘦𝘱𝘦𝘳 𝘤𝘶𝘴𝘩𝘪𝘰𝘯, 𝘥𝘢𝘴𝘩𝘦𝘥 𝘣𝘰𝘶𝘯𝘤𝘦 𝘱𝘰𝘴𝘴𝘪𝘣𝘭𝘦)
📦 𝙊𝙥𝙚𝙣𝙞𝙣𝙜 𝙍𝙚𝙨𝙞𝙨𝙩𝙖𝙣𝙘𝙚/𝙎𝙪𝙥𝙥𝙤𝙧𝙩: 𝟮𝟰,𝟲𝟮𝟭 → sits right where price closed. Treat the immediate area around this level as a "𝗡𝗼 𝗧𝗿𝗮𝗱𝗲 𝗭𝗼𝗻𝗲" until a clear breakout or breakdown confirms.
━━━━━━━━━━━━━━━━━━━━━━━━
🧭 𝗢𝗩𝗘𝗥𝗔𝗟𝗟 𝗧𝗥𝗘𝗡𝗗 𝗩𝗜𝗘𝗪
Nifty has been choppy through the first days of August, swinging between roughly 24,460 and 24,730 without a decisive breakout in either direction, before closing at 𝟮𝟰,𝟲𝟮𝟰.𝟲𝟱 — right at the 𝟮𝟰,𝟲𝟮𝟭 𝗢𝗽𝗲𝗻𝗶𝗻𝗴 𝗹𝗲𝘃𝗲𝗹. The broader trend since late July remains constructive, but the recent sideways action shows the market pausing to digest its earlier gains.
📌 𝗕𝗶𝗮𝘀: Neutral 𝘢𝘳𝘰𝘶𝘯𝘥 the 24,621 pivot. A sustained break 𝗮𝗯𝗼𝘃𝗲 𝟮𝟰,𝟳𝟯𝟭 opens the path to 𝟮𝟰,𝟵𝟭𝟰 🟢, though this remains a 𝘥𝘢𝘴𝘩𝘦𝘥, 𝘶𝘯𝘤𝘰𝘯𝘧𝘪𝘳𝘮𝘦𝘥 extension. A sustained break 𝗯𝗲𝗹𝗼𝘄 𝟮𝟰,𝟰𝟲𝟮 exposes the 𝟮𝟰,𝟮𝟴𝟮-𝟮𝟰,𝟯𝟭𝟱 𝗕𝘂𝘆𝗲𝗿'𝘀 𝗦𝘂𝗽𝗽𝗼𝗿𝘁 𝗭𝗼𝗻𝗲 🔴, where a 𝘥𝘢𝘴𝘩𝘦𝘥 bounce is possible but not guaranteed.
━━━━━━━━━━━━━━━━━━━━━━━━
🎨 𝗨𝗡𝗗𝗘𝗥𝗦𝗧𝗔𝗡𝗗𝗜𝗡𝗚 𝗧𝗛𝗘 𝗖𝗛𝗔𝗥𝗧 𝗖𝗢𝗟𝗢𝗨𝗥 𝗖𝗢𝗗𝗘
🟢 𝗚𝗿𝗲𝗲𝗻 𝘇𝗶𝗴-𝘇𝗮𝗴 𝗹𝗶𝗻𝗲 → Bullish / Long bias path
🔴 𝗥𝗲𝗱 𝘇𝗶𝗴-𝘇𝗮𝗴 𝗹𝗶𝗻𝗲 → Bearish / Short bias path
🟠 𝗢𝗿𝗮𝗻𝗴𝗲 𝘇𝗶𝗴-𝘇𝗮𝗴 𝗹𝗶𝗻𝗲 → Sideways / 𝗡𝗼-𝗧𝗿𝗮𝗱𝗲 𝗭𝗼𝗻𝗲 — avoid directional bets here
〰️ 𝗗𝗮𝘀𝗵𝗲𝗱 𝗹𝗶𝗻𝗲 → Probable extension of trend — 𝘮𝘢𝘺 𝘰𝘳 𝘮𝘢𝘺 𝘯𝘰𝘵 𝘱𝘭𝘢𝘺 𝘰𝘶𝘵, treat as a roadmap, not a guarantee
━━━━━━━━━━━━━━━━━━━━━━━━
🌅 𝗦𝗖𝗘𝗡𝗔𝗥𝗜𝗢-𝗪𝗜𝗦𝗘 𝗣𝗟𝗔𝗡 (𝘎𝘢𝘱 𝘰𝘧 100+ 𝘱𝘰𝘪𝘯𝘵𝘴 𝘤𝘰𝘯𝘴𝘪𝘥𝘦𝘳𝘦𝘥 𝘢𝘴 𝘢 "𝘎𝘢𝘱")
𝟭️⃣ 𝗚𝗔𝗣-𝗨𝗣 𝗢𝗣𝗘𝗡𝗜𝗡𝗚 (𝘖𝘱𝘦𝘯 𝘢𝘣𝘰𝘷𝘦 ~24,725)
Opens near or above 𝟮𝟰,𝟳𝟯𝟭 and 𝗵𝗼𝗹𝗱𝘀 𝗮𝗯𝗼𝘃𝗲 𝗶𝘁 on retest → follow the 🟢 green path. Long on shallow dips, targeting 𝟮𝟰,𝟵𝟭𝟰 (𝘥𝘢𝘴𝘩𝘦𝘥, 𝘵𝘳𝘦𝘢𝘵 𝘢𝘴 𝘢 𝘱𝘰𝘴𝘴𝘪𝘣𝘭𝘦 𝘦𝘹𝘵𝘦𝘯𝘴𝘪𝘰𝘯 𝘰𝘯𝘭𝘺)
Slips back 𝗯𝗲𝗹𝗼𝘄 𝟮𝟰,𝟳𝟯𝟭 within 15-30 min → treat as an exhaustion gap; don't chase, wait for stabilization near 24,621
⚠️ 𝘈𝘷𝘰𝘪𝘥 𝘣𝘶𝘺𝘪𝘯𝘨 𝘯𝘢𝘬𝘦𝘥 𝘤𝘢𝘭𝘭𝘴 𝘳𝘪𝘨𝘩𝘵 𝘢𝘵 𝘵𝘩𝘦 𝘰𝘱𝘦𝘯 𝘰𝘯 𝘢 𝘨𝘢𝘱-𝘶𝘱 — 𝘱𝘳𝘦𝘮𝘪𝘶𝘮𝘴 𝘳𝘶𝘯 𝘩𝘰𝘵 𝘢𝘯𝘥 𝘤𝘢𝘯 𝘤𝘳𝘶𝘴𝘩 𝘧𝘢𝘴𝘵 𝘰𝘯𝘤𝘦 𝘵𝘩𝘦 𝘨𝘢𝘱 𝘨𝘦𝘵𝘴 𝘢𝘣𝘴𝘰𝘳𝘣𝘦𝘥
𝟮️⃣ 𝗙𝗟𝗔𝗧 𝗢𝗣𝗘𝗡𝗜𝗡𝗚 (𝘖𝘱𝘦𝘯 𝘸𝘪𝘵𝘩𝘪𝘯 ~24,525 - 24,725)
Opens near 𝟮𝟰,𝟲𝟮𝟭 → 🟠 No-Trade Zone, expect chop. Wait for a clean break with volume rather than guessing direction
Sustained close above 𝟮𝟰,𝟳𝟯𝟭 → 🟢 target 𝟮𝟰,𝟵𝟭𝟰
Sustained close below 𝟮𝟰,𝟰𝟲𝟮 → 🔴 target the 𝟮𝟰,𝟮𝟴𝟮-𝟮𝟰,𝟯𝟭𝟱 𝗕𝘂𝘆𝗲𝗿'𝘀 𝗦𝘂𝗽𝗽𝗼𝗿𝘁 𝗭𝗼𝗻𝗲
⚠️ 𝘖𝘯 𝘧𝘭𝘢𝘵/𝘳𝘢𝘯𝘨𝘦 𝘥𝘢𝘺𝘴, 𝘰𝘱𝘵𝘪𝘰𝘯 𝘴𝘦𝘭𝘭𝘦𝘳𝘴 (𝘴𝘱𝘳𝘦𝘢𝘥𝘴 / 𝘐𝘳𝘰𝘯 𝘊𝘰𝘯𝘥𝘰𝘳𝘴) 𝘵𝘦𝘯𝘥 𝘵𝘰 𝘩𝘢𝘷𝘦 𝘢𝘯 𝘦𝘥𝘨𝘦 𝘰𝘷𝘦𝘳 𝘯𝘢𝘪𝘷𝘦 𝘰𝘱𝘵𝘪𝘰𝘯 𝘣𝘶𝘺𝘦𝘳𝘴, 𝘴𝘪𝘯𝘤𝘦 𝘵𝘩𝘦𝘵𝘢 𝘸𝘰𝘳𝘬𝘴 𝘢𝘨𝘢𝘪𝘯𝘴𝘵 𝘭𝘰𝘯𝘨 𝘱𝘳𝘦𝘮𝘪𝘶𝘮 𝘪𝘯 𝘢 𝘤𝘩𝘰𝘱𝘱𝘪𝘯𝘨 𝘮𝘢𝘳𝘬𝘦𝘵
𝟯️⃣ 𝗚𝗔𝗣-𝗗𝗢𝗪𝗡 𝗢𝗣𝗘𝗡𝗜𝗡𝗚 (𝘖𝘱𝘦𝘯 𝘣𝘦𝘭𝘰𝘸 ~24,525)
Opens below 𝟮𝟰,𝟰𝟲𝟮 (Opening/Last Intraday Support) → follow 🔴 red path, short pullbacks towards 24,462-24,621, with the 𝟮𝟰,𝟮𝟴𝟮-𝟮𝟰,𝟯𝟭𝟱 𝗕𝘂𝘆𝗲𝗿'𝘀 𝗦𝘂𝗽𝗽𝗼𝗿𝘁 𝗭𝗼𝗻𝗲 as the next target
At the Buyer's Support Zone, watch for a 𝘥𝘢𝘴𝘩𝘦𝘥 reversal curl on the chart — a possible bounce, not a confirmed one; wait for a clear hold before considering long reversal trades
Quick reclaim back above 𝟮𝟰,𝟰𝟲𝟮 within the opening minutes → possible trap; wait for a hold before flipping bias
⚠️ 𝘋𝘰𝘯'𝘵 𝘴𝘩𝘰𝘳𝘵 𝘱𝘶𝘳𝘦𝘭𝘺 𝘰𝘧𝘧 𝘢 𝘸𝘦𝘢𝘬 𝘰𝘱𝘦𝘯𝘪𝘯𝘨 𝘤𝘢𝘯𝘥𝘭𝘦 — 𝘤𝘰𝘯𝘧𝘪𝘳𝘮 𝘸𝘪𝘵𝘩 𝘴𝘶𝘴𝘵𝘢𝘪𝘯𝘦𝘥 𝘵𝘳𝘢𝘥𝘦 𝘣𝘦𝘭𝘰𝘸 𝘴𝘶𝘱𝘱𝘰𝘳𝘵, 𝘯𝘰𝘵 𝘫𝘶𝘴𝘵 𝘵𝘩𝘦 𝘰𝘱𝘦𝘯𝘪𝘯𝘨 𝘵𝘪𝘤𝘬
━━━━━━━━━━━━━━━━━━━━━━━━
⚠️ 𝗥𝗜𝗦𝗞 𝗠𝗔𝗡𝗔𝗚𝗘𝗠𝗘𝗡𝗧 𝗧𝗜𝗣𝗦 𝗙𝗢𝗥 𝗢𝗣𝗧𝗜𝗢𝗡𝗦 𝗧𝗥𝗔𝗗𝗜𝗡𝗚
💰 𝗣𝗼𝘀𝗶𝘁𝗶𝗼𝗻 𝘀𝗶𝘇𝗶𝗻𝗴 𝗳𝗶𝗿𝘀𝘁 — risk only a small, predefined % of capital per trade
🛑 𝗦𝘁𝗼𝗽-𝗹𝗼𝘀𝘀 𝗶𝘀 𝗻𝗼𝗻-𝗻𝗲𝗴𝗼𝘁𝗶𝗮𝗯𝗹𝗲 — decide your SL before entering, not after watching the P&L
🎯 𝗕𝗼𝗼𝗸 𝗽𝗮𝗿𝘁𝗶𝗮𝗹 𝗽𝗿𝗼𝗳𝗶𝘁𝘀 at each level instead of holding for the "perfect" exit
⏳ 𝗥𝗲𝘀𝗽𝗲𝗰𝘁 𝘁𝗵𝗲𝘁𝗮 𝗱𝗲𝗰𝗮𝘆 — naked long options lose value fast in range-bound/no-trade zones; prefer spreads there
🚫 𝗡𝗲𝘃𝗲𝗿 𝗮𝘃𝗲𝗿𝗮𝗴𝗲 𝗹𝗼𝘀𝗶𝗻𝗴 𝗽𝗼𝘀𝗶𝘁𝗶𝗼𝗻𝘀 — adding to a losing option trade to "recover cost" is a fast way to blow up an account
📰 𝗧𝗿𝗮𝗰𝗸 𝗻𝗲𝘄𝘀/𝗲𝘃𝗲𝗻𝘁𝘀 — global cues and data releases can invalidate technical levels within seconds
🔁 𝗔𝘃𝗼𝗶𝗱 𝗼𝘃𝗲𝗿𝘁𝗿𝗮𝗱𝗶𝗻𝗴 — one clean setup with proper risk-reward beats five impulsive trades
🧊 𝗦𝘁𝗮𝘆 𝗲𝗺𝗼𝘁𝗶𝗼𝗻𝗮𝗹𝗹𝘆 𝗻𝗲𝘂𝘁𝗿𝗮𝗹 — dashed projections are possibilities, not certainties; trade what price confirms
━━━━━━━━━━━━━━━━━━━━━━━━
📝 𝗦𝗨𝗠𝗠𝗔𝗥𝗬 & 𝗖𝗢𝗡𝗖𝗟𝗨𝗦𝗜𝗢𝗡
Nifty closed at 𝟮𝟰,𝟲𝟮𝟰.𝟲𝟱, sitting right at the 𝟮𝟰,𝟲𝟮𝟭 𝗢𝗽𝗲𝗻𝗶𝗻𝗴 𝗹𝗲𝘃𝗲𝗹 after several sessions of choppy, range-bound action.
Gap-up + hold above 24,731 → target 𝟮𝟰,𝟵𝟭𝟰 🟢, dashed and unconfirmed
Flat open near 24,621 → 𝗽𝗮𝘁𝗶𝗲𝗻𝗰𝗲, not prediction 🟠
Gap-down + breakdown of 24,462 → target the 𝟮𝟰,𝟮𝟴𝟮-𝟮𝟰,𝟯𝟭𝟱 𝗕𝘂𝘆𝗲𝗿'𝘀 𝗦𝘂𝗽𝗽𝗼𝗿𝘁 𝗭𝗼𝗻𝗲 🔴, with a dashed bounce possible there
𝘛𝘳𝘢𝘥𝘦 𝘵𝘩𝘦 𝘳𝘦𝘢𝘤𝘵𝘪𝘰𝘯 𝘢𝘵 𝘵𝘩𝘦𝘴𝘦 𝘭𝘦𝘷𝘦𝘭𝘴, 𝘯𝘰𝘵 𝘵𝘩𝘦 𝘢𝘯𝘵𝘪𝘤𝘪𝘱𝘢𝘵𝘪𝘰𝘯 𝘰𝘧 𝘵𝘩𝘦𝘮 — 𝘭𝘦𝘵 𝘱𝘳𝘪𝘤𝘦 𝘤𝘰𝘯𝘧𝘪𝘳𝘮 𝘥𝘪𝘳𝘦𝘤𝘵𝘪𝘰𝘯 𝘣𝘦𝘧𝘰𝘳𝘦 𝘤𝘰𝘮𝘮𝘪𝘵𝘵𝘪𝘯𝘨 𝘤𝘢𝘱𝘪𝘵𝘢𝘭, 𝘢𝘯𝘥 𝘢𝘭𝘸𝘢𝘺𝘴 𝘴𝘪𝘻𝘦 𝘱𝘰𝘴𝘪𝘵𝘪𝘰𝘯𝘴 𝘬𝘦𝘦𝘱𝘪𝘯𝘨 𝘰𝘱𝘵𝘪𝘰𝘯𝘴-𝘴𝘱𝘦𝘤𝘪𝘧𝘪𝘤 𝘳𝘪𝘴𝘬𝘴 (𝘵𝘩𝘦𝘵𝘢, 𝘐𝘝, 𝘭𝘪𝘲𝘶𝘪𝘥𝘪𝘵𝘺) 𝘪𝘯 𝘮𝘪𝘯𝘥.
━━━━━━━━━━━━━━━━━━━━━━━━
⚠️ 𝗗𝗜𝗦𝗖𝗟𝗔𝗜𝗠𝗘𝗥
𝘐 𝘢𝘮 𝘯𝘰𝘵 𝘢 𝘚𝘌𝘉𝘐 𝘳𝘦𝘨𝘪𝘴𝘵𝘦𝘳𝘦𝘥 𝘢𝘯𝘢𝘭𝘺𝘴𝘵. 𝘛𝘩𝘪𝘴 𝘱𝘰𝘴𝘵 𝘪𝘴 𝘱𝘶𝘳𝘦𝘭𝘺 𝘧𝘰𝘳 𝘦𝘥𝘶𝘤𝘢𝘵𝘪𝘰𝘯𝘢𝘭 𝘢𝘯𝘥 𝘪𝘯𝘧𝘰𝘳𝘮𝘢𝘵𝘪𝘰𝘯𝘢𝘭 𝘱𝘶𝘳𝘱𝘰𝘴𝘦𝘴, 𝘣𝘢𝘴𝘦𝘥 𝘰𝘯 𝘵𝘦𝘤𝘩𝘯𝘪𝘤𝘢𝘭 𝘤𝘩𝘢𝘳𝘵 𝘰𝘣𝘴𝘦𝘳𝘷𝘢𝘵𝘪𝘰𝘯𝘴, 𝘢𝘯𝘥 𝘴𝘩𝘰𝘶𝘭𝘥 𝘯𝘰𝘵 𝘣𝘦 𝘤𝘰𝘯𝘴𝘵𝘳𝘶𝘦𝘥 𝘢𝘴 𝘪𝘯𝘷𝘦𝘴𝘵𝘮𝘦𝘯𝘵/𝘵𝘳𝘢𝘥𝘪𝘯𝘨 𝘢𝘥𝘷𝘪𝘤𝘦 𝘰𝘳 𝘢 𝘣𝘶𝘺/𝘴𝘦𝘭𝘭 𝘳𝘦𝘤𝘰𝘮𝘮𝘦𝘯𝘥𝘢𝘵𝘪𝘰𝘯. 𝘗𝘭𝘦𝘢𝘴𝘦 𝘤𝘰𝘯𝘴𝘶𝘭𝘵 𝘢 𝘳𝘦𝘨𝘪𝘴𝘵𝘦𝘳𝘦𝘥 𝘧𝘪𝘯𝘢𝘯𝘤𝘪𝘢𝘭 𝘢𝘥𝘷𝘪𝘴𝘰𝘳 𝘢𝘯𝘥 𝘥𝘰 𝘺𝘰𝘶𝘳 𝘰𝘸𝘯 𝘥𝘶𝘦 𝘥𝘪𝘭𝘪𝘨𝘦𝘯𝘤𝘦 𝘣𝘦𝘧𝘰𝘳𝘦 𝘮𝘢𝘬𝘪𝘯𝘨 𝘢𝘯𝘺 𝘵𝘳𝘢𝘥𝘪𝘯𝘨 𝘰𝘳 𝘪𝘯𝘷𝘦𝘴𝘵𝘮𝘦𝘯𝘵 𝘥𝘦𝘤𝘪𝘴𝘪𝘰𝘯𝘴. 𝘛𝘳𝘢𝘥𝘪𝘯𝘨 𝘪𝘯 𝘦𝘲𝘶𝘪𝘵𝘺, 𝘧𝘶𝘵𝘶𝘳𝘦𝘴, 𝘢𝘯𝘥 𝘰𝘱𝘵𝘪𝘰𝘯𝘴 𝘪𝘯𝘷𝘰𝘭𝘷𝘦𝘴 𝘴𝘶𝘣𝘴𝘵𝘢𝘯𝘵𝘪𝘢𝘭 𝘳𝘪𝘴𝘬 𝘰𝘧 𝘭𝘰𝘴𝘴.
#Nifty50 #NiftyTrading #StockMarket #OptionsTrading #TradingView  Long
Long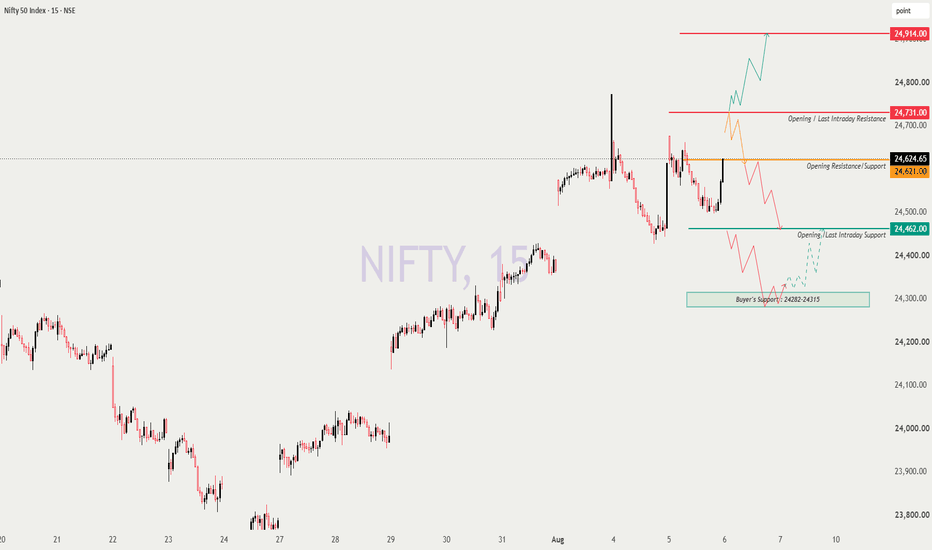
 Education

Trading Masterclass #1Institutional trading means trading like hedge funds, banks, prop firms, and professional desks. They do not trade based on emotions, random tips, or gambling. They use systems, probabilities, risk control, position sizing, discipline, and psychology.
Retail traders often lose because they focus only on “entry.” Institutions focus on:
Risk Management
Capital Protection
Position Sizing
Probability
Psychology
Consistency
Repeatable Edge
In options trading, if you think like institutions, your results can improve significantly  Education

 Education

 Education

Education

 Education

XAUUSD: Buyers Broke the High, But NFP Is the Real Test XAUUSD: Buyers Broke the High, But NFP Is the Real Test
Market Context
Gold is recovering strongly after earlier weakness around the 4,070 area. Buyers have stepped back in, supported by market focus on US-Iran talks and the possibility of a temporary deal to reopen the Strait of Hormuz.
If tension cools, inflation pressure from energy may ease. But the market is not fully calm yet. Traders are also waiting for US July jobs data on Friday, which can bring strong volatility to USD, yields, and gold.
Key point: gold has broken the weak high, but buyers must hold 4,119 to keep this breakout valid.
Technical Structure
Gold is trading around 4,137 after breaking the Weak High and shifting short-term structure bullish. The recent BOS confirms that buyers are currently controlling momentum.
The nearest support is 4,119. This is the Buy Zone and the level buyers need to defend if price pulls back.
If 4,119 holds, gold may continue toward the First Liquidity Target around 4,148 - 4,154. A clean break above this area can open the way toward the Final Liquidity Target at 4,168 - 4,172.
Below the current structure, the Buyer Hold Zone sits around 4,068 - 4,077. If gold loses 4,119, this zone may become the next important retest area.
Key Levels
Current Price: 4,137
Buy Zone: 4,119
First Liquidity Target: 4,148 - 4,154
Final Liquidity Target: 4,168 - 4,172
Buyer Hold Zone: 4,068 - 4,077
Main Demand Zone: 4,040 - 4,060
Deep Demand Zone: 4,000 - 4,020
Bullish Confirmation: Above 4,154
Bearish Risk: Below 4,119
Trading Plan
Buy Scenario
Entry: 4,119 after bullish confirmation
SL: Below 4,077
TP: 4,148 / 4,154 / 4,172
Condition: Price must pull back into the Buy Zone and hold with clear bullish reaction. Buyers need to defend 4,119 and keep the structure above the breakout level.
Buy Breakout
Entry: Above 4,154 after breakout and retest
SL: Below 4,119
TP: 4,168 / 4,172 / 4,200
Condition: Price must break the First Liquidity Target with strength, retest successfully, and continue forming higher lows. Avoid chasing the first breakout candle without confirmation.
Sell Reaction
Entry: 4,168 - 4,172
SL: Above 4,200
TP: 4,154 / 4,137 / 4,119
Condition: Price reaches the Final Liquidity Target and shows bearish rejection. This is only a reaction sell, not the main bias unless gold later breaks below 4,119.
Breakdown Sell
Entry: Below 4,119 after breakdown and retest
SL: Above 4,154
TP: 4,077 / 4,060 / 4,040
Condition: Price loses the Buy Zone, retest fails, and bullish momentum fades. This would weaken the breakout and open the way back toward the Buyer Hold Zone.
Overall Bias
Gold is short-term bullish after breaking the Weak High. Buyers are in control while price holds above 4,119.
If 4,119 holds, the next upside targets are 4,148 - 4,154 and 4,168 - 4,172. If 4,119 breaks, the breakout becomes weaker and gold may return toward 4,068 - 4,077.
Best approach: follow the bullish structure, but do not chase highs before NFP. Wait for a clean pullback to 4,119 or a confirmed breakout above 4,154.
Will buyers hold 4,119 and push into final liquidity, or will NFP volatility break the structure?
Long 
Why Price Hesitates Before a Major MoveOne of the most common questions traders ask is:
"Why does the market pause before making a big move?"
You identify a strong trend.
Price approaches an important level.
Everything looks ready for a breakout.
But instead of moving decisively, the market slows down.
Candles become smaller.
Momentum fades.
Price starts moving sideways.
Many traders become frustrated during these periods. Some enter too early, expecting the breakout to happen immediately. Others assume the trend is over and exit their positions.
Yet these moments of hesitation often tell us something important.
They reveal that the market is preparing for its next decision.
Every Trend Needs a Pause
No market moves in a straight line forever.
Even the strongest trends need time to pause.
Think of a marathon runner.
They cannot sprint for the entire race without slowing down to manage their energy.
Markets behave in a similar way.
After a strong rally, buyers begin taking profits.
Some traders who missed the move hesitate to buy at higher prices.
Sellers test whether demand is weakening.
The result is a temporary balance between buyers and sellers.
Price stops trending and begins consolidating.
This pause doesn't necessarily signal weakness.
Often, it is simply the market catching its breath.
A Battle Between Buyers and Sellers
When price hesitates, it usually means neither side has complete control.
Buyers still believe the trend can continue.
Sellers believe the move has gone too far.
Both groups become active around the same price area.
This creates smaller candles, overlapping price action, and slower momentum.
The market is searching for a new balance.
Eventually, one side gains the upper hand.
That is when the next major move begins.
Consolidation Builds Energy
Many traders dislike sideways markets because they appear unproductive.
In reality, consolidation can be one of the most important phases of a trend.
During consolidation:
Early traders take profits.
New participants enter positions.
Institutions gradually build or reduce exposure.
Buyers and sellers exchange ownership.
This process creates the foundation for the next directional move.
The longer the market remains balanced, the more significant the breakout can become once that balance is broken.
Liquidity Often Forms During Hesitation
Sideways markets also attract liquidity.
As price moves within a narrow range, traders begin placing stop losses above resistance and below support.
Breakout traders prepare for a move in either direction.
Swing traders defend their existing positions.
Over time, a large number of orders gather around the edges of the range.
These areas become attractive to the market because they contain liquidity.
This is one reason price may briefly move beyond the range before revealing its true direction.
The Psychology of Waiting
Not every trader is acting at the same time.
Some traders are confident and enter early.
Others wait for confirmation.
Some fear missing the move.
Others fear entering too soon.
This difference in behavior creates hesitation.
The market slows because participants are making different decisions based on the same information.
Eventually, one opinion becomes stronger than the other.
The balance shifts.
Price responds.
Why False Breakouts Are Common
A market that has been consolidating for a long time attracts attention.
Everyone begins watching the same support and resistance levels.
When price finally breaks out, many traders enter immediately.
But not every breakout continues.
Sometimes price briefly moves beyond the range, triggers stop losses and breakout orders, and then reverses.
This is why experienced traders often focus on confirmation rather than excitement.
The first move isn't always the real move.
Reading the Clues
Price hesitation is not random.
It often leaves clues about the market's condition.
Watch for:
Smaller candle bodies
Decreasing volatility
Repeated tests of support or resistance
Long wicks showing rejection
Declining momentum
Tight trading ranges
These signals suggest the market is moving from imbalance toward balance.
The next question becomes:
Which side will win the battle?
Patience Can Be an Advantage
Many traders feel uncomfortable when the market slows down.
They believe they always need to be in a trade.
Professional traders often think differently.
Sometimes, the highest-probability trade is the one that comes after the market finishes hesitating.
Waiting for confirmation may mean entering slightly later.
But it can also reduce emotional decisions and improve risk management.
Patience is not inactivity.
It is a trading decision.
Final Thoughts
Price hesitation is not a sign that the market is confused.
It is often a sign that buyers and sellers are negotiating value.
During these periods, positions change hands.
Liquidity builds.
Confidence shifts.
The market prepares for its next move.
Instead of seeing consolidation as wasted time, try viewing it as an important chapter in the story of price.
Because major trends rarely begin without first passing through a period of uncertainty.
And sometimes, the quietest candles appear just before the loudest move.
 Education
XAUUSD: Awaiting Wave 5 Buy SetupGold is showing a strong bullish continuation after breaking above the previous resistance structure. From Kelly’s view, the market has already built a clear recovery wave, and the current price action suggests that XAUUSD may only need one corrective pullback before continuing higher into the next Elliott Wave target.
The key idea is simple: gold is bullish, but the best setup is still to wait for a clean buy zone reaction instead of chasing after a sharp rally.
⟡ Market structure
The chart shows gold recovered strongly from the rising support area and pushed through the previous resistance near 4,110–4,120. This breakout is important because the zone that acted as strong resistance earlier may now become a support base if price retests it.
Gold is currently trading around 4,171 after a sharp upside move. Because price has already moved strongly, a short-term correction is normal. The key area to watch is the 4,110–4,120 zone, marked as the Buy wave 5 area.
If buyers defend this zone, gold may continue higher towards the Fibonacci 1.618 target area around 4,220–4,225, where the chart marks the possible end of wave 5.
➤ Key levels
◌ 4,110–4,120: Buy wave 5 zone and key retest area
◌ 4,160–4,175: current price reaction area
◌ 4,220–4,225: End wave 5 / Fibonacci 1.618 target
◌ 4,060–4,075: lower support if correction becomes deeper
◌ Below 4,060: area where the bullish setup starts to weaken
◌ Above 4,225: bullish extension zone if momentum remains strong
⌁ Elliott Wave view
From an Elliott Wave perspective, gold appears to be forming a bullish 5-wave structure after the previous correction ended near the lower trendline.
Wave 1 created the first recovery leg from the base.
Wave 2 pulled back but respected the bullish structure.
Wave 3 pushed strongly higher and broke through resistance.
Wave 4 may now form as a controlled correction back towards 4,110–4,120.
If this zone holds, wave 5 may continue towards 4,220–4,225.
This is why Kelly would not buy aggressively at the current high. The better plan is to wait for wave 4 to finish, then look for confirmation that wave 5 is starting.
▸ Trading scenario
Preferred scenario: wait for gold to correct into the buy zone and show bullish confirmation.
Entry zone: 4,110–4,120 if bullish confirmation appears
Stop loss: below the confirmed wave 4 low or below 4,060
Take profit 1: 4,175
Take profit 2: 4,200
Take profit 3: 4,220–4,225
Alternative scenario: if gold breaks below 4,060 with strong bearish pressure, the bullish wave 5 setup weakens. In that case, price may return to a deeper support area before forming a new recovery structure.
⌁ Kelly’s view
For Kelly, the bullish structure is still strong, but price is now close to an upper reaction area. That means patience is important.
The cleaner plan is to wait for a pullback into 4,110–4,120. If buyers defend this zone, gold may continue the next bullish wave towards the Fibonacci target above.
Gold is still in a bullish Elliott structure.
If the buy zone holds, wave 5 may continue towards 4,220–4,225.
Share your view below. Long 
XAUUSD – Gold Is Ranging, 4,085 May Decide The Next Reaction XAUUSD – Gold Is Ranging, 4,085 May Decide The Next Reaction
Gold is still moving inside a short-term range, and buyers do not look fully confident yet.
Price is currently trading around 4,065 after reacting from the Buy Order Liquidity zone near 4,050. The recovery is visible, but gold has not broken above the nearest resistance with strong momentum. This keeps the market in a cautious structure.
For now, the chart is not showing a clean trend continuation. It is showing a range between support and resistance.
FUNDAMENTAL ANALYSIS
Gold remains under pressure as the U.S. dollar continues to recover from its recent low.
The USD received support from renewed U.S.–Iran tension and stronger U.S. ISM Manufacturing PMI data. This limits gold’s upside because a stronger dollar often makes gold less attractive for buyers.
At the same time, geopolitical risk can still create short-term safe-haven demand. That is why gold may continue to move in a range until the market receives a clearer catalyst.
TECHNICAL ANALYSIS – SMC + FIBONACCI
From an SMC perspective, gold is currently respecting the Buy Order Liquidity zone around 4,050. This area is important because buyers have reacted from it, but the reaction is still not strong enough to confirm a full bullish breakout.
The nearest resistance is around 4,085. This area is marked as the Sell Order Scalping zone and also aligns with Fibonacci extension reaction. If gold reaches this area and rejects, sellers may push price back toward 4,050 again.
Above that, the stronger Sell Order zone sits around 4,105. This is the next important resistance. If price breaks and holds above 4,105, the short-term recovery becomes stronger and gold may attempt a move toward the upper resistance area.
The current structure is simple: gold is holding support, but sellers are waiting above.
KEY PRICE ZONES
Current price: 4,065
Buy Order Liquidity zone: 4,050
Short-term support: 4,050 – 4,060
Sell Order Scalping zone: 4,085
Sell Order zone: 4,105
Upper resistance zone: 4,110 – 4,115
Bullish confirmation: Above 4,105
Bearish pressure returns: Below 4,050
Range structure: 4,050 – 4,105
TRADING SCENARIOS
Buy Scenario
Buy Zone: 4,050 – 4,060
Entry: Bullish rejection, liquidity sweep, or lower-timeframe CHoCH
SL: Below 4,050
TP1: 4,085
TP2: 4,105
TP3: 4,110 – 4,115 if momentum expands
Breakout Buy
Condition: Break and hold above 4,105
Target: 4,110 – 4,115 first, then further extension if buyers keep control
Sell Scenario
Sell Zone: 4,085 – 4,105
Entry: Bearish rejection, failed breakout, or lower-timeframe bearish CHoCH
SL: Above the rejection swing high
TP1: 4,065
TP2: 4,050
TP3: Lower support if 4,050 breaks
Breakdown Sell
Condition: Clean break below 4,050
Target: 4,035 – 4,020
MY VIEW
Gold is still ranging, and I do not want to force a direction too early.
The 4,050 area is the key support. If buyers continue to defend this zone, gold may recover toward 4,085 and 4,105.
But the recovery still needs confirmation. If sellers reject 4,085 – 4,105, gold may return to the lower part of the range again.
For me, this is a reaction-based setup.
If gold holds 4,050 → recovery remains possible.
If gold rejects 4,085 – 4,105 → sellers may return.
If gold breaks above 4,105 → the bullish structure becomes cleaner.
Gold is calm now, but the next reaction around 4,085 may decide the short-term direction.
Do you think gold will break above 4,105, or will sellers defend the range again?
Long 
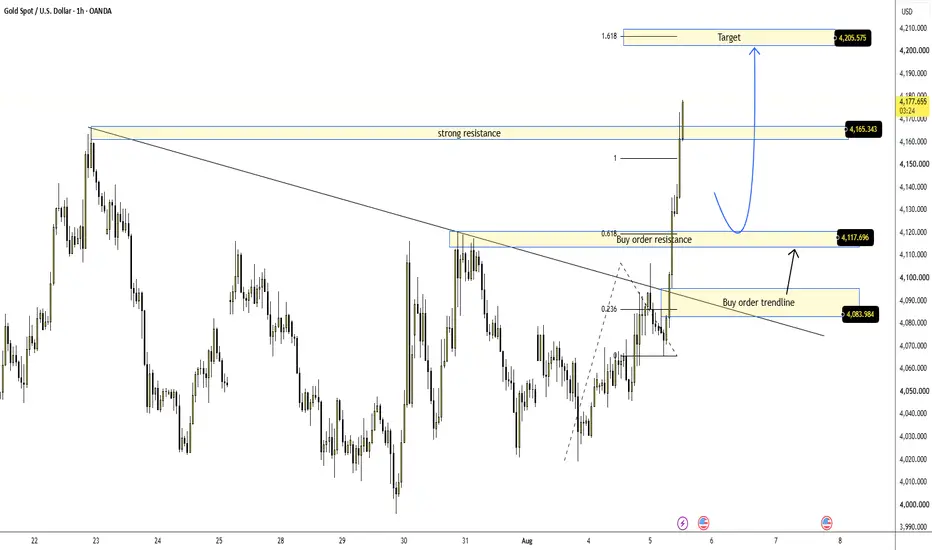
XAUUSD – Gold Breaks Resistance, Is 4,205 The Next Target? XAUUSD – Gold Breaks Resistance, Is 4,205 The Next Target?
Gold is showing a strong bullish reaction today.
Price has broken above the previous strong resistance around 4,165 and is now trading near the breakout area. This is an important shift because gold was previously moving inside a lower consolidation structure, but buyers have now pushed price through a key ceiling.
The move is strong, but the next step is confirmation. Gold needs to hold above the broken resistance or retest the support zones before the bullish continuation becomes cleaner.
FUNDAMENTAL ANALYSIS
Gold is currently supported by renewed buying momentum as traders continue to watch USD movement, Fed expectations, yields, and geopolitical risk.
If the U.S. dollar remains under pressure or yields cool down, gold may continue to attract buyers. However, after a fast move higher, short-term profit-taking can appear near resistance.
For now, the chart shows buyers in control, but reaction around 4,165 and 4,205 will be important.
TECHNICAL ANALYSIS – SMC + FIBONACCI
From an SMC perspective, gold has created a strong bullish displacement from the lower buy order trendline area around 4,084.
The first confirmation came when price broke above the buy order resistance around 4,117. After that, momentum expanded and gold pushed directly into the strong resistance zone around 4,165.
Now price is testing whether this resistance can turn into support. If gold holds above 4,165, the next upside target is around 4,205, which aligns with the Fibonacci extension target on the chart.
If price pulls back, the first support to watch is 4,117. A deeper support sits around 4,084, where the trendline and buy order zone are located.
KEY PRICE ZONES
Current price: 4,165
Broken strong resistance: 4,165
Buy order resistance / support: 4,117
Buy order trendline zone: 4,084
Main bullish target: 4,205
Bullish structure valid: Above 4,117
Strong bullish confirmation: Holding above 4,165
Invalidation for short-term bullish view: Below 4,084
TRADING SCENARIOS
Buy Scenario – Priority View
Buy Zone: 4,117 – 4,165
Entry: Bullish retest, rejection candle, liquidity sweep, or lower-timeframe CHoCH
SL: Below the nearest swing low
TP1: 4,205
TP2: Higher extension if momentum continues
Pullback Buy Scenario
Buy Zone: 4,084 – 4,117
Entry: Wait for clear bullish reaction from the trendline or buy order zone
SL: Below 4,084
TP1: 4,165
TP2: 4,205
Sell Scenario – Only If Breakout Fails
Sell is not the main view while gold holds above 4,117. However, if price fails to stay above 4,165 and breaks back below 4,117, the breakout may become weaker.
Sell Condition: Clean break below 4,117 with bearish retest confirmation
Target: 4,084 first
MY VIEW
Gold is showing a much stronger bullish structure today.
The breakout above 4,165 is the key signal. If buyers can defend this zone, the next target around 4,205 becomes very attractive.
However, I do not want to chase after a strong vertical move. The cleaner plan is to wait for a retest of 4,165 or a deeper pullback toward 4,117.
For now, buyers have control — but 4,165 needs to hold.
Do you think gold will hold above 4,165 and continue toward 4,205?
Long 
Gold H1: Recovery rhythm next sessionGold has just escaped the accumulation zone and moved up around 4,100, showing that buyers are regaining their short-term advantage. However, the price has approached the nearest peak, so buying and chasing here is no longer the optimal choice.
The 4.035–4.065 area is worth watching. This is the price base that has repeatedly absorbed selling pressure and created clear recovery rhythms. If XAUUSD corrects here, a rejection candlestick appears or a strong bullish candlestick appears and then regains 4,080, the bullish structure will be consolidated.
Once it surpasses 4,115, the price can extend its upward momentum to the old peak around 4,150–4,168.
The macro context also slightly supports the uptrend as the weakening USD is helping gold maintain its recovery momentum. Long 
XAUUSD 4166 premium trap — 4084 next? XAUUSD 4166 premium trap — 4084 next?
That spike into 4,127 is loud.
Gold finally pushed out of the messy 4,070 area and ran straight toward premium. Nice move, sure. But now price is not sitting cheap anymore.
This is where I stop trusting late buyers.
We already had the sweep from the OB around 4,018 - 4,038, then ChoCH, then the fast expansion higher. That was the buy reaction. Clean enough. But now gold is heading right into the premium sell zone around 4,150 - 4,166.
That zone is the real test.
Macro is not clean either. Traders are still pricing the Fed path, Middle East headlines keep flipping, and the Hormuz deal story is still not confirmed. One headline says progress. Another side denies talks. That kind of noise usually creates nasty traps.
Main bias is bearish pullback if gold rejects 4,150 - 4,166.
If price taps that premium zone and stalls, I’m watching for sellers to drag it back into the FVG around 4,084 - 4,096. Below that, 4,070 is the next small floor. If that breaks, 4,045 can come back fast.
Trading scenario:
Sell idea only if gold rejects 4,150 - 4,166 with weak candles.
Entry zone: 4,150 - 4,166 after rejection
Alternative entry: below 4,070 after breakdown confirmation
Stop loss: above 4,180
TP1: 4,096
TP2: 4,084
TP3: 4,045
No rejection in premium, no sell. Don’t front-run it.
If gold closes strong above 4,180, this short idea is cooked. Then buyers can keep hunting higher liquidity.
For now, I’m reading this as OB bounce first, premium trap next.
You think 4,166 rejects, or buyers force one more squeeze?
Short 
XAUUSD: Wave 4 correction before Wave 5.Gold is showing a bullish recovery structure after reacting strongly from the lower support area. From Kelly’s view, the current chart suggests that XAUUSD is now moving through wave 4 correction, and if this pullback holds above support, the next bullish wave may continue towards the Fibonacci resistance zone.
The key idea is simple: gold is still building an upward structure, but buyers need to defend the wave 4 zone before wave 5 can develop cleanly.
⟡ Market structure
The chart shows gold recovered from the lower area near 4,020 and created a short-term bullish sequence. Price is now trading around 4,057 after rejecting slightly from the 4,070–4,080 area.
This pullback does not break the bullish structure yet. Instead, it looks like a normal wave 4 correction inside the current Elliott setup.
The important support zone is around 4,045–4,052. If gold holds this area and forms bullish confirmation, price may continue higher towards 4,067, 4,078, and the main wave 5 completion zone near 4,105–4,110.
➤ Key levels
◌ 4,045–4,052: wave 4 buy zone and short-term support
◌ 4,057: current price reaction area
◌ 4,067: first resistance checkpoint
◌ 4,078–4,088: strong Fibonacci resistance area
◌ 4,105–4,110: end wave 5 target zone
◌ Below 4,030: area where the bullish setup starts to weaken
⌁ Elliott Wave view
From an Elliott Wave perspective, gold may be forming a bullish 5-wave recovery after the previous bearish structure slowed down.
Wave 1 created the first recovery push from the low.
Wave 2 corrected but held above the base.
Wave 3 pushed price into the 4,067–4,078 resistance area.
Wave 4 is now likely forming as a controlled pullback near 4,045–4,052.
If this zone holds, wave 5 may continue towards 4,105–4,110.
The downtrend trendline above is still important. A clean break above that trendline would make the bullish continuation stronger, while rejection near the line may create short-term volatility.
▸ Trading scenario
Preferred scenario: wait for gold to hold the wave 4 zone and show bullish confirmation.
Entry zone: 4,045–4,052 if bullish confirmation appears
Stop loss: below the confirmed wave 4 low or below 4,030
Take profit 1: 4,067
Take profit 2: 4,078–4,088
Take profit 3: 4,105–4,110
Alternative scenario: if gold breaks below 4,030 with strong bearish pressure, the bullish wave 5 setup weakens. In that case, price may need to retest the lower base around 4,020 before building a new recovery structure.
⌁ Kelly’s view
For Kelly, gold is still holding a bullish short-term structure, but the market is currently in the decision zone. The best plan is not to chase price near resistance, but to wait for the wave 4 pullback to complete.
If buyers defend 4,045–4,052, gold may continue into wave 5 and target the Fibonacci resistance above.
Gold is correcting inside a bullish Elliott setup.
If wave 4 holds, the next move may continue towards 4,105–4,110.
Share your view below. Long