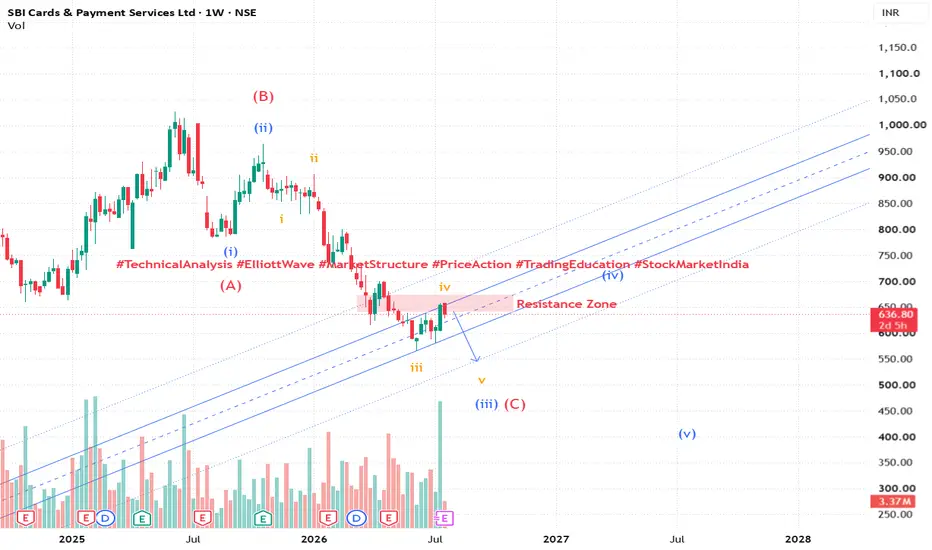
Long
Long
Trading Masterclass #1Institutional trading means trading like hedge funds, banks, prop firms, and professional desks. They do not trade based on emotions, random tips, or gambling. They use systems, probabilities, risk control, position sizing, discipline, and psychology.
Retail traders often lose because they focus only on “entry.” Institutions focus on:
Risk Management
Capital Protection
Position Sizing
Probability
Psychology
Consistency
Repeatable Edge
In options trading, if you think like institutions, your results can improve significantly




XAUUSD: Bullish wave structure formingGold is trying to rebuild bullish momentum after defending the lower reaction area near 4,050. From Kelly’s view, the chart is showing an early Elliott recovery structure, but buyers still need confirmation above the short-term resistance before the next upside wave becomes stronger.
The key idea is simple: gold is recovering, but the clean bullish continuation needs price to hold above support and confirm the next wave 4 base.
⟡ Market structure
The chart shows gold previously rejected from the 4,160 area and moved lower inside a corrective structure. However, price has now reacted from the lower base and started forming a new short-term bullish sequence.
Current price is around 4,065. The nearest support is around 4,048–4,055, where buyers have already shown reaction. If gold continues to hold above this zone, the next important area to watch is the 4,085–4,090 zone marked as “Buy wave 4 after the price confirms.”
A clean break and hold above this zone may open the path towards the 4,110–4,115 resistance first. If bullish momentum expands, gold may continue towards the larger wave 5 target around 4,160–4,165.
➤ Key levels
◌ 4,048–4,055: short-term support and current recovery base
◌ 4,065: current price reaction area
◌ 4,085–4,090: buy wave 4 confirmation zone
◌ 4,110–4,115: nearest resistance and breakout checkpoint
◌ 4,160–4,165: major resistance and possible wave 5 target
◌ Below 4,040: area where the bullish setup starts to weaken
⌁ Elliott Wave view
From an Elliott Wave perspective, gold may be forming a new bullish 5-wave structure after the recent correction.
Wave 1 has started from the lower base.
Wave 2 created a pullback but did not fully break the recovery structure.
Wave 3 may develop if price breaks above 4,085–4,090 with strength.
Wave 4 may later retest that area as support.
Wave 5 could then extend towards 4,160–4,165, where the chart marks the upper target zone.
This is why Kelly is watching confirmation carefully. The bullish view is improving, but the market still needs to prove that the recovery is not only a small corrective bounce.
▸ Trading scenario
Preferred scenario: wait for gold to confirm above the 4,085–4,090 area, then look for bullish continuation.
Entry zone: 4,085–4,090 after confirmation or retest
Aggressive buy zone: 4,048–4,055 only if bullish reaction appears
Stop loss: below the confirmed swing low or below 4,040
Take profit 1: 4,110–4,115
Take profit 2: 4,160–4,165
Take profit 3: higher only if wave 5 breaks with strong momentum
Alternative scenario: if gold breaks below 4,040 with strong bearish pressure, the bullish Elliott structure weakens. In that case, price may return to a deeper support area before forming a new recovery base.
⌁ Kelly’s view
For Kelly, gold is showing a bullish recovery structure, but confirmation is still the main condition. The strongest setup is not to chase the current price, but to wait for price to reclaim the wave 4 confirmation zone.
Gold is building a bullish Elliott structure.
If buyers hold support and confirm above 4,085–4,090, the next wave may continue towards 4,110 and 4,160.
Share your view below.  Long
Long
XAUUSD – New Week, Gold Is Waiting For A Clear Breakout XAUUSD – New Week, Gold Is Waiting For A Clear Breakout
Gold is entering the new week in a relatively quiet price zone, but one that is highly decisive.
Price is currently trading around 4,063 after holding firmly above the 4,050 area. The market has not shown a clear directional impulse yet, but the chart structure suggests that gold is accumulating pressure between the Buy Order zone below and the Sell Order resistance above.
This is the type of structure where patience becomes the most important factor. Gold is waiting for a clear breakout, and the next direction will depend on how price reacts around 4,065 and 4,100.
FUNDAMENTAL ANALYSIS
Gold remains in a balanced state between a weakening USD and cautious market sentiment.
The USD continues to face pressure, partly driven by weakness in USD/JPY and improving expectations around diplomatic efforts in the Middle East. This provides short-term support for gold.
However, gold is not fully bullish yet. The daily structure still suggests that sellers may retain an advantage if price fails to break key resistance zones. The market is also waiting for further US economic data, Fed expectations, and geopolitical developments to define a clearer direction.
This week, gold is expected to remain highly sensitive to USD movements, yields, and overall risk sentiment.
TECHNICAL ANALYSIS – SMC + FIBONACCI
From an SMC perspective, gold is still trading within a broad corrective structure. The higher timeframe trend remains heavy, but short-term price action is attempting to form a base from the lower region.
The Buy Order zone at 4,050 – 4,065 is now the first key support. If price continues to hold above this area, buyers may attempt to push price toward higher resistance levels.
The nearest resistance is located at 4,079. If price breaks and holds above this level, gold could extend its move toward the Sell Order zone at 4,095 – 4,100.
Above that, the stronger resistance sits at 4,130. This is the area where sellers are likely to react again. If buyers manage to break above 4,130 decisively, the recovery structure becomes significantly clearer.
On the downside, if gold loses 4,050, the recovery structure weakens and price may return toward lower support around 4,035 – 4,020.
KEY PRICE ZONES
Current price: 4,063
Buy Order zone: 4,050 – 4,065
Lower support: 4,035 – 4,020
Near resistance: 4,079
Sell Order resistance: 4,095 – 4,100
Main resistance: 4,130
Bullish confirmation: Above 4,100
Weekly upside target: 4,130
Bearish pressure returns: Below 4,050
TRADING SCENARIOS
Buy Scenario
Buy Zone: 4,050 – 4,065
Entry: Bullish reaction, liquidity sweep, or lower timeframe CHoCH
SL: Below 4,050
TP1: 4,079
TP2: 4,095 – 4,100
TP3: 4,130
Breakout Buy
Condition: Break and hold above 4,100
Target: 4,130 first, then further extension if momentum continues
Sell Scenario
Sell Zone: 4,095 – 4,130
Entry: Bearish rejection, false breakout, or lower timeframe bearish CHoCH
SL: Above the rejection swing high
TP1: 4,065
TP2: 4,050
TP3: 4,035 – 4,020
Breakdown Sell
Condition: Clean break below 4,050
Target: 4,035 – 4,020
MY VIEW
Gold is starting the week with a balanced structure.
The 4,050 – 4,065 support zone is the most important area right now. If buyers defend this level, gold may continue its recovery toward 4,100 and even 4,130.
However, I still need confirmation. The daily structure has not fully shifted bullish, and sellers may still react strongly at higher resistance zones.
For me, the clearest scenario is:
If gold holds 4,050 → I will watch for a recovery move.
If gold gets rejected at 4,100 – 4,130 → I will wait for sellers to return.
This week may start slowly, but the breakout from this range will determine the next major direction.
What do you think — will gold break above 4,100 this week, or will sellers continue to defend the resistance zone?
Long 
 Short
Short
XAUUSD: 4,075 – The First Real Test of This Recovery XAUUSD: 4,075 – The First Real Test of This Recovery
Market Context
Gold opens the new week around 4,061 after breaking out of its previous downtrend channel. Buyers are showing early recovery strength, supported by easing geopolitical tension as expectations of a US–Iran breakthrough reduce some inflation pressure from the energy side.
However, the market is not fully bullish yet. Last week, gold was rejected from the Premium Supply Zone at 4,100 – 4,118, where sellers are still clearly active. With Fed expectations, USD strength, Treasury yields, and energy volatility still in play, the market needs confirmation before any real continuation higher.
Key point: Gold is recovering, but 4,075 and 4,100 – 4,118 will decide whether this is a real bullish expansion or just another rejection phase.
Weekly Outlook
Early week: Watch how price behaves around 4,050 – 4,065. This is the first defense zone for buyers.
Midweek: A clean break above 4,075 opens the path toward 4,100 – 4,118.
Main risk: Rejection from Premium Supply can drag price back toward 4,000 – 4,010.
Bullish continuation only strengthens if price breaks and holds above 4,118.
Technical Structure
Gold has already broken out of the previous downtrend channel, shifting short-term structure into a recovery phase. However, the rejection from 4,100 – 4,118 confirms that sellers are still defending premium pricing.
The current zone 4,050 – 4,065 is where buyers must hold structure. If this area holds, price has room to push toward 4,075.
4,075 is the first key liquidity / sell-scalping level. A strong break above it opens the way back into Premium Supply at 4,100 – 4,118.
If 4,050 fails, the recovery structure weakens and price is likely to rotate back into Deep Demand at 4,000 – 4,010.
Key Levels
Current Price: 4,061
Buyer Reaction Zone: 4,050 – 4,065
First Test / Liquidity Level: 4,075
Premium Supply Zone: 4,100 – 4,118
Deep Demand Zone: 4,000 – 4,010
Bullish Confirmation: Above 4,118
Bearish Invalidation: Below 4,050
Trading Plan
Buy Setup
Entry: 4,050 – 4,065 (after bullish confirmation)
SL: Below 4,040
TP: 4,075 / 4,100 / 4,118
Condition: Price must hold the buyer zone and show clear rejection of downside pressure. Structure must remain above 4,050 to sustain recovery momentum.
Buy Breakout
Entry: Above 4,075 (break + retest)
SL: Below 4,050
TP: 4,100 / 4,118 / 4,160
Condition: Strong breakout above 4,075 followed by successful retest. This confirms buyers are reclaiming control and targeting Premium Supply.
Sell Setup
Entry: 4,100 – 4,118
SL: Above 4,140
TP: 4,075 / 4,061 / 4,050
Condition: Price reaches Premium Supply and shows rejection. Sellers remain dominant unless price closes above 4,118.
Breakdown Sell
Entry: Below 4,050 (break + retest)
SL: Above 4,075
TP: 4,030 / 4,010 / 4,000
Condition: Loss of buyer reaction zone with failed retest. This signals recovery failure and continuation back into Deep Demand.
Overall Bias
Gold is in early recovery mode after breaking the downtrend channel, but confirmation is still missing.
Above 4,075: buyers regain momentum toward 4,100 – 4,118
Above 4,118: bullish expansion toward 4,160 – 4,200
Below 4,050: recovery fails, rotation back to 4,000 – 4,010
Best approach: wait for confirmation at 4,050 – 4,065 or 4,075. Avoid chasing price while it remains below Premium Supply.
The key question this week:
Will buyers break 4,075 and challenge 4,118, or will sellers defend supply once again?
Long 
XAUUSD 4080 cap — 4020 liquidity next XAUUSD 4080 cap — 4020 liquidity next
That 4,060 bounce? Yeah, I’m not buying it yet.
Gold popped early Monday because headlines cooled down a bit. Trump delaying Iran strikes, Hormuz deal talk, Fed holding rates steady. Fine. That gives buyers a reason to breathe.
But the chart still looks heavy.
Price ran into the 4,059 - 4,080 Fibo area and started acting tired. That is the problem zone. Not discount anymore. Not a clean buy zone. More like a place where late buyers can get baited before the next flush.
The bigger move from 4,110 already showed rejection. Then we got that weak recovery back into resistance. Classic.
Main bias stays bearish pullback while gold trades below 4,080 - 4,100.
If sellers defend this area, 4,040 is the first level to crack. Below that, 4,020 is the liquidity draw. And if pressure keeps going, the OB around 4,010 - 3,995 is where I’d expect the real reaction.
Trading scenario:
Sell idea only if gold rejects 4,059 - 4,080 or breaks below 4,040 with clean pressure.
Entry zone: 4,059 - 4,080 after rejection
Alternative entry: below 4,040 after breakdown confirmation
Stop loss: above 4,110
TP1: 4,040
TP2: 4,020
TP3: 4,010 - 3,995
No rejection, no sell. No breakdown, no chase.
If gold closes strong above 4,100, this short idea gets messy. Then buyers can squeeze toward 4,141.
For now, this looks like Monday bounce into resistance.
You think 4,080 holds, or buyers finally force 4,100?
Short 
XAUUSD — 4,030 May Wake the BounceXAUUSD — 4,030 May Wake the Bounce
Gold is opening the new week with a quieter tone, but the chart still feels like it is building a story from the lower side of the range.
Last week, price spent a lot of time shaking both buyers and sellers. Gold pushed up, failed to fully hold the higher area, then came back down to sweep liquidity near 3,996.055. That sweep is important because price did not continue bleeding lower into the discount zone around 3,959.800. Instead, it reacted, reclaimed the IFVG area, and started trading back near 4,050 - 4,060.
For newer traders, this is the part to focus on: when price sweeps a low, returns above it, and then retests an imbalance zone, that area can become a “springboard” if buyers are still active. Right now, the IFVG around 4,015 - 4,030 is the zone where I want to see the market breathe and hold.
My main view for the new week is bullish while gold stays above 4,015 - 4,030, with 3,996.055 acting as the deeper line buyers should protect. The fundamental background is mixed: tensions around Iran are cooling slightly, Fed kept rates steady, but the possibility of higher rates later in the year still keeps pressure on gold. So I do not expect a perfectly clean rally. I want confirmation.
If price holds the IFVG and starts building higher lows again, the next upside magnet is 4,100.685. A clean break above that level could open the way toward 4,166.130, where the next larger liquidity area is resting.
This bullish idea becomes weak if gold loses 3,996.055 and cannot recover. That would tell me the sweep failed, and price may need to revisit the deeper discount zone first.
Key price zones to watch
Current reaction area: 4,050 - 4,070
Main demand / IFVG zone: 4,015 - 4,030
Bullish confirmation zone: clean hold above 4,030
First upside target: 4,100.685
Main upside liquidity target: 4,166.130
Lower support if buyers fail: 3,996.055
Major discount zone: 3,959.800
Invalidation: clean close below 3,996.055
Do you see this 4,030 IFVG as the base for the new week, or would you wait for 4,100 to break before trusting the bullish continuation?
Long 
NIFTY : Trading levels and Plan for 03-Aug-2026𝗡𝗜𝗙𝗧𝗬 𝟱𝟬 - 𝗜𝗡𝗧𝗥𝗔𝗗𝗔𝗬 𝗧𝗥𝗔𝗗𝗜𝗡𝗚 𝗣𝗟𝗔𝗡 | 𝟯𝗿𝗱 𝗔𝘂𝗴𝘂𝘀𝘁 𝟮𝟬𝟮𝟲 📊
𝗧𝗶𝗺𝗲𝗳𝗿𝗮𝗺𝗲: 15 Min | 𝗟𝗮𝘀𝘁 𝗖𝗹𝗼𝘀𝗲: 24,366.70 (-23.50 / -0.10%) | 𝗥𝗮𝗻𝗴𝗲: 24,359.65 - 24,392.40
━━━━━━━━━━━━━━━━━━━━━━━━
🔎 𝗞𝗘𝗬 𝗟𝗘𝗩𝗘𝗟𝗦 𝗧𝗢 𝗪𝗔𝗧𝗖𝗛
🔴 𝗘𝘅𝘁𝗲𝗻𝗱𝗲𝗱 𝗥𝗲𝘀𝗶𝘀𝘁𝗮𝗻𝗰𝗲 — 𝟮𝟰,𝟱𝟳𝟰 (𝘚𝘸𝘪𝘯𝘨 𝘵𝘢𝘳𝘨𝘦𝘵 𝘣𝘦𝘺𝘰𝘯𝘥 𝘵𝘩𝘦 𝘻𝘰𝘯𝘦)
🟠 𝗢𝗽𝗲𝗻𝗶𝗻𝗴 / 𝗟𝗮𝘀𝘁 𝗜𝗻𝘁𝗿𝗮𝗱𝗮𝘆 𝗥𝗲𝘀𝗶𝘀𝘁𝗮𝗻𝗰𝗲 — 𝟮𝟰,𝟰𝟲𝟮 (𝘕𝘰-𝘛𝘳𝘢𝘥𝘦 𝘡𝘰𝘯𝘦 𝘛𝘰𝘱)
⚪ 𝗥𝗲𝗳𝗲𝗿𝗲𝗻𝗰𝗲 𝗣𝗶𝘃𝗼𝘁 — 𝟮𝟰,𝟯𝟲𝟲.𝟳𝟬 (𝘓𝘢𝘴𝘵 𝘊𝘭𝘰𝘴𝘦)
🟠 𝗢𝗽𝗲𝗻𝗶𝗻𝗴 𝗦𝘂𝗽𝗽𝗼𝗿𝘁 — 𝟮𝟰,𝟯𝟮𝟳 (𝘕𝘰-𝘛𝘳𝘢𝘥𝘦 𝘡𝘰𝘯𝘦 𝘉𝘰𝘵𝘵𝘰𝘮)
🟢 𝗟𝗮𝘀𝘁 𝗜𝗻𝘁𝗿𝗮𝗱𝗮𝘆 𝗦𝘂𝗽𝗽𝗼𝗿𝘁 — 𝟮𝟰,𝟮𝟰𝟳
🟢 𝗘𝘅𝘁𝗲𝗻𝗱𝗲𝗱 𝗦𝘂𝗽𝗽𝗼𝗿𝘁 — 𝟮𝟰,𝟭𝟯𝟱 (𝘥𝘢𝘴𝘩𝘦𝘥 / 𝘶𝘯𝘤𝘰𝘯𝘧𝘪𝘳𝘮𝘦𝘥)
📦 𝙊𝙥𝙚𝙣𝙞𝙣𝙜 𝙕𝙤𝙣𝙚: 𝟮𝟰,𝟯𝟮𝟳 - 𝟮𝟰,𝟰𝟲𝟮 → marked as the "𝗡𝗼 𝗧𝗿𝗮𝗱𝗲 𝗭𝗼𝗻𝗲" on the chart. Price is currently sitting inside this box, right at the pivot of 24,366.70.
━━━━━━━━━━━━━━━━━━━━━━━━
🧭 𝗢𝗩𝗘𝗥𝗔𝗟𝗟 𝗧𝗥𝗘𝗡𝗗 𝗩𝗜𝗘𝗪
Nifty has been on a strong uptrend since the 27th July low, rallying from the 23,950 zone to a high near 24,392 before closing slightly lower at 𝟮𝟰,𝟯𝟲𝟲.𝟳𝟬 — right inside the 𝟮𝟰,𝟯𝟮𝟳-𝟮𝟰,𝟰𝟲𝟮 𝗢𝗽𝗲𝗻𝗶𝗻𝗴 𝗭𝗼𝗻𝗲. After such a sharp run-up, a pause/consolidation inside this zone is a healthy technical development before the next directional move.
📌 𝗕𝗶𝗮𝘀: Neutral 𝘪𝘯𝘴𝘪𝘥𝘦 the zone, with an underlying bullish tilt given the strength of the recent rally. A sustained break 𝗮𝗯𝗼𝘃𝗲 𝟮𝟰,𝟰𝟲𝟮 opens the path to 𝟮𝟰,𝟱𝟳𝟰 🟢. A sustained break 𝗯𝗲𝗹𝗼𝘄 𝟮𝟰,𝟯𝟮𝟳 exposes 𝟮𝟰,𝟮𝟰𝟳 🔴, and only if momentum truly extends, the 𝘥𝘢𝘴𝘩𝘦𝘥, 𝘶𝘯𝘤𝘰𝘯𝘧𝘪𝘳𝘮𝘦𝘥 leg down to 𝟮𝟰,𝟭𝟯𝟱.
━━━━━━━━━━━━━━━━━━━━━━━━
🎨 𝗨𝗡𝗗𝗘𝗥𝗦𝗧𝗔𝗡𝗗𝗜𝗡𝗚 𝗧𝗛𝗘 𝗖𝗛𝗔𝗥𝗧 𝗖𝗢𝗟𝗢𝗨𝗥 𝗖𝗢𝗗𝗘
🟢 𝗚𝗿𝗲𝗲𝗻 𝘇𝗶𝗴-𝘇𝗮𝗴 𝗹𝗶𝗻𝗲 → Bullish / Long bias path
🔴 𝗥𝗲𝗱 𝘇𝗶𝗴-𝘇𝗮𝗴 𝗹𝗶𝗻𝗲 → Bearish / Short bias path
🟠 𝗢𝗿𝗮𝗻𝗴𝗲 𝘇𝗶𝗴-𝘇𝗮𝗴 𝗹𝗶𝗻𝗲 → Sideways / 𝗡𝗼-𝗧𝗿𝗮𝗱𝗲 𝗭𝗼𝗻𝗲 — avoid directional bets here
〰️ 𝗗𝗮𝘀𝗵𝗲𝗱 𝗹𝗶𝗻𝗲 → Probable extension of trend — 𝘮𝘢𝘺 𝘰𝘳 𝘮𝘢𝘺 𝘯𝘰𝘵 𝘱𝘭𝘢𝘺 𝘰𝘶𝘵, treat as a roadmap, not a guarantee
━━━━━━━━━━━━━━━━━━━━━━━━
🌅 𝗦𝗖𝗘𝗡𝗔𝗥𝗜𝗢-𝗪𝗜𝗦𝗘 𝗣𝗟𝗔𝗡 (𝘎𝘢𝘱 𝘰𝘧 100+ 𝘱𝘰𝘪𝘯𝘵𝘴 𝘤𝘰𝘯𝘴𝘪𝘥𝘦𝘳𝘦𝘥 𝘢𝘴 𝘢 "𝘎𝘢𝘱")
𝟭️⃣ 𝗚𝗔𝗣-𝗨𝗣 𝗢𝗣𝗘𝗡𝗜𝗡𝗚 (𝘖𝘱𝘦𝘯 𝘢𝘣𝘰𝘷𝘦 ~24,466)
Opens above the 𝟮𝟰,𝟯𝟮𝟳-𝟮𝟰,𝟰𝟲𝟮 zone and 𝗵𝗼𝗹𝗱𝘀 𝗮𝗯𝗼𝘃𝗲 𝟮𝟰,𝟰𝟲𝟮 on retest → follow the 🟢 green path. Long on shallow dips, targeting 𝟮𝟰,𝟱𝟳𝟰
Slips back 𝗶𝗻𝘀𝗶𝗱𝗲 𝟮𝟰,𝟯𝟮𝟳-𝟮𝟰,𝟰𝟲𝟮 within 15-30 min → treat as an exhaustion gap; don't chase, wait for stabilization
⚠️ 𝘈𝘷𝘰𝘪𝘥 𝘣𝘶𝘺𝘪𝘯𝘨 𝘯𝘢𝘬𝘦𝘥 𝘤𝘢𝘭𝘭𝘴 𝘳𝘪𝘨𝘩𝘵 𝘢𝘵 𝘵𝘩𝘦 𝘰𝘱𝘦𝘯 𝘰𝘯 𝘢 𝘨𝘢𝘱-𝘶𝘱 — 𝘱𝘳𝘦𝘮𝘪𝘶𝘮𝘴 𝘳𝘶𝘯 𝘩𝘰𝘵 𝘢𝘯𝘥 𝘤𝘢𝘯 𝘤𝘳𝘶𝘴𝘩 𝘧𝘢𝘴𝘵 𝘰𝘯𝘤𝘦 𝘵𝘩𝘦 𝘨𝘢𝘱 𝘨𝘦𝘵𝘴 𝘢𝘣𝘴𝘰𝘳𝘣𝘦𝘥
𝟮️⃣ 𝗙𝗟𝗔𝗧 𝗢𝗣𝗘𝗡𝗜𝗡𝗚 (𝘖𝘱𝘦𝘯 𝘸𝘪𝘵𝘩𝘪𝘯 ~24,266 - 24,466)
Opens inside 𝟮𝟰,𝟯𝟮𝟳-𝟮𝟰,𝟰𝟲𝟮 → 🟠 No-Trade Zone, expect chop. Wait for a clean break with volume rather than guessing direction
Sustained close above 𝟮𝟰,𝟰𝟲𝟮 → 🟢 target 𝟮𝟰,𝟱𝟳𝟰
Sustained close below 𝟮𝟰,𝟯𝟮𝟳 → 🔴 target 𝟮𝟰,𝟮𝟰𝟳, with a dashed extension to 𝟮𝟰,𝟭𝟯𝟱 only if the breakdown truly extends
⚠️ 𝘖𝘯 𝘧𝘭𝘢𝘵/𝘳𝘢𝘯𝘨𝘦 𝘥𝘢𝘺𝘴, 𝘰𝘱𝘵𝘪𝘰𝘯 𝘴𝘦𝘭𝘭𝘦𝘳𝘴 (𝘴𝘱𝘳𝘦𝘢𝘥𝘴 / 𝘐𝘳𝘰𝘯 𝘊𝘰𝘯𝘥𝘰𝘳𝘴) 𝘵𝘦𝘯𝘥 𝘵𝘰 𝘩𝘢𝘷𝘦 𝘢𝘯 𝘦𝘥𝘨𝘦 𝘰𝘷𝘦𝘳 𝘯𝘢𝘪𝘷𝘦 𝘰𝘱𝘵𝘪𝘰𝘯 𝘣𝘶𝘺𝘦𝘳𝘴, 𝘴𝘪𝘯𝘤𝘦 𝘵𝘩𝘦𝘵𝘢 𝘸𝘰𝘳𝘬𝘴 𝘢𝘨𝘢𝘪𝘯𝘴𝘵 𝘭𝘰𝘯𝘨 𝘱𝘳𝘦𝘮𝘪𝘶𝘮 𝘪𝘯 𝘢 𝘤𝘩𝘰𝘱𝘱𝘪𝘯𝘨 𝘮𝘢𝘳𝘬𝘦𝘵
𝟯️⃣ 𝗚𝗔𝗣-𝗗𝗢𝗪𝗡 𝗢𝗣𝗘𝗡𝗜𝗡𝗚 (𝘖𝘱𝘦𝘯 𝘣𝘦𝘭𝘰𝘸 ~24,266)
Opens near or below 𝟮𝟰,𝟮𝟰𝟳 (Last Intraday Support) → follow 🔴 red path, short pullbacks towards 24,247-24,327, with 𝟮𝟰,𝟭𝟯𝟱 as the next target
At 𝟮𝟰,𝟭𝟯𝟱, watch for a 𝘥𝘢𝘴𝘩𝘦𝘥 reversal curl on the chart — a possible bounce, not a confirmed one; wait for a clear hold before considering long reversal trades
Quick reclaim back above 𝟮𝟰,𝟮𝟰𝟳 within the opening minutes → possible trap; wait for a hold before flipping bias
⚠️ 𝘋𝘰𝘯'𝘵 𝘴𝘩𝘰𝘳𝘵 𝘱𝘶𝘳𝘦𝘭𝘺 𝘰𝘧𝘧 𝘢 𝘸𝘦𝘢𝘬 𝘰𝘱𝘦𝘯𝘪𝘯𝘨 𝘤𝘢𝘯𝘥𝘭𝘦 — 𝘤𝘰𝘯𝘧𝘪𝘳𝘮 𝘸𝘪𝘵𝘩 𝘴𝘶𝘴𝘵𝘢𝘪𝘯𝘦𝘥 𝘵𝘳𝘢𝘥𝘦 𝘣𝘦𝘭𝘰𝘸 𝘴𝘶𝘱𝘱𝘰𝘳𝘵, 𝘯𝘰𝘵 𝘫𝘶𝘴𝘵 𝘵𝘩𝘦 𝘰𝘱𝘦𝘯𝘪𝘯𝘨 𝘵𝘪𝘤𝘬
━━━━━━━━━━━━━━━━━━━━━━━━
⚠️ 𝗥𝗜𝗦𝗞 𝗠𝗔𝗡𝗔𝗚𝗘𝗠𝗘𝗡𝗧 𝗧𝗜𝗣𝗦 𝗙𝗢𝗥 𝗢𝗣𝗧𝗜𝗢𝗡𝗦 𝗧𝗥𝗔𝗗𝗜𝗡𝗚
💰 𝗣𝗼𝘀𝗶𝘁𝗶𝗼𝗻 𝘀𝗶𝘇𝗶𝗻𝗴 𝗳𝗶𝗿𝘀𝘁 — risk only a small, predefined % of capital per trade
🛑 𝗦𝘁𝗼𝗽-𝗹𝗼𝘀𝘀 𝗶𝘀 𝗻𝗼𝗻-𝗻𝗲𝗴𝗼𝘁𝗶𝗮𝗯𝗹𝗲 — decide your SL before entering, not after watching the P&L
🎯 𝗕𝗼𝗼𝗸 𝗽𝗮𝗿𝘁𝗶𝗮𝗹 𝗽𝗿𝗼𝗳𝗶𝘁𝘀 at each level instead of holding for the "perfect" exit
⏳ 𝗥𝗲𝘀𝗽𝗲𝗰𝘁 𝘁𝗵𝗲𝘁𝗮 𝗱𝗲𝗰𝗮𝘆 — naked long options lose value fast in range-bound/no-trade zones; prefer spreads there
🚫 𝗡𝗲𝘃𝗲𝗿 𝗮𝘃𝗲𝗿𝗮𝗴𝗲 𝗹𝗼𝘀𝗶𝗻𝗴 𝗽𝗼𝘀𝗶𝘁𝗶𝗼𝗻𝘀 — adding to a losing option trade to "recover cost" is a fast way to blow up an account
📰 𝗧𝗿𝗮𝗰𝗸 𝗻𝗲𝘄𝘀/𝗲𝘃𝗲𝗻𝘁𝘀 — global cues and data releases can invalidate technical levels within seconds
🔁 𝗔𝘃𝗼𝗶𝗱 𝗼𝘃𝗲𝗿𝘁𝗿𝗮𝗱𝗶𝗻𝗴 — one clean setup with proper risk-reward beats five impulsive trades
🧊 𝗦𝘁𝗮𝘆 𝗲𝗺𝗼𝘁𝗶𝗼𝗻𝗮𝗹𝗹𝘆 𝗻𝗲𝘂𝘁𝗿𝗮𝗹 — dashed projections are possibilities, not certainties; trade what price confirms
━━━━━━━━━━━━━━━━━━━━━━━━
📝 𝗦𝗨𝗠𝗠𝗔𝗥𝗬 & 𝗖𝗢𝗡𝗖𝗟𝗨𝗦𝗜𝗢𝗡
Nifty closed at 𝟮𝟰,𝟯𝟲𝟲.𝟳𝟬, sitting right inside the 𝟮𝟰,𝟯𝟮𝟳-𝟮𝟰,𝟰𝟲𝟮 𝗡𝗼-𝗧𝗿𝗮𝗱𝗲 𝗭𝗼𝗻𝗲 after a sharp rally off the late-July lows.
Gap-up + hold above 24,462 → target 𝟮𝟰,𝟱𝟳𝟰 🟢
Flat open inside 24,327-24,462 → 𝗽𝗮𝘁𝗶𝗲𝗻𝗰𝗲, not prediction 🟠
Gap-down + breakdown of 24,327 → target 𝟮𝟰,𝟮𝟰𝟳, then 𝟮𝟰,𝟭𝟯𝟱 🔴, with a dashed bounce zone at the floor
𝘛𝘳𝘢𝘥𝘦 𝘵𝘩𝘦 𝘳𝘦𝘢𝘤𝘵𝘪𝘰𝘯 𝘢𝘵 𝘵𝘩𝘦𝘴𝘦 𝘭𝘦𝘷𝘦𝘭𝘴, 𝘯𝘰𝘵 𝘵𝘩𝘦 𝘢𝘯𝘵𝘪𝘤𝘪𝘱𝘢𝘵𝘪𝘰𝘯 𝘰𝘧 𝘵𝘩𝘦𝘮 — 𝘭𝘦𝘵 𝘱𝘳𝘪𝘤𝘦 𝘤𝘰𝘯𝘧𝘪𝘳𝘮 𝘥𝘪𝘳𝘦𝘤𝘵𝘪𝘰𝘯 𝘣𝘦𝘧𝘰𝘳𝘦 𝘤𝘰𝘮𝘮𝘪𝘵𝘵𝘪𝘯𝘨 𝘤𝘢𝘱𝘪𝘵𝘢𝘭, 𝘢𝘯𝘥 𝘢𝘭𝘸𝘢𝘺𝘴 𝘴𝘪𝘻𝘦 𝘱𝘰𝘴𝘪𝘵𝘪𝘰𝘯𝘴 𝘬𝘦𝘦𝘱𝘪𝘯𝘨 𝘰𝘱𝘵𝘪𝘰𝘯𝘴-𝘴𝘱𝘦𝘤𝘪𝘧𝘪𝘤 𝘳𝘪𝘴𝘬𝘴 (𝘵𝘩𝘦𝘵𝘢, 𝘐𝘝, 𝘭𝘪𝘲𝘶𝘪𝘥𝘪𝘵𝘺) 𝘪𝘯 𝘮𝘪𝘯𝘥.
━━━━━━━━━━━━━━━━━━━━━━━━
⚠️ 𝗗𝗜𝗦𝗖𝗟𝗔𝗜𝗠𝗘𝗥
𝘐 𝘢𝘮 𝘯𝘰𝘵 𝘢 𝘚𝘌𝘉𝘐 𝘳𝘦𝘨𝘪𝘴𝘵𝘦𝘳𝘦𝘥 𝘢𝘯𝘢𝘭𝘺𝘴𝘵. 𝘛𝘩𝘪𝘴 𝘱𝘰𝘴𝘵 𝘪𝘴 𝘱𝘶𝘳𝘦𝘭𝘺 𝘧𝘰𝘳 𝘦𝘥𝘶𝘤𝘢𝘵𝘪𝘰𝘯𝘢𝘭 𝘢𝘯𝘥 𝘪𝘯𝘧𝘰𝘳𝘮𝘢𝘵𝘪𝘰𝘯𝘢𝘭 𝘱𝘶𝘳𝘱𝘰𝘴𝘦𝘴, 𝘣𝘢𝘴𝘦𝘥 𝘰𝘯 𝘵𝘦𝘤𝘩𝘯𝘪𝘤𝘢𝘭 𝘤𝘩𝘢𝘳𝘵 𝘰𝘣𝘴𝘦𝘳𝘷𝘢𝘵𝘪𝘰𝘯𝘴, 𝘢𝘯𝘥 𝘴𝘩𝘰𝘶𝘭𝘥 𝘯𝘰𝘵 𝘣𝘦 𝘤𝘰𝘯𝘴𝘵𝘳𝘶𝘦𝘥 𝘢𝘴 𝘪𝘯𝘷𝘦𝘴𝘵𝘮𝘦𝘯𝘵/𝘵𝘳𝘢𝘥𝘪𝘯𝘨 𝘢𝘥𝘷𝘪𝘤𝘦 𝘰𝘳 𝘢 𝘣𝘶𝘺/𝘴𝘦𝘭𝘭 𝘳𝘦𝘤𝘰𝘮𝘮𝘦𝘯𝘥𝘢𝘵𝘪𝘰𝘯. 𝘗𝘭𝘦𝘢𝘴𝘦 𝘤𝘰𝘯𝘴𝘶𝘭𝘵 𝘢 𝘳𝘦𝘨𝘪𝘴𝘵𝘦𝘳𝘦𝘥 𝘧𝘪𝘯𝘢𝘯𝘤𝘪𝘢𝘭 𝘢𝘥𝘷𝘪𝘴𝘰𝘳 𝘢𝘯𝘥 𝘥𝘰 𝘺𝘰𝘶𝘳 𝘰𝘸𝘯 𝘥𝘶𝘦 𝘥𝘪𝘭𝘪𝘨𝘦𝘯𝘤𝘦 𝘣𝘦𝘧𝘰𝘳𝘦 𝘮𝘢𝘬𝘪𝘯𝘨 𝘢𝘯𝘺 𝘵𝘳𝘢𝘥𝘪𝘯𝘨 𝘰𝘳 𝘪𝘯𝘷𝘦𝘴𝘵𝘮𝘦𝘯𝘵 𝘥𝘦𝘤𝘪𝘴𝘪𝘰𝘯𝘴. 𝘛𝘳𝘢𝘥𝘪𝘯𝘨 𝘪𝘯 𝘦𝘲𝘶𝘪𝘵𝘺, 𝘧𝘶𝘵𝘶𝘳𝘦𝘴, 𝘢𝘯𝘥 𝘰𝘱𝘵𝘪𝘰𝘯𝘴 𝘪𝘯𝘷𝘰𝘭𝘷𝘦𝘴 𝘴𝘶𝘣𝘴𝘵𝘢𝘯𝘵𝘪𝘢𝘭 𝘳𝘪𝘴𝘬 𝘰𝘧 𝘭𝘰𝘴𝘴.
#Nifty50 #NiftyTrading #StockMarket #OptionsTrading #TradingView
 Long
Long
Short 
Beautiful Converging Triangle | HDFCAMC | Elliott Wave Analysis🌊 Super Beautiful Converging Triangle | HDFCAMC | Elliott Wave Analysis
A textbook Converging Triangle (ABCDE) appears to be developing in HDFCAMC. The structure is clean, respects both trendlines, and is unfolding exactly as an Elliott Wave triangle should.
As drawn, the market has already completed Wave A, B, C and D, while Wave E is expected to complete near the lower rising trendline before the next impulsive move begins.
Chart Breakdown:-
🔹 Wave A formed the first decline and established the lower boundary of the triangle.
🔹 Wave B rallied back to the upper trendline but failed to make a new trend high, respecting the contracting resistance.
🔹 Wave C declined again while remaining above the origin of Wave A, maintaining the converging structure.
🔹 Wave D once again tested the upper boundary and respected the falling resistance trendline.
🔹 Wave E is projected to finish near the rising support trendline around the marked demand zone. In Elliott Wave, the final leg of a triangle often ends with reduced momentum before the breakout.
What Happens Next?
If Wave E completes as projected, the triangle should finish and a strong bullish breakout may begin.
The blue projection illustrates the expected sequence:
Complete Wave E.
Break above the triangle resistance.
Cross the confirmation level near ₹2,838.4.
Continue higher as buying momentum expands after the triangle resolves.
Triangles usually represent continuation patterns, meaning the breakout often resumes the direction of the larger trend once the correction is complete.
Key Levels:-
✅ Confirmation: Sustained breakout above ₹2,838.4 strengthens the bullish scenario.
❌ Invalidation: A decisive breakdown below ₹2,380.8 invalidates this triangle count and requires a fresh wave interpretation.
As always, Elliott Wave is a probability-based framework. The market confirms the count—not our expectations.
***************************************************************************************
What do you think? Is HDFCAMC preparing for a classic post-triangle rally? 🌊
*****************************************************************************************
📌Disclaimer:
This analysis is shared purely for educational purposes and reflects my personal Elliott Wave interpretation. It is not financial or investment advice. Elliott Wave analysis is probabilistic in nature and multiple valid wave counts can exist simultaneously. Always wait for confirmation, manage your risk properly, and do your own research before taking any trade.
*****************************************************************************************
#HDFCAMC #ElliottWave #ConvergingTriangle #TrianglePattern #ABCDE #WaveAnalysis #TechnicalAnalysis #PriceAction #ChartAnalysis #MarketStructure #TradingView #StockMarket #NSE #SwingTrading #PositionTrading #TradingEducation #Investing #ChartPatterns #BreakoutTrading #TrendContinuation #ElliottWaveTheory #CorrectiveWave #WavePatterns #IndianStockMarket #NikhilKanal  Long
Long
Long 
Copper (W): Multiple 1-2 Bullish Setup Suggests Higher PriceCopper continues to respect a bullish Elliott Wave structure on the weekly timeframe.
My preferred count indicates that the market has already completed a series of Wave (1)-(2) formations. These repeated 1-2 structures are often seen before a strong impulsive advance, as they represent the market building energy before the larger Wave 3 unfolds.
### Wave Count
* The 2020 low marked the beginning of a new bullish cycle.
* Wave (1) completed in early 2021, followed by a corrective Wave (2).
* From the 2024 low, another smaller degree Wave 1 and Wave 2 have completed.
* Price has once again formed an additional 1-2 sequence , keeping the bullish structure intact.
This creates multiple nested 1-2 counts , which is one of the strongest Elliott Wave setups when confirmed by price.
### Current View
Price is currently consolidating inside the highlighted box after a strong advance.
At this stage, I consider this consolidation to be a Wave 2 correction , not a trend reversal.
As long as price remains above the recent swing low, the bullish count remains valid.
### What I'm Expecting
If this count is correct, Copper should soon begin the next impulsive advance.
A sustained breakout above the current consolidation range would increase confidence that Wave 3 of a higher degree is underway.
Wave 3 is typically the strongest and longest impulse in an Elliott Wave sequence, making this an important area to monitor.
### Invalidation
A decisive break below the current Wave 2 low would invalidate this preferred count and require a reassessment of the larger structure.
**This is my preferred Elliott Wave count based on current price action. As always, markets evolve and wave counts should adapt accordingly.**
---
**#Copper #XCUUSD #ElliottWave #TechnicalAnalysis #Commodities #TradingView #WaveAnalysis #PriceAction #Bullish #MarketStructure**
 Long
Long
Mazagon Dock – BuyClassic Elliott Wave Setups #1 : Mazagon Dock – WXY Correction Followed by a First Wave Extension, completion of zigzag - Buy
Mazagon Dock completed Primary Wave 1 on 19 May 2025, after an advance lasting nearly 1,680 days. The stock then underwent a Primary Wave 2 correction, which lasted about 316 days and retraced approximately 45% from the peak. The correction unfolded as a WXY structure, with Wave W forming a Flat correction and Wave Y developing as a Zigzag . This is a good example of how complex corrective structures can unfold following the completion of a larger-degree impulse.
The Current Setup
Following the completion of Primary Wave 2 on 30 March 2026, the stock has started forming a new impulse wave. Interestingly, the first impulse itself appears to be a First Wave Extension (W1 Extension) — a relatively uncommon but well-recognized Elliott Wave pattern.
As discussed in my educational post on First Wave Extensions (30 July), when Wave 1 extends, the remaining actionary waves often complete within 78.6% of the length of Wave 1. The current structure is closely following this guideline.
Despite the impulse itself being relatively compact, the subsequent correction has been quite elaborate, reflecting the caution and risk aversion that often follow the completion of a larger-degree correction.
The recent decline also appears to have completed Wave (v) of Wave C on 30 July 2026, with Wave (v) terminating near 50% of the length of Waves (i)–(iii)—another Fibonacci relationship frequently observed in Elliott Wave analysis.
A fresh long position may be considered only above 2403, to avoid possible formation of a flat correction, if any.
Stop Loss: Below 2243 (61.8% Trend-Based Fibonacci Extension support)
 Long
Long
Short 
 Long
Long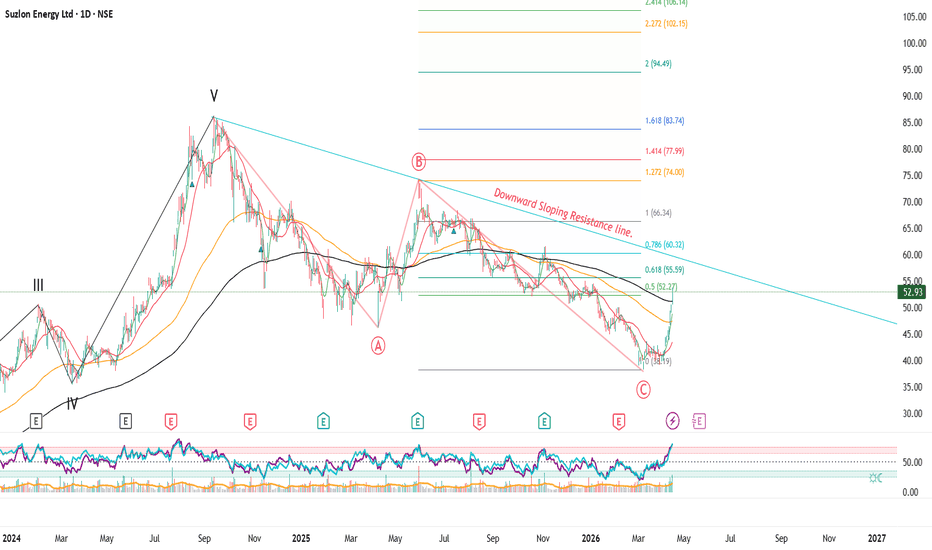
 Education

Technical AnalysisCore of Technical Analysis
Technical Analysis is the study of past price movements, volume, and market trends to predict future price direction.
3 Main Principles:
Market Discounts Everything
All news, emotions, and fundamentals are already reflected in price.
Prices Move in Trends
Markets usually move in uptrend, downtrend, or sideways trends.
History Repeats Itself
Human psychology creates repeating chart patterns.
Key Tools:
Charts (Candlestick, Line, Bar)
Support & Resistance
Trendlines
Indicators (RSI, MACD, Moving Averages)
Volume Analysis  Education

 Education

XAUUSD: Weekly Elliott Wave might require another low.Gold is still trading under the larger downtrend structure, and the weekly chart has not confirmed a full bullish reversal yet. From Kelly’s view, the current market is moving sideways above key support, but as long as price remains below the descending trendline and the 4,201 resistance area, the bearish Elliott structure still needs attention.
The key idea is simple: gold may continue lower first to complete the final Elliott wave, then a larger ABC recovery may appear later if buyers defend the lower Fibonacci zone.
Market structure
The chart shows gold has been moving under a clear downtrend trendline after the previous major bullish cycle ended. Price is currently trading around 4,045, while the nearest key support zone is around 3,960.
This 3,960 area is important because it is the last visible support before the larger Elliott Wave End zone below. If gold loses this support with strong pressure, price may continue towards the Fibonacci 2.618 target area around 3,730–3,780.
The main resistance above remains 4,201. Gold needs to break above this zone and the downtrend trendline before the weekly bullish recovery becomes more reliable.
Key levels
4,045: current price reaction area
3,960: key support zone and weekly decision level
3,730–3,780: Elliott Wave End / Fibonacci 2.618 target zone
4,100–4,150: short-term rebound resistance
4,201: main resistance and bullish confirmation area
Above 4,201: area where the bearish weekly structure weakens
Elliott Wave view
From an Elliott Wave perspective, gold still appears to be developing the final stage of a larger bearish 5-wave cycle.
Wave 1 started after the major top formed.
Wave 2 created a strong corrective recovery but failed below the downtrend structure.
Wave 3 delivered the main bearish expansion.
Wave 4 has developed as a sideways consolidation near the current area.
Wave 5 may still need one more downside move towards the 3,730–3,780 Fibonacci zone before the structure becomes complete.
If wave 5 ends near the lower Fibonacci target, Kelly will watch for an ABC recovery. That would mean gold first forms wave A upward, then wave B pullback, and finally wave C recovery towards the 4,100–4,201 resistance area.
Trading scenario
Preferred scenario: wait for gold to react below resistance and confirm whether sellers still control the weekly structure.
Sell zone: 4,080–4,150 if bearish rejection appears
Stop loss: above the confirmed rejection high or above 4,201
Take profit 1: 3,960
Take profit 2: 3,850
Take profit 3: 3,730–3,780
Alternative scenario: if gold breaks above 4,201 and holds above the downtrend trendline, the bearish Elliott wave setup weakens. In that case, price may start an earlier ABC recovery before reaching the lower Fibonacci target.
Kelly’s view
For Kelly, the weekly structure is still cautious. Gold is holding above support, but it has not broken the main downtrend line yet.
The cleaner plan is to watch whether 3,960 holds or breaks. If this support fails, the final Elliott wave may continue towards the Fibonacci 2.618 zone. If buyers defend the lower area, gold may prepare for a larger ABC recovery.
Gold is still below the main trendline.
One more bearish wave may complete the Elliott structure before a stronger recovery appears.
Share your view below. Short