Long
Long
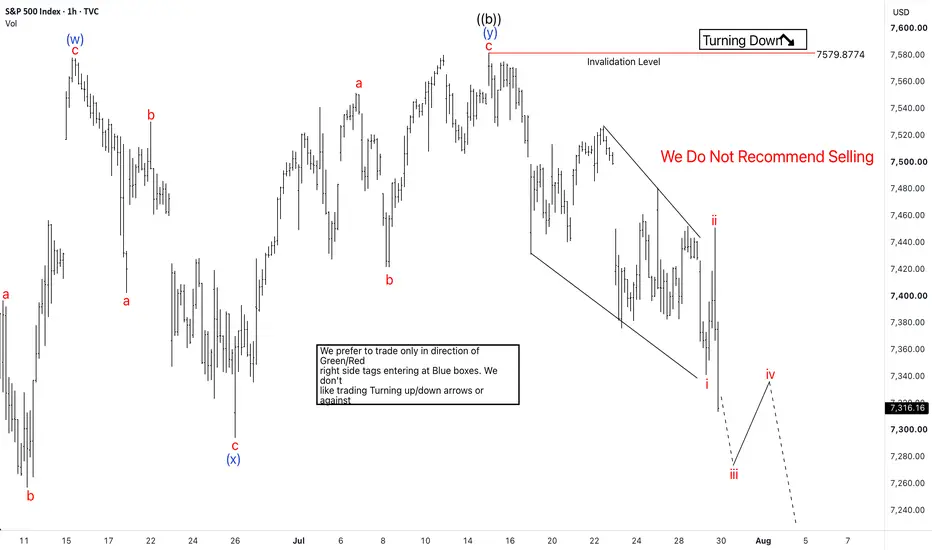
SPX Pullback Targets 7193–6953 Before Another BounceThe S&P 500 (SPX) is currently correcting the strong advance from the 6317 low to the 7620 peak in wave 2. Based on the current Elliott Wave structure, the index appears to be forming a flat correction. Sub-waves ((a)) and ((b)) look complete, and SPX is now progressing lower in the final five-wave decline of wave ((c)). We expect wave ((c)) to extend toward the 7193–6953 area. This zone represents the 100%–161.8% Fibonacci extension of wave ((a)) and could provide an area for the correction to find support and trigger another bounce.
The structure still allows for the possibility of a deeper decline. However, as long as SPX remains above the 6317 low, we expect the pullback to eventually find support. The correction could complete in 3, 7, or 11 swings, depending on how the structure develops.
In the short term, the index remains vulnerable to further downside. Over the next 24 hours, we expect SPX to continue lower while staying below the 7579 invalidation level. The decline may include short-term corrective bounces along the way as wave ((c)) unfolds.
Once the correction completes, the broader bullish structure can resume, provided SPX holds above 6317. Therefore, the 7193–6953 region remains an important area to monitor for signs of support and a potential turn higher.  Long
Long
NIFTY INTRADAY ANALYSIS & TRADING PLAN: 30-JULY-2026Greetings Traders! The market is currently at a crucial junction. After a strong recovery from the 23,700 levels, Nifty is consolidating near the 24,242 mark. Let’s break down the levels and price action psychology for tomorrow's session.
📊 Market Context & Overall Trend
🟢 Primary Trend: Short-term Bullish (Recovery Phase).
🟠 Immediate Sentiment: Neutral to Sideways (Consolidating near 24,200-24,250).
🔴 Major Resistance: 24,462.
The chart shows a series of higher highs and higher lows on the 15-minute timeframe, but we are approaching a heavy "Supply Zone" (24,327 - 24,371).
🔑 Key Levels to Watch
🔹 Last Intraday Resistance: 24,462 (The ultimate target for bulls).
🔹 Supply/Resistance Zone: 24,327 — 24,371 (Red Box - Watch for rejection or breakout).
🔹 No Trade / Sideways Zone: 24,213 (Orange Line - Pivot point).
🔹 Immediate Support: 24,169 (Green Line).
🔹 Major Panic Support: 23,927 (Last line of defense for bulls).
📈 Execution Plan for All Opening Scenarios
1️⃣ Flat Opening (Within 24,213 — 24,280)
🔸 If Nifty opens flat, wait for it to cross 24,255.
🔸 Long (Bullish): Buy above 24,255 for a target of 24,327.
🔸 Short (Bearish): If price breaks and sustains below the Orange Line (24,213), we might see a quick dip to 24,169.
🔸 Logic: The orange line represents the immediate equilibrium. Trading inside this range is risky due to premium decay (Theta).
2️⃣ Gap Up Opening (>100 Points | Above 24,350)
🔸 If Nifty opens directly inside or above the Red Box (24,327 - 24,371), DO NOT chase the trade.
🔸 Bullish Continuation: Wait for a 15-min candle to close above 24,371. Target: 24,462.
🔸 Mean Reversion: If price forms a 'Shooting Star' or 'Bearish Engulfing' at 24,371, expect a "Gap Fill" back to 24,250.
🔸 Logic: Large gaps often lead to profit booking. Let the initial volatility settle for 30 minutes.
3️⃣ Gap Down Opening (>100 Points | Below 24,140)
🔸 If Nifty opens below the Green Line (24,169), the sentiment shifts to bearish.
🔸 Bearish View: Look for a "Sell on Rise" opportunity near 24,169. If it fails to reclaim this level, the dashed red line path activates toward 23,927.
🔸 Recovery: Only if 24,213 is reclaimed can we think about longs again.
🔸 Logic: Opening below the last intraday support indicates that the previous day's buyers are trapped.
🛡️ Risk Management Tips for Option Traders
📍 Position Sizing: Since we are near all-time high territories and supply zones, trade with 50% of your usual quantity.
📍 Stop Loss (SL): Never trade without a system SL. For Nifty Options, an 8-10 point SL on the index is usually ideal for scalping, and 25-30 points for trend following.
📍 Expiry Awareness: Being close to expiry, Theta decay will be aggressive. Avoid "Out of the Money" (OTM) strikes; stick to "At the Money" (ATM) or "In the Money" (ITM).
📍 The 3-Trade Rule: If you hit two consecutive stop losses, close the terminal for the day. Protecting capital is more important than "revenge trading."
📝 Summary & Conclusion
The market is at a "Make or Break" level. The 24,213 (Orange) level is our pivot.
• Above 24,371, the bulls are in full control 🚀.
• Below 24,169, the bears will start growling 📉.
• Inside 24,213 - 24,327, expect "choppy" sideways movement (Scalpers only).
Patience is a virtue in trading. Let the price come to your levels!
⚠️ Disclaimer: I am not a SEBI registered analyst. This post is strictly for educational purposes and reflects my personal charting perspective. Trading involves significant risk. Please consult your financial advisor before making any investment or trading decisions.
#Nifty50 #TradingPlan #IntradayTrading #TechnicalAnalysis #NiftyPrediction #StockMarketIndia  Long
Long
PCBL Chemical: Wave 5 of 5 of Major Wave 3 Appears UnderwayOverview
PCBL Chemical continues to display a strong long-term bullish structure on the monthly timeframe. The stock appears to be progressing through Wave 5 of (5) of Major Wave 3, following a well-defined impulsive advance within a rising channel.
The broader Elliott Wave structure remains intact, with successive higher highs and higher lows respecting the primary uptrend channel.
Elliott Wave Analysis
The chart suggests:
Major Wave 1 and Major Wave 2 have been completed.
Major Wave 3 is currently in progress.
Within Major Wave 3, sub-wave (5) appears active.
Inside sub-wave (5), Wave 5 seems to have recently started after the completion of Wave 4 consolidation.
The recent pullback toward the lower trendline and subsequent recovery supports the bullish interpretation that the corrective wave has likely ended.
Fibonacci Projection
Using Fibonacci extension measurements of the current impulse structure:
The 1.618 extension projects near ₹1,061.
This aligns closely with the psychological level of ₹1,000.
Confluence between Elliott Wave targets and Fibonacci extensions strengthens the probability of this zone acting as the next major objective.
Therefore, the ₹1,000–₹1,060 zone remains the preferred upside level for the completion of Wave 5 of (5) of Major Wave 3.
Technical Observations
✅ Long-term uptrend channel remains intact.
✅ Price continues to trade above the major rising support line.
✅ Monthly structure remains bullish despite short-term volatility.
✅ Higher timeframe momentum remains supportive of trend continuation.
⚠️ Some lower-timeframe RSI readings show overbought conditions, which may lead to interim pullbacks without necessarily damaging the primary bullish structure.
Alternate Scenario
A decisive breakdown below the Wave 4 support region and channel support would weaken the current count and increase the probability of a deeper corrective phase before the next impulsive leg emerges.
Until such a breakdown occurs, the bullish Elliott Wave count remains favored.
Bias: Bullish
Timeframe: Monthly

XAUUSD — 4,020 Held the Line XAUUSD — 4,020 Held the Line
Gold has been heavy around the Fed week narrative, but the chart is starting to whisper something different from the lower side of the range.
Price pulled back after failing to hold the higher order block area, then drifted into the rising support zone around 4,020 - 4,030. That area matters because it is where sellers expected continuation, but instead of breaking cleanly lower, gold started to react again. For newer traders, this is the kind of moment where the market can quietly change rhythm: price drops into discount, absorbs selling pressure, then begins to build a small recovery before the crowd fully trusts it.
That is why my main view is short-term bullish while gold holds above 4,020 and especially above 3,989.500. I am not calling this a full bullish trend yet, because the macro backdrop is still sensitive. Oil is recovering, Middle East tension remains active, and Fed rate expectations can keep pressure on gold. But from the chart, the reaction near the rising support line tells me buyers are trying to defend the base.
If gold keeps holding this area, the first level I want to see reclaimed is 4,073.200. A clean push above that level would make the recovery look stronger and could open the path toward 4,094 - 4,110, where the short-term order block is waiting.
The real test is still higher, around 4,145 - 4,160. If price reaches that zone, I would watch carefully because sellers may try to defend it again.
This bullish recovery idea becomes weak if gold loses 4,020 and fails to recover. Below that, price may return toward 3,989.500 and possibly 3,959.800.
Key price zones to watch
Current reaction area: 4,030 - 4,045
Main demand / recovery base: 4,020 - 4,030
Bullish confirmation zone: clean reclaim above 4,073.200
First upside target: 4,094 - 4,110
Main upside order block target: 4,145 - 4,160
Lower support if buyers fail: 3,989.500
Major lower liquidity: 3,959.800
Invalidation: clean close below 4,020
Do you see this 4,020 reaction as buyers quietly stepping back in, or would you wait for 4,073 to break before trusting the recovery?
 Long
Long
XAUUSD: Bullish recovery in channel.Gold is showing a stronger recovery reaction after defending the lower support area inside the descending channel. From Kelly’s view, the market is still not fully bullish on the bigger structure, but the short-term Elliott wave is improving and may continue higher if buyers can hold the current support zone.
The key idea is simple: gold is recovering from support, but the next move needs confirmation above the resistance-buy zone.
⟡ Market structure
The chart shows gold has been trading inside a descending channel, with sellers controlling the broader direction. However, price reacted well from the strong support zone around 4,020–4,030, showing that buyers are trying to build a short-term recovery base.
Current price is reacting near 4,045–4,060, which is marked as the resistance-buy zone. This area is very important because if price holds above it, the zone may change from resistance into support.
If buyers defend this area, gold may continue towards the 4,090–4,100 zone, where the chart marks the possible Elliott completion area.
➤ Key levels
◌ 4,020–4,030: strong support and recovery base
◌ 4,045–4,060: resistance-buy zone and current reaction area
◌ 4,070: short-term upside checkpoint
◌ 4,090–4,100: Elliott completion / main target zone
◌ 4,150: higher extension area if momentum expands
◌ Below 4,020: area where the bullish recovery setup weakens
⌁ Elliott Wave view
From an Elliott Wave perspective, gold may be forming a short-term bullish 5-wave recovery after the previous bearish move slowed down near support.
Wave 1 started from the lower support base.
Wave 2 corrected but did not break the recent low.
Wave 3 is now pushing price back towards the upper part of the channel.
Wave 4 may appear as a small pullback around the 4,045–4,060 zone.
If this zone holds, wave 5 may continue towards 4,090–4,100.
This is why Kelly would not chase price blindly. The cleaner setup is to wait for the market to confirm that the current resistance-buy zone can hold as support.
▸ Trading scenario
Preferred scenario: wait for gold to hold above the 4,045–4,060 zone and show bullish confirmation.
Entry zone: 4,045–4,060 if bullish confirmation appears
Stop loss: below 4,020 or below the confirmed pullback low
Take profit 1: 4,070
Take profit 2: 4,090–4,100
Take profit 3: 4,150 if price breaks the channel with strength
Alternative scenario: if gold breaks below 4,020 with strong bearish pressure, the recovery setup weakens. In that case, price may return to the lower channel area before forming a new structure.
⌁ Kelly’s view
For Kelly, this is a bullish recovery setup inside a larger corrective channel. The short-term structure is improving, but buyers still need to prove strength above the current resistance-buy zone.
The best plan is to watch the reaction around 4,045–4,060. If this area holds, the next Elliott wave may continue towards 4,090–4,100.
Gold is recovering from support. If buyers defend the current zone, wave 5 may continue higher.
Share your view below. Long 
Long 
$JUP Still Bearish But 2200% Still Potential?LSE:JUP Is Still Bearish... But The Biggest Opportunity May Be Just Ahead ( 22x Upside Potential)
#JUP Remains Trapped Inside A 2-Year HTF Descending Channel After A -92% Macro Correction From Its Cycle High. While The Trend Is Still Bearish, The Projected Breakdown Zone Aligns With A High-Reward Long-Term Accumulation Area.
Technical Structure:
✅ -92% Macro Correction From ATH (~$2)
✅ HTF Descending Channel Still Intact (1W)
✅ Multiple Breakdown → Retest → Rejection Confirm Bearish Structure
✅ $0.28 = Major Resistance & Previous Support Flip
✅ Latest Retest Rejected, No CHoCH Or Market Structure Break
✅ High-Risk Accumulation Zone: $0.1–$0.07
✅ Resistance: $0.28 → $0.45 → $1 → $2
✅ Potential Upside From Accumulation Zone: 2,200%
Fundamental Edge:
✅ Solana's Leading DEX Aggregator
✅ Expanding Into Perps, Lend, Prediction Markets & Tokenized Assets
✅ Buybacks & Burns Through Litterbox Trust
✅ Net Token Emissions Effectively Reduced To Zero
Current Phase:
➡️ Jan 2024: ATH Near $2
➡️ 2024–2026: -92% Macro Correction
➡️ Current Price: ~$0.189 (Mid-Structure, No-Trade Zone)
➡️ Market Phase: Distribution → Compression → Decision
Scenario 1 → Relief Rally:
Holding $0.140 Could Trigger A Move Toward $0.28, But Strong HTF Resistance Is Expected There.
Scenario 2 → High-Reward Entry:
A Weekly Close Below $0.140 Could Push Price Into $0.10–$0.07, The Best Long-Term Risk/Reward Accumulation Zone.
Bullish Confirmation:
1️⃣ Weekly Close Above $0.28
2️⃣ Break Of Descending Channel
3️⃣ Acceptance Above $0.45
Bull Cycle Targets: $0.4500 → $1 → $2
CryptoPatel View:
Price Remains Bearish, But Fundamentals Continue To Strengthen.
Until $0.28 Is Reclaimed, Every Rally Should Be Viewed As A Relief Bounce. The $0.1–$0.07 Zone Remains The Highest Conviction Accumulation Area For Long-Term Investors.
TA Only. Not Financial Advice. ALWAYS DYOR.
 Long
Long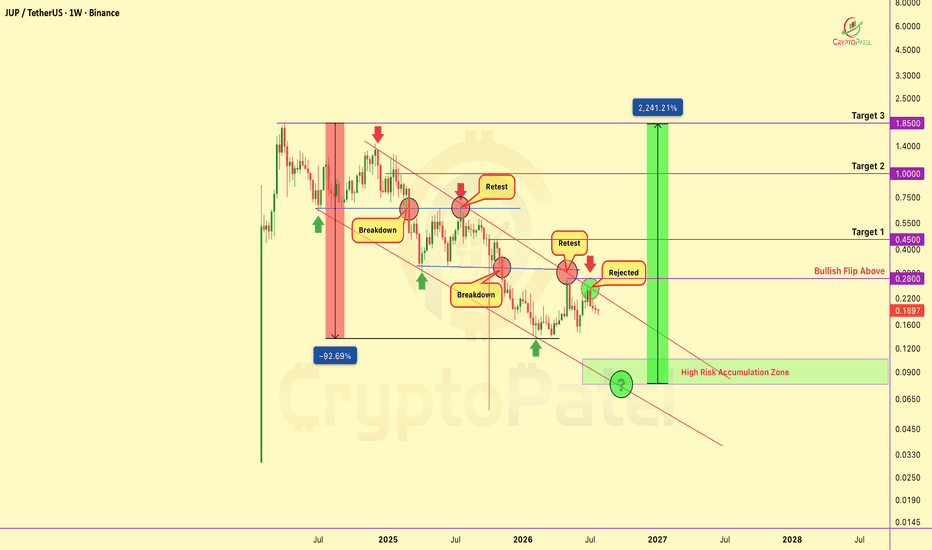
 Long
Long
𝗡𝗜𝗙𝗧𝗬 - 𝗜𝗡𝗧𝗥𝗔𝗗𝗔𝗬 𝗧𝗥𝗔𝗗𝗜𝗡𝗚 𝗣𝗟𝗔𝗡 | 𝟮𝗧𝗶𝗺𝗲𝗳𝗿𝗮𝗺𝗲: 15 Min | 𝗟𝗮𝘀𝘁 𝗖𝗹𝗼𝘀𝗲: 23,983.95 (+14.55 / +0.06%) | 𝗥𝗮𝗻𝗴𝗲: 23,968.70 - 24,013.35
━━━━━━━━━━━━━━━━━━━━━━━━
🔎 𝗞𝗘𝗬 𝗟𝗘𝗩𝗘𝗟𝗦 𝗧𝗢 𝗪𝗔𝗧𝗖𝗛
🔴 𝗟𝗮𝘀𝘁 𝗜𝗻𝘁𝗿𝗮𝗱𝗮𝘆 𝗥𝗲𝘀𝗶𝘀𝘁𝗮𝗻𝗰𝗲 — 𝟮𝟰,𝟮𝟬𝟯 (𝘔𝘢𝘫𝘰𝘳 𝘙𝘦𝘴𝘪𝘴𝘵𝘢𝘯𝘤𝘦)
🟠 𝗢𝗽𝗲𝗻𝗶𝗻𝗴 𝗭𝗼𝗻𝗲 (𝗨𝗽𝗽𝗲𝗿) — 𝟮𝟯,𝟵𝟰𝟵 - 𝟮𝟯,𝟵𝟴𝟳 (𝘚𝘪𝘵𝘴 𝘳𝘪𝘨𝘩𝘵 𝘢𝘵 𝘤𝘶𝘳𝘳𝘦𝘯𝘵 𝘱𝘳𝘪𝘤𝘦 - 𝘕𝘰 𝘛𝘳𝘢𝘥𝘦 𝘡𝘰𝘯𝘦)
⚪ 𝗥𝗲𝗳𝗲𝗿𝗲𝗻𝗰𝗲 𝗣𝗶𝘃𝗼𝘁 — 𝟮𝟯,𝟵𝟴𝟯.𝟵𝟱 (𝘓𝘢𝘴𝘵 𝘊𝘭𝘰𝘴𝘦)
🟢 𝗦𝗲𝗰𝗼𝗻𝗱𝗮𝗿𝘆 𝗦𝘂𝗽𝗽𝗼𝗿𝘁 𝗭𝗼𝗻𝗲 — 𝟮𝟯,𝟴𝟮𝟰 - 𝟮𝟯,𝟴𝟳𝟭 (𝘊𝘶𝘴𝘩𝘪𝘰𝘯 𝘣𝘦𝘭𝘰𝘸 𝘰𝘱𝘦𝘯𝘪𝘯𝘨 𝘻𝘰𝘯𝘦)
🟢 𝗟𝗮𝘀𝘁 𝗜𝗻𝘁𝗿𝗮𝗱𝗮𝘆 𝗦𝘂𝗽𝗽𝗼𝗿𝘁 — 𝟮𝟯,𝟲𝟵𝟵
📦 𝙊𝙥𝙚𝙣𝙞𝙣𝙜 𝙎𝙪𝙥𝙥𝙤𝙧𝙩 𝙕𝙤𝙣𝙚: 𝟮𝟯,𝟵𝟰𝟵 - 𝟮𝟯,𝟵𝟴𝟳 → the immediate "𝗡𝗼 𝗧𝗿𝗮𝗱𝗲 𝗭𝗼𝗻𝗲" right where price is trading now. A second cushion sits lower at 𝟮𝟯,𝟴𝟮𝟰 - 𝟮𝟯,𝟴𝟳𝟭 before the major floor at 𝟮𝟯,𝟲𝟵𝟵.
━━━━━━━━━━━━━━━━━━━━━━━━
🧭 𝗢𝗩𝗘𝗥𝗔𝗟𝗟 𝗧𝗥𝗘𝗡𝗗 𝗩𝗜𝗘𝗪
Nifty has been consolidating just under the 24,000 mark after its recent swing between 23,600 and 24,350, closing at 𝟮𝟯,𝟵𝟴𝟯.𝟵𝟱 — right inside the 𝟮𝟯,𝟵𝟰𝟵-𝟮𝟯,𝟵𝟴𝟳 𝗢𝗽𝗲𝗻𝗶𝗻𝗴 𝗭𝗼𝗻𝗲. Two layers of support sit stacked beneath this zone, giving the structure a step-wise look on the way down, while a single wall of resistance caps the upside.
📌 𝗕𝗶𝗮𝘀: Neutral 𝘪𝘯𝘴𝘪𝘥𝘦 the zone. A sustained break 𝗮𝗯𝗼𝘃𝗲 𝟮𝟯,𝟵𝟴𝟳 opens the path to 𝟮𝟰,𝟮𝟬𝟯 🟢 — with a 𝘥𝘢𝘴𝘩𝘦𝘥, 𝘶𝘯𝘤𝘰𝘯𝘧𝘪𝘳𝘮𝘦𝘥 extension possible beyond that if momentum carries through. A sustained break 𝗯𝗲𝗹𝗼𝘄 𝟮𝟯,𝟵𝟰𝟵 exposes 𝟮𝟯,𝟴𝟮𝟰-𝟮𝟯,𝟴𝟳𝟭 first, and then 𝟮𝟯,𝟲𝟵𝟵 🔴 if selling pressure continues.
━━━━━━━━━━━━━━━━━━━━━━━━
🎨 𝗨𝗡𝗗𝗘𝗥𝗦𝗧𝗔𝗡𝗗𝗜𝗡𝗚 𝗧𝗛𝗘 𝗖𝗛𝗔𝗥𝗧 𝗖𝗢𝗟𝗢𝗨𝗥 𝗖𝗢𝗗𝗘
🟢 𝗚𝗿𝗲𝗲𝗻 𝘇𝗶𝗴-𝘇𝗮𝗴 𝗹𝗶𝗻𝗲 → Bullish / Long bias path
🔴 𝗥𝗲𝗱 𝘇𝗶𝗴-𝘇𝗮𝗴 𝗹𝗶𝗻𝗲 → Bearish / Short bias path
🟠 𝗢𝗿𝗮𝗻𝗴𝗲 𝘇𝗶𝗴-𝘇𝗮𝗴 𝗹𝗶𝗻𝗲 → Sideways / 𝗡𝗼-𝗧𝗿𝗮𝗱𝗲 𝗭𝗼𝗻𝗲 — avoid directional bets here
〰️ 𝗗𝗮𝘀𝗵𝗲𝗱 𝗹𝗶𝗻𝗲 → Probable extension of trend — 𝘮𝘢𝘺 𝘰𝘳 𝘮𝘢𝘺 𝘯𝘰𝘵 𝘱𝘭𝘢𝘺 𝘰𝘶𝘵, treat as a roadmap, not a guarantee
━━━━━━━━━━━━━━━━━━━━━━━━
🌅 𝗦𝗖𝗘𝗡𝗔𝗥𝗜𝗢-𝗪𝗜𝗦𝗘 𝗣𝗟𝗔𝗡 (𝘎𝘢𝘱 𝘰𝘧 100+ 𝘱𝘰𝘪𝘯𝘵𝘴 𝘤𝘰𝘯𝘴𝘪𝘥𝘦𝘳𝘦𝘥 𝘢𝘴 𝘢 "𝘎𝘢𝘱")
𝟭️⃣ 𝗚𝗔𝗣-𝗨𝗣 𝗢𝗣𝗘𝗡𝗜𝗡𝗚 (𝘖𝘱𝘦𝘯 𝘢𝘣𝘰𝘷𝘦 ~24,084)
Holds above 𝟮𝟯,𝟵𝟴𝟳 on retest → follow the 🟢 green path. Long on shallow dips, targeting 𝟮𝟰,𝟮𝟬𝟯
Beyond 24,203, further upside is shown as a 𝘥𝘢𝘴𝘩𝘦𝘥 path — a possible extension only; don't assume it plays out, confirm with sustained trade above 24,203 first
Slips back 𝗶𝗻𝘀𝗶𝗱𝗲 𝟮𝟯,𝟵𝟰𝟵-𝟮𝟯,𝟵𝟴𝟳 within 15-30 min → exhaustion gap risk, don't chase, wait for stabilization
⚠️ 𝘈𝘷𝘰𝘪𝘥 𝘣𝘶𝘺𝘪𝘯𝘨 𝘯𝘢𝘬𝘦𝘥 𝘤𝘢𝘭𝘭𝘴 𝘳𝘪𝘨𝘩𝘵 𝘢𝘵 𝘵𝘩𝘦 𝘰𝘱𝘦𝘯 𝘰𝘯 𝘢 𝘨𝘢𝘱-𝘶𝘱 — 𝘱𝘳𝘦𝘮𝘪𝘶𝘮𝘴 𝘳𝘶𝘯 𝘩𝘰𝘵 𝘢𝘯𝘥 𝘤𝘢𝘯 𝘤𝘳𝘶𝘴𝘩 𝘧𝘢𝘴𝘵 𝘰𝘯𝘤𝘦 𝘵𝘩𝘦 𝘨𝘢𝘱 𝘨𝘦𝘵𝘴 𝘢𝘣𝘴𝘰𝘳𝘣𝘦𝘥
𝟮️⃣ 𝗙𝗟𝗔𝗧 𝗢𝗣𝗘𝗡𝗜𝗡𝗚 (𝘖𝘱𝘦𝘯 𝘸𝘪𝘵𝘩𝘪𝘯 ~23,884 - 24,084)
Inside 𝟮𝟯,𝟵𝟰𝟵-𝟮𝟯,𝟵𝟴𝟳 → 🟠 No-Trade Zone, expect chop. Wait for a clean break with volume rather than guessing direction
Sustained close above 𝟮𝟯,𝟵𝟴𝟳 → 🟢 target 𝟮𝟰,𝟮𝟬𝟯
Sustained close below 𝟮𝟯,𝟵𝟰𝟵 → 🔴 target 𝟮𝟯,𝟴𝟮𝟰-𝟮𝟯,𝟴𝟳𝟭 first, then 𝟮𝟯,𝟲𝟵𝟵 if the breakdown extends
⚠️ 𝘖𝘯 𝘧𝘭𝘢𝘵/𝘳𝘢𝘯𝘨𝘦 𝘥𝘢𝘺𝘴, 𝘰𝘱𝘵𝘪𝘰𝘯 𝘴𝘦𝘭𝘭𝘦𝘳𝘴 (𝘴𝘱𝘳𝘦𝘢𝘥𝘴 / 𝘐𝘳𝘰𝘯 𝘊𝘰𝘯𝘥𝘰𝘳𝘴) 𝘵𝘦𝘯𝘥 𝘵𝘰 𝘩𝘢𝘷𝘦 𝘢𝘯 𝘦𝘥𝘨𝘦 𝘰𝘷𝘦𝘳 𝘯𝘢𝘪𝘷𝘦 𝘰𝘱𝘵𝘪𝘰𝘯 𝘣𝘶𝘺𝘦𝘳𝘴, 𝘴𝘪𝘯𝘤𝘦 𝘵𝘩𝘦𝘵𝘢 𝘸𝘰𝘳𝘬𝘴 𝘢𝘨𝘢𝘪𝘯𝘴𝘵 𝘭𝘰𝘯𝘨 𝘱𝘳𝘦𝘮𝘪𝘶𝘮 𝘪𝘯 𝘢 𝘤𝘩𝘰𝘱𝘱𝘪𝘯𝘨 𝘮𝘢𝘳𝘬𝘦𝘵
𝟯️⃣ 𝗚𝗔𝗣-𝗗𝗢𝗪𝗡 𝗢𝗣𝗘𝗡𝗜𝗡𝗚 (𝘖𝘱𝘦𝘯 𝘣𝘦𝘭𝘰𝘸 ~23,884)
Opens near or below 𝟮𝟯,𝟴𝟮𝟰-𝟮𝟯,𝟴𝟳𝟭 → follow 🔴 red path, short pullbacks towards this zone, with 𝟮𝟯,𝟲𝟵𝟵 as the next target
At 𝟮𝟯,𝟲𝟵𝟵, watch for a 𝘥𝘢𝘴𝘩𝘦𝘥 reversal curl on the chart — a possible bounce, not a confirmed one; wait for a clear hold before considering long reversal trades
Quick reclaim back above 𝟮𝟯,𝟴𝟳𝟭 within the opening minutes → possible trap; wait for a hold before flipping bias
⚠️ 𝘋𝘰𝘯'𝘵 𝘴𝘩𝘰𝘳𝘵 𝘱𝘶𝘳𝘦𝘭𝘺 𝘰𝘧𝘧 𝘢 𝘸𝘦𝘢𝘬 𝘰𝘱𝘦𝘯𝘪𝘯𝘨 𝘤𝘢𝘯𝘥𝘭𝘦 — 𝘤𝘰𝘯𝘧𝘪𝘳𝘮 𝘸𝘪𝘵𝘩 𝘴𝘶𝘴𝘵𝘢𝘪𝘯𝘦𝘥 𝘵𝘳𝘢𝘥𝘦 𝘣𝘦𝘭𝘰𝘸 𝘴𝘶𝘱𝘱𝘰𝘳𝘵, 𝘯𝘰𝘵 𝘫𝘶𝘴𝘵 𝘵𝘩𝘦 𝘰𝘱𝘦𝘯𝘪𝘯𝘨 𝘵𝘪𝘤𝘬
━━━━━━━━━━━━━━━━━━━━━━━━
⚠️ 𝗥𝗜𝗦𝗞 𝗠𝗔𝗡𝗔𝗚𝗘𝗠𝗘𝗡𝗧 𝗧𝗜𝗣𝗦 𝗙𝗢𝗥 𝗢𝗣𝗧𝗜𝗢𝗡𝗦 𝗧𝗥𝗔𝗗𝗜𝗡𝗚
💰 𝗣𝗼𝘀𝗶𝘁𝗶𝗼𝗻 𝘀𝗶𝘇𝗶𝗻𝗴 𝗳𝗶𝗿𝘀𝘁 — risk only a small, predefined % of capital per trade
🛑 𝗦𝘁𝗼𝗽-𝗹𝗼𝘀𝘀 𝗶𝘀 𝗻𝗼𝗻-𝗻𝗲𝗴𝗼𝘁𝗶𝗮𝗯𝗹𝗲 — decide your SL before entering, not after watching the P&L
🎯 𝗕𝗼𝗼𝗸 𝗽𝗮𝗿𝘁𝗶𝗮𝗹 𝗽𝗿𝗼𝗳𝗶𝘁𝘀 at each level instead of holding for the "perfect" exit
⏳ 𝗥𝗲𝘀𝗽𝗲𝗰𝘁 𝘁𝗵𝗲𝘁𝗮 𝗱𝗲𝗰𝗮𝘆 — naked long options lose value fast in range-bound/no-trade zones; prefer spreads there
🚫 𝗡𝗲𝘃𝗲𝗿 𝗮𝘃𝗲𝗿𝗮𝗴𝗲 𝗹𝗼𝘀𝗶𝗻𝗴 𝗽𝗼𝘀𝗶𝘁𝗶𝗼𝗻𝘀 — adding to a losing option trade to "recover cost" is a fast way to blow up an account
📰 𝗧𝗿𝗮𝗰𝗸 𝗻𝗲𝘄𝘀/𝗲𝘃𝗲𝗻𝘁𝘀 — global cues and data releases can invalidate technical levels within seconds
🔁 𝗔𝘃𝗼𝗶𝗱 𝗼𝘃𝗲𝗿𝘁𝗿𝗮𝗱𝗶𝗻𝗴 — one clean setup with proper risk-reward beats five impulsive trades
🧊 𝗦𝘁𝗮𝘆 𝗲𝗺𝗼𝘁𝗶𝗼𝗻𝗮𝗹𝗹𝘆 𝗻𝗲𝘂𝘁𝗿𝗮𝗹 — dashed projections are possibilities, not certainties; trade what price confirms
━━━━━━━━━━━━━━━━━━━━━━━━
📝 𝗦𝗨𝗠𝗠𝗔𝗥𝗬 & 𝗖𝗢𝗡𝗖𝗟𝗨𝗦𝗜𝗢𝗡
Nifty closed at 𝟮𝟯,𝟵𝟴𝟯.𝟵𝟱, sitting right inside the 𝟮𝟯,𝟵𝟰𝟵-𝟮𝟯,𝟵𝟴𝟳 𝗡𝗼-𝗧𝗿𝗮𝗱𝗲 𝗭𝗼𝗻𝗲, with two layers of support stacked below and a single resistance wall above.
Gap-up + hold above 23,987 → target 𝟮𝟰,𝟮𝟬𝟯 🟢, with a dashed possibility beyond
Flat open inside 23,949-23,987 → 𝗽𝗮𝘁𝗶𝗲𝗻𝗰𝗲, not prediction 🟠
Gap-down + breakdown of 23,949 → target 𝟮𝟯,𝟴𝟮𝟰-𝟮𝟯,𝟴𝟳𝟭, then 𝟮𝟯,𝟲𝟵𝟵 🔴, with a dashed bounce zone at the floor
𝘛𝘳𝘢𝘥𝘦 𝘵𝘩𝘦 𝘳𝘦𝘢𝘤𝘵𝘪𝘰𝘯 𝘢𝘵 𝘵𝘩𝘦𝘴𝘦 𝘭𝘦𝘷𝘦𝘭𝘴, 𝘯𝘰𝘵 𝘵𝘩𝘦 𝘢𝘯𝘵𝘪𝘤𝘪𝘱𝘢𝘵𝘪𝘰𝘯 𝘰𝘧 𝘵𝘩𝘦𝘮 — 𝘭𝘦𝘵 𝘱𝘳𝘪𝘤𝘦 𝘤𝘰𝘯𝘧𝘪𝘳𝘮 𝘥𝘪𝘳𝘦𝘤𝘵𝘪𝘰𝘯 𝘣𝘦𝘧𝘰𝘳𝘦 𝘤𝘰𝘮𝘮𝘪𝘵𝘵𝘪𝘯𝘨 𝘤𝘢𝘱𝘪𝘵𝘢𝘭, 𝘢𝘯𝘥 𝘢𝘭𝘸𝘢𝘺𝘴 𝘴𝘪𝘻𝘦 𝘱𝘰𝘴𝘪𝘵𝘪𝘰𝘯𝘴 𝘬𝘦𝘦𝘱𝘪𝘯𝘨 𝘰𝘱𝘵𝘪𝘰𝘯𝘴-𝘴𝘱𝘦𝘤𝘪𝘧𝘪𝘤 𝘳𝘪𝘴𝘬𝘴 (𝘵𝘩𝘦𝘵𝘢, 𝘐𝘝, 𝘭𝘪𝘲𝘶𝘪𝘥𝘪𝘵𝘺) 𝘪𝘯 𝘮𝘪𝘯𝘥.
━━━━━━━━━━━━━━━━━━━━━━━━
⚠️ 𝗗𝗜𝗦𝗖𝗟𝗔𝗜𝗠𝗘𝗥
𝘐 𝘢𝘮 𝘯𝘰𝘵 𝘢 𝘚𝘌𝘉𝘐 𝘳𝘦𝘨𝘪𝘴𝘵𝘦𝘳𝘦𝘥 𝘢𝘯𝘢𝘭𝘺𝘴𝘵. 𝘛𝘩𝘪𝘴 𝘱𝘰𝘴𝘵 𝘪𝘴 𝘱𝘶𝘳𝘦𝘭𝘺 𝘧𝘰𝘳 𝘦𝘥𝘶𝘤𝘢𝘵𝘪𝘰𝘯𝘢𝘭 𝘢𝘯𝘥 𝘪𝘯𝘧𝘰𝘳𝘮𝘢𝘵𝘪𝘰𝘯𝘢𝘭 𝘱𝘶𝘳𝘱𝘰𝘴𝘦𝘴, 𝘣𝘢𝘴𝘦𝘥 𝘰𝘯 𝘵𝘦𝘤𝘩𝘯𝘪𝘤𝘢𝘭 𝘤𝘩𝘢𝘳𝘵 𝘰𝘣𝘴𝘦𝘳𝘷𝘢𝘵𝘪𝘰𝘯𝘴, 𝘢𝘯𝘥 𝘴𝘩𝘰𝘶𝘭𝘥 𝘯𝘰𝘵 𝘣𝘦 𝘤𝘰𝘯𝘴𝘵𝘳𝘶𝘦𝘥 𝘢𝘴 𝘪𝘯𝘷𝘦𝘴𝘵𝘮𝘦𝘯𝘵/𝘵𝘳𝘢𝘥𝘪𝘯𝘨 𝘢𝘥𝘷𝘪𝘤𝘦 𝘰𝘳 𝘢 𝘣𝘶𝘺/𝘴𝘦𝘭𝘭 𝘳𝘦𝘤𝘰𝘮𝘮𝘦𝘯𝘥𝘢𝘵𝘪𝘰𝘯. 𝘗𝘭𝘦𝘢𝘴𝘦 𝘤𝘰𝘯𝘴𝘶𝘭𝘵 𝘢 𝘳𝘦𝘨𝘪𝘴𝘵𝘦𝘳𝘦𝘥 𝘧𝘪𝘯𝘢𝘯𝘤𝘪𝘢𝘭 𝘢𝘥𝘷𝘪𝘴𝘰𝘳 𝘢𝘯𝘥 𝘥𝘰 𝘺𝘰𝘶𝘳 𝘰𝘸𝘯 𝘥𝘶𝘦 𝘥𝘪𝘭𝘪𝘨𝘦𝘯𝘤𝘦 𝘣𝘦𝘧𝘰𝘳𝘦 𝘮𝘢𝘬𝘪𝘯𝘨 𝘢𝘯𝘺 𝘵𝘳𝘢𝘥𝘪𝘯𝘨 𝘰𝘳 𝘪𝘯𝘷𝘦𝘴𝘵𝘮𝘦𝘯𝘵 𝘥𝘦𝘤𝘪𝘴𝘪𝘰𝘯𝘴. 𝘛𝘳𝘢𝘥𝘪𝘯𝘨 𝘪𝘯 𝘦𝘲𝘶𝘪𝘵𝘺, 𝘧𝘶𝘵𝘶𝘳𝘦𝘴, 𝘢𝘯𝘥 𝘰𝘱𝘵𝘪𝘰𝘯𝘴 𝘪𝘯𝘷𝘰𝘭𝘷𝘦𝘴 𝘴𝘶𝘣𝘴𝘵𝘢𝘯𝘵𝘪𝘢𝘭 𝘳𝘪𝘴𝘬 𝘰𝘧 𝘭𝘰𝘴𝘴.
#Nifty50 #NiftyTrading #StockMarket #OptionsTrading #TradingView Long 
Short 
 Long
Long
 Education

 Education

Understanding Market Expectations vs. RealityMarkets don't move based on what is happening today.
They move based on what people **expect to happen tomorrow**.
This is one of the most important ideas in trading, yet it is often misunderstood.
A company can announce strong earnings and still see its stock price fall.
A central bank can deliver exactly what investors expected, yet the market barely moves.
A cryptocurrency can receive positive news and suddenly sell off.
At first, these moves seem irrational.
But they become easier to understand when you realize that markets are constantly comparing two things:
Expectation vs. Reality.
And the bigger the gap between the two, the bigger the potential market reaction.
Price Moves on Expectations
Imagine a company is expected to report excellent earnings.
Investors become optimistic.
Traders buy the stock before the announcement.
The price rises in anticipation.
Then the company announces strong results—exactly as expected.
You might think the stock should rise even further.
Instead, it falls.
Why?
Because the good news was already priced in.
The market wasn't waiting to discover whether the company would perform well.
It was waiting to see whether the actual results would be **better or worse than expectations**.
When reality simply matches expectations, there may be no reason for new buyers to push price higher.
This is one of the reasons markets can behave in ways that seem completely opposite to the news.
The Market Is Always Looking Forward
Traders don't buy stocks because of what happened yesterday.
They buy because they believe something better may happen tomorrow.
The same principle applies to selling.
If investors expect a company to struggle in the future, they may begin selling long before the actual problems appear in financial reports.
This means price often moves before the news becomes obvious.
The market is constantly trying to anticipate the future.
By the time the news becomes public, the price may have already reacted.
Good News Can Be Bad News
This is one of the most confusing ideas for beginners.
Good news does not always mean higher prices.
Imagine a company announces a 20% increase in profits.
That sounds excellent.
But suppose analysts were expecting profits to increase by 30%.
The result is positive in absolute terms.
But it is disappointing compared with expectations.
The stock may fall.
The market isn't asking:
"Was the news good?"
It is asking:
"Was the news better or worse than what we expected?"
That difference can completely change the market reaction.
The Surprise Is What Moves Price
Markets tend to react most strongly when reality surprises expectations.
Consider three possible outcomes.
Reality Is Better Than Expected
If investors expect weak results but receive excellent results, buying pressure may increase.
The surprise is positive.
Price may rise sharply.
Reality Matches Expectations
If the outcome is exactly what everyone expected, the reaction may be limited.
Much of the information may already be reflected in price.
Reality Is Worse Than Expected
If investors expect strong results but receive disappointing news, selling pressure may increase.
The surprise is negative.
Price may fall quickly.
The key is not simply whether the news is good or bad.
It is the **difference between what people expected and what actually happened**.
Why Traders Get Confused
Retail traders often look at headlines and ask:
"Is this good news or bad news?"
Professional market participants often ask a different question:
"Was this better or worse than what the market had already priced in?"
That small difference in thinking can completely change how you interpret price movements.
A bullish headline doesn't guarantee a bullish market.
A bearish headline doesn't guarantee a sell-off.
The market reaction depends on expectations.
Expectations Can Become Extreme
Sometimes expectations become unrealistic.
During strong bull markets, investors may expect prices to continue rising forever.
Every positive announcement creates excitement.
Valuations become stretched.
Eventually, the market reaches a point where reality struggles to meet expectations.
Even good results may no longer be good enough.
This is often where trends begin to weaken.
The problem isn't necessarily that the company suddenly became bad.
The problem is that the market expected perfection.
And perfection is difficult to deliver consistently.
The Same Thing Happens During Fear
The opposite can happen during major market declines.
When fear dominates, investors may expect the worst.
They begin pricing in economic recessions, falling profits, or other negative scenarios.
Then reality turns out to be slightly better than expected.
The news may still be negative.
But if it is **less negative than the market feared**, prices can rally.
This is why markets sometimes rise during bad news.
The news isn't good.
It is simply better than expected.
Market Expectations and Economic Data
This concept is especially important when trading around major economic events.
Interest-rate decisions, inflation data, employment reports, and central bank announcements can all create significant volatility.
But traders are not simply reacting to the number itself.
They are comparing the actual result with the forecast.
For example, if inflation is expected to be 3.5% but comes in at 3.2%, the market may react positively.
But if traders were secretly expecting 3.0%, the same 3.2% result could disappoint.
The number hasn't changed.
The expectation has.
Why Price Sometimes Moves Before the News
Have you ever noticed a market moving strongly before an important announcement?
This can happen because traders are positioning themselves based on their expectations.
If enough participants believe a particular outcome is likely, they may begin buying or selling before the official announcement.
By the time the news arrives, much of the expected information may already be reflected in price.
This creates a classic market reaction:
"Buy the rumour, sell the news."
The market moves in anticipation, then reverses when reality fails to provide a fresh surprise.
The Importance of Reading Price, Not Just Headlines
News can tell you what happened.
Price can tell you how the market feels about what happened.
This is an important distinction.
If a company reports excellent earnings and the stock immediately falls, the price is telling you something.
Perhaps expectations were even higher.
Perhaps investors were already heavily positioned.
Perhaps the market was looking for something else.
Instead of arguing with the market, traders can learn from its reaction.
The response to the news is often more informative than the news itself.
Expectations Create Opportunities
Understanding expectations can help traders avoid emotional decisions.
Instead of immediately buying because of positive news, ask:
What did the market already expect?
Has the price already moved in anticipation?
Was the result better or worse than forecasts?
How is price reacting to the news?
Are traders buying the news or selling into it?
These questions provide context.
They help traders move beyond simple headlines and think about the bigger picture.
Final Thoughts
Markets are not machines that simply reward good news and punish bad news.
They are constantly comparing expectations with reality.
A positive outcome can lead to falling prices if it wasn't positive enough.
A negative outcome can lead to rising prices if it wasn't as bad as feared.
This is why understanding market psychology is so important.
The market doesn't care only about what happened.
It cares about what people expected to happen.
And when reality finally arrives, the difference between those two can create the biggest moves.
So the next time you see a market reacting in a way that doesn't make sense, don't immediately assume the market is irrational.
Ask yourself one simple question:
"What did everyone expect—and how different was reality?"
Very often, the answer is hidden in that gap.
XAUUSD – Gold Stays Under Pressure, Sellers Are Watching 4,067 XAUUSD – Gold Stays Under Pressure, Sellers Are Watching 4,067
Gold is moving lower for the second day in a row, and the chart is starting to look heavier again.
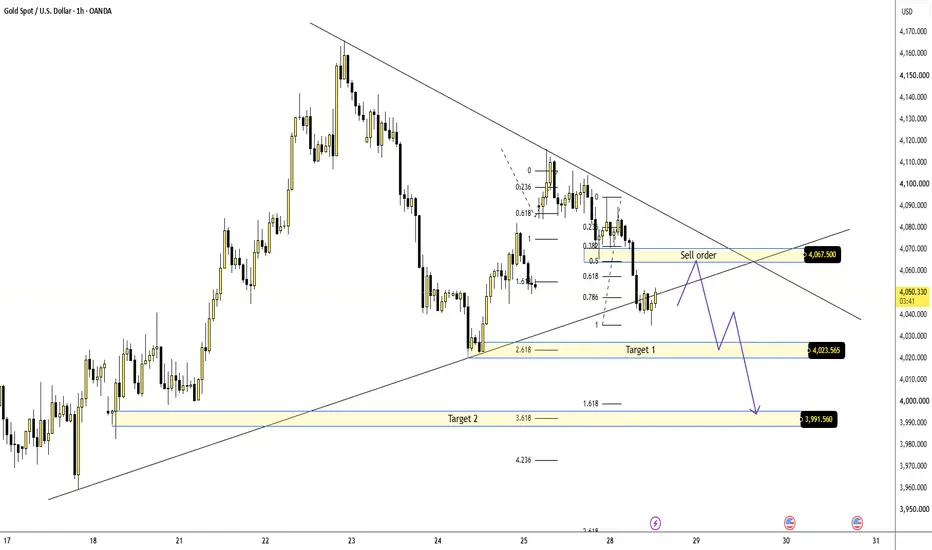
Price is currently trading around 4,049 after failing to hold above the previous short-term recovery structure. The market is now pressing below the broken trendline area, while the nearest sell order zone is sitting around 4,067.
This is an important level for today. If gold retests this zone and fails to reclaim it, sellers may continue pushing price toward the next downside targets.
FUNDAMENTAL ANALYSIS
Gold is under pressure as the U.S. dollar continues to recover and stays near its recent highs.
Market expectations around the Fed are also becoming more cautious. If traders continue to price in a higher chance of rate hikes, gold may struggle because higher rates increase the opportunity cost of holding non-yielding assets.
For now, the fundamental background supports a cautious view for gold, especially while price remains below key resistance.
TECHNICAL ANALYSIS – SMC + FIBONACCI
From an SMC perspective, gold has lost the short-term support structure and is now reacting below the sell order zone.
The 4,067 area is the key resistance to watch. This zone aligns with the previous reaction area and the broken structure. If price pulls back into this level and shows rejection, it may confirm that sellers are still defending the market.
Below current price, the first downside target is around 4,023. This area also aligns with the Fibonacci extension zone and may create a short-term reaction.
If 4,023 fails, the next important target is around 3,991, where stronger liquidity may attract price.
The chart is clear: gold needs to reclaim 4,067 to weaken the bearish pressure. Without that reclaim, the downside path remains open.
KEY PRICE ZONES
Current price: 4,049
Sell order zone: 4,067
Short-term resistance: 4,067 – 4,070
Target 1: 4,023
Target 2: 3,991
Bearish pressure remains: Below 4,067
Invalidation for sell view: Above 4,070
TRADING SCENARIOS
Sell Scenario – Priority View
Sell Zone: 4,067 – 4,070
Entry: Bearish rejection, failed reclaim, or lower-timeframe bearish CHoCH
SL: Above 4,070 or above the nearest swing high
TP1: 4,023
TP2: 3,991
Breakdown Sell
Condition: Clean break below 4,023
Entry: Retest and bearish confirmation
Target: 3,991
Buy Scenario – Only Short-Term Reaction
Buy is not the priority while gold remains below 4,067.
Buy Zone: Around 4,023 only if strong reaction appears
Entry: Liquidity sweep, bullish rejection, or lower-timeframe bullish CHoCH
TP1: 4,049
TP2: 4,067
Invalidation: If price breaks and holds below 4,023, the buy reaction becomes weaker.
MY VIEW
Gold is currently under bearish pressure.
The recovery from last week has weakened, and sellers are now trying to control price below the 4,067 sell order zone. I do not want to chase the move at the bottom, but I will watch carefully if gold retests 4,067.
If this zone rejects, the next downside path toward 4,023 and 3,991 remains valid.
For buyers, the first signal of strength would be a clean reclaim above 4,067. Until that happens, sellers still have the cleaner structure.
Do you think gold will reject from 4,067 and continue lower, or will buyers reclaim this level first?
Short 
XAUUSD: ABC Pullback Could Restart Wave 5Gold is correcting after a short-term bullish recovery, but the structure has not turned bearish yet. From Kelly’s view, the current pullback may simply be an ABC correction before price attempts another upside leg towards the wave 5 completion zone.
The key idea is simple: gold may need one more clean support reaction before the next bullish continuation becomes stronger.
⟡ Market structure
The chart shows gold rejected from the upper area after completing a short recovery sequence. Price then pulled back sharply and is now reacting around 4,049, close to the marked Buy zone ABC.
This area is important because it may become the base for the next bullish leg if buyers defend it. The market is currently sitting between support and short-term resistance, so confirmation is more important than chasing price.
The nearest reaction zone above is around 4,065–4,070, marked as the sell scalping area. If gold breaks through this zone and holds, the bullish recovery may continue towards 4,090–4,095, where the chart marks the End wave 5 area.
➤ Key levels
◌ 4,040–4,050: Buy zone ABC and current support area
◌ 4,049: current price reaction area
◌ 4,065–4,070: sell scalping / short-term resistance
◌ 4,090–4,095: End wave 5 target zone
◌ Below 4,035: area where the bullish correction setup weakens
◌ Above 4,070: stronger confirmation for bullish continuation
⌁ Elliott Wave view
From an Elliott Wave perspective, gold appears to be forming an ABC correction after the previous upside recovery.
Wave A created the first pullback from the short-term high.
Wave B reacted upward but failed to continue strongly.
Wave C is now testing the lower buy zone around 4,040–4,050.
If wave C ends in this zone and buyers create a confirmation candle, gold may begin the next bullish phase. That next move can develop as wave 5, with the first target around 4,065–4,070 and the main target near 4,090–4,095.
▸ Trading scenario
Preferred scenario: wait for gold to hold the Buy zone ABC and show bullish confirmation.
Entry zone: 4,040–4,050 if bullish confirmation appears
Stop loss: below the confirmed wave C low or below 4,035
Take profit 1: 4,065–4,070
Take profit 2: 4,090–4,095
Take profit 3: higher only if price breaks the wave 5 zone with strong momentum
Alternative scenario: if gold breaks below 4,035 with strong bearish pressure, the ABC bullish setup weakens. In that case, price may need to form a deeper support base before the next recovery becomes reliable.
⌁ Kelly’s view
For Kelly, this is a bullish correction setup, not a chase-buy setup. Gold is still holding near the ABC support zone, but buyers need to confirm that this area is protected.
The cleanest plan is to wait for a reaction around 4,040–4,050. If this zone holds, gold may continue the next wave higher towards 4,090–4,095.
Gold is correcting inside a bullish structure.
If the ABC buy zone holds, wave 5 may continue upward.
Share your view below. Long 
 Long
Long