Short
Short
BTC Wealth Update: Correction Deepens Toward $65k
Bias: Bear phase still intact, thesis on track. Key driver: the same oil-driven rate-hike repricing hitting gold and equities is now hitting crypto too.
The Setup
Quick update on the wealth thesis. Since the last note, price has broken below the 72.7k level and is now sitting around 65k, a roughly 49% drawdown from the October 2025 all-time high near 126k. That's already past the 45% mark referenced last time, and it lines up with the original read on this chart: 2025 was the blow off top, 2026 is the deep correction phase, and the 28k to 33.5k buy zone is still the target if this plays out like the last cycle did.
🔍 Technical Read
Structure: still inside the broader downtrend from the October 2025 peak, with price now testing levels not seen since well before that blow off top.
The chart's own projection: still shows room for one more relief bounce toward the mid 70s before the deeper leg down into the buy zone. Nothing in price action rules that out yet.
Shorter term structure is actually holding up a bit better than the weekly chart suggests, with some analysts flagging a sequence of higher lows around 62k, 62.7k, and 63.5k on lower timeframes. That's worth watching as a possible source of the bounce leg.
Where this thesis gets challenged: a clean reclaim and hold above the old 72.7k reference, let alone the 100k handle, would be the first real sign this correction is shallower than the cycle template suggests.
📰 Fundamental Backdrop
This is genuinely the same story hitting gold and oil in my other posts today. Higher oil prices and new tariff policy are pushing inflation expectations and Treasury yields higher, and that's pulling institutional money out of risk assets generally, crypto included.
Bitcoin spot ETFs posted 225 million dollars in net outflows on Thursday, snapping a weeklong stretch of roughly 999 million in net inflows. That flow reversal matters more than any single headline right now.
Bitcoin pays no yield, so every basis point added to rate hike odds ahead of the July 29 Fed decision raises its opportunity cost the same way it does for gold.
None of this changes the structural cycle thesis. If anything, a genuine macro driven flush toward the buy zone would be a cleaner setup than a slow bleed, since it would come with an actual capitulation event rather than just drifting lower on thin volume.
🎯 Levels That Matter
Cycle high, reference: 126,000 (Oct 2025 all time high)
Old reference from last update: 72,700
Current zone: 64,000 to 65,700
Possible bounce target: 74,000 to 75,000
Buy zone, thesis target: 28,000 to 33,500
🔀 Scenario Watch
Cycle thesis plays out, this is a normal deep correction: price grinds lower through the rest of 2026, possibly with one more bounce toward 74k to 75k along the way, before eventually reaching the 28k to 33.5k buy zone. This is the base case the whole chart is built around.
Shallower correction than the template, bullish surprise: macro conditions ease, the Fed pivots dovish after all, and ETF flows turn positive again. Price reclaims 72.7k and then 100k without ever tagging the buy zone. This would mean the 74% decline ratio simply doesn't repeat this cycle.
Faster, sharper capitulation, bearish acceleration: a genuine risk off shock, on top of what oil and rates are already doing, could compress months of grinding decline into a much faster move straight toward the buy zone. Historically these corrections often finish with a sharp final leg rather than a slow drift.
💭 My Take
Nothing about this move breaks the thesis, it actually confirms it. We're deeper into the correction than we were last update, and the macro backdrop driving it, higher oil, higher yields, less risk appetite, is exactly the kind of environment that eventually produces a real capitulation low. I'm not trying to catch this on the way down. The 28k to 33.5k zone is still where I'm planning to add, and I'd rather wait for price to get there than guess at the exact bottom along the way.
Not financial advice, just posted for discussion and education. This is a long term view and doesn't account for anyone's individual risk tolerance or time horizon, so size and plan accordingly.  Short
Short
NIFTY : Levels and Trade Plan for 27-07-2026Date: 27-Jul-2026 | Timeframe Reference: 15m (as per chart)
This plan is structured for all opening scenarios (Gap Up / Flat / Gap Down) using the key levels marked on the chart. The idea is simple: trade only when price confirms direction around important levels—avoid emotional entries inside the chop zone.
Chart Legend / How to Read My Levels 🎨
🔸 🟧 Orange line/zone = No Trade / Sideways / Chop (avoid overtrading here)
🔸 🟩 Green path = Bullish / Long-side scenario
🔸 🟥 Red path = Bearish / Short-side scenario
🔸 Dashed path = Trend may/may not extend (confirmation required)
Key Levels for 27-Jul-2026 (From Chart) 🎯
🔸 R2 (Major Resistance): 24,204 🟥
🔸 R1 (Last Intraday Resistance): 23,987 🟥
🔸 No-Trade / Opening Range Zone: 23,733 – 23,822 🟧
🔸 Pivot Reference (Spot): 23,787 (center of the zone / decision area)
🔸 S1 (Last Intraday Support): 23,651 🟩/🟥 (key breakdown/hold level)
Overall NIFTY Intraday Trend Bias 🧠
🔸 Above 23,822 → Bias turns Bullish ✅ (buy on dips / breakout-retest preferred)
🔸 Inside 23,733–23,822 → Sideways/Chop ⚠️ (wait for confirmation; reduce trades)
🔸 Below 23,733 → Bias turns Bearish ✅ (sell on rise / breakdown-retest preferred)
🔸 Big move day triggers: A sustained move beyond 23,987 (upside) or below 23,651 (downside)
Opening Scenarios (with Gap 100+ points considered)
1) GAP UP Opening (100+ points) 🚀
Meaning: Market opens strong, often due to global cues/news. Gap days can trend well—but can also do “gap-and-trap”. Let the first 5–15 min decide.
🔸 If price opens & sustains above 23,987 (R1): 🟩
🔸 Action: Long only after confirmation (5/15m close above + small retest).
🔸 Targets: 24,120 (psychological area) → 24,204 (R2) 🎯
🔸 Stop-loss idea (spot based): Below 23,987 (or last 15m swing low)
🔸 Educational note: When R1 becomes support, upside extension becomes more probable.
🔸 If gap up opens above 23,987 but fails to hold (rejection): 🟥
🔸 Action: Avoid instant shorts at open—wait for breakdown back below 23,987 and selling confirmation.
🔸 Down targets (mean reversion): 23,822 → 23,787 → 23,733
🔸 Educational note: This is the classic gap-fill attempt. Trade only after weakness is visible on candles/volume.
🔸 If gap up opens between 23,822 and 23,987: 🟧➡️🟩
🔸 Action: Treat as “semi-gap”. Wait for breakout either:
🔸 Break above 23,987 → long continuation
🔸 Slip back into 23,822–23,733 → no-trade zone (avoid churn)
2) FLAT / NORMAL Opening (within ±100 points) 😐
Meaning: Market is likely to respect the opening range and give cleaner breakouts later. Your job is to avoid trades inside the orange box.
🔸 If price opens inside 23,733–23,822 (🟧 No-Trade Zone):
🔸 Action: Wait for a clean breakout + retest.
🔸 Educational note: This zone is where both buyers & sellers get trapped; spreads/decay hurt option buyers here.
🔸 Bullish trigger: 15m close above 23,822 🟩
🔸 Action: Long on retest/hold of 23,822
🔸 Targets: 23,987 first 🎯
🔸 If 23,987 breaks and holds → extension attempt toward 24,204 (confirm with candles)
🔸 Bearish trigger: 15m close below 23,733 🟥
🔸 Action: Short on retest/failure near 23,733
🔸 Targets: 23,651 🎯
🔸 If 23,651 breaks → continuation possible (trail aggressively; next supports should be mapped from recent swing lows / round levels)
🔸 Middle pivot (23,787) usage:
🔸 If price keeps rotating around 23,787, it’s usually range day behavior → trade less, protect capital ✅
3) GAP DOWN Opening (100+ points) 🧨
Meaning: Market opens weak. Gap down days can either continue trending down or snap back hard (short covering). We will trade only after price confirms.
🔸 If price opens below 23,733 (bearish bias active): 🟥
🔸 Action: Wait for first 5–15 min. Prefer sell on rise toward 23,733 if it acts as resistance.
🔸 Targets: 23,651 🎯
🔸 Stop-loss idea: Above 23,733 (or above the rejection swing high)
🔸 If price opens near 23,651 (S1) and holds: 🟩 (possible rebound)
🔸 Action: Long only if price reclaims 23,733 and holds (breakout-retest).
🔸 Targets: 23,787 → 23,822
🔸 Educational note: A reclaim of 23,733 after a gap down often signals trap exit + recovery leg.
🔸 If price opens below 23,651 and keeps making lower highs: 🟥
🔸 Action: Trend continuation shorts are valid, but avoid late entries after big red candles.
🔸 Trade management: Use trailing stop above lower-high structure; book partials on sharp falls.
🔸 Educational note: Below 23,651, market is in “sell rallies” mode until it reclaims key levels.
Options Trading Risk Management Tips (Intraday) 🛡️💡
🔸 Use spot levels (NIFTY) for entries/exits—don’t trade only by option premium movement.
🔸 Risk a fixed % per trade (example: 0.5%–1% of capital). Avoid “YOLO” sizing.
🔸 Prefer ATM / Slight ITM options for directional trades (generally better liquidity & less decay shock).
🔸 Avoid buying options inside the 🟧 sideways zone (23,733–23,822)—theta decay + whipsaws can kill P&L.
🔸 On gap days, don’t jump in first candle. Wait 5–15 min for structure (ORB style).
🔸 Keep a hard stop (spot-based) + time stop (if trade doesn’t move within X candles, exit).
🔸 Book partial profits at first target and trail the rest (protecting capital > maximizing).
🔸 Don’t average losers in options—premium decay makes recovery harder.
🔸 If volatility is high, consider defined-risk spreads (debit spreads) instead of naked option buying.
Summary ✅
🔸 Bullish above 23,822, strongest momentum if 23,987 breaks & holds; next upside reference 24,204.
🔸 Sideways inside 23,733–23,822 (🟧): be selective, reduce trades, avoid option buying churn.
🔸 Bearish below 23,733, continuation risk increases if 23,651 breaks.
Conclusion 🧠
The entire plan is built around one rule: trade after confirmation at levels, not inside noise. Let price show direction, then execute with controlled risk and disciplined exits.
Disclaimer ⚠️
This post is for educational purposes only. I am not a SEBI registered analyst/advisor. Markets involve risk; please do your own research or consult a registered professional before trading.  Long
Long
XAUUSD — 4,100 May Be the Trap XAUUSD — 4,100 May Be the Trap
Gold gave us a full week of back-and-forth movement, but the story is starting to look clearer now: every strong bounce is still being tested by sellers before it can become a real recovery.
Earlier in the week, price reclaimed 4,054 and pushed higher, which gave buyers a short-term reason to believe the structure was changing. Then gold climbed into the 4,130 - 4,160 area, tapped close to the upper liquidity zone, and started losing strength again. That reaction matters because the recovery did not continue cleanly into the higher order block around 4,140 - 4,200. Instead, price slowed down, rejected, and came back toward the lower side of the current structure.
For newer traders, this is where the chart becomes important. A bounce after a strong drop can look bullish at first, but if price only rises into a premium area and then fails, that bounce may simply be the market giving sellers a better place to reload.
That is why my main view is still bearish while gold stays below the 4,100 - 4,140 area. Price is now sitting around the rising support line, so a small bounce toward 4,080 - 4,100 is possible. But unless buyers can break and hold above that zone, I would treat the bounce as a reaction, not a full reversal.
If sellers reject the next recovery, the lower order block around 3,950 - 3,995 becomes the first major downside area. If that zone fails, the next liquidity pool around 3,895.866 may start pulling price lower.
This bearish idea becomes weak only if gold reclaims 4,140 and holds above the upper order block. Until then, I see the market as still cleaning liquidity on the downside.
Key price zones to watch
Current reaction area: 4,040 - 4,070
Main supply / weekly trap zone: 4,080 - 4,100
Upper order block resistance: 4,140 - 4,200
Bearish confirmation zone: clean rejection below 4,100
First downside order block target: 3,950 - 3,995
Main downside liquidity target: 3,895.866
Lower support if selling continues: 3,880 - 3,900
Invalidation: clean reclaim and hold above 4,140
After this week’s rejection from the upper zone, do you see gold preparing for another downside leg, or does the rising support still give buyers one more chance?
 Short
Short
XAUUSD 4021 held — 4203 is the weekly draw XAUUSD 4021 held — 4203 is the weekly draw
That 4,021 hold is the whole weekly story now.
Gold spent the week playing dirty. First it trapped sellers under 4,000. Then it squeezed back into 4,058 - 4,078. Then boom, price ran higher, tagged the 4,160 area, and dumped right back into the POC around 4,021 - 4,036.
Classic liquidity game.
Late buyers got punished near the highs. Late sellers are now getting squeezed near value. Same movie, different side.
Main bias for this weekly plan is bullish recovery while 4,021 keeps holding.
Not calling it clean bullish trend yet. Bigger structure still has heavy supply above. But from where price is sitting now, shorting into the POC is late. The cleaner read is a bounce from 4,021 first, then a push into the Fibo zone around 4,085 - 4,105.
That zone decides the next move.
If gold reclaims 4,105 and holds, the road opens toward 4,170 - 4,203. That is the next big liquidity pocket. Above that, the premium sell zone around 4,350 - 4,380 is the higher weekly magnet, but I’d expect serious reaction there.
Trading scenario:
Buy idea only if gold holds above 4,021 - 4,036 and reclaims the 4,085 - 4,105 Fibo zone.
Entry zone: 4,021 - 4,055 after confirmation
Stop loss: below 3,970
TP1: 4,085 - 4,105
TP2: 4,170 - 4,203
TP3: 4,350 - 4,380
No reclaim above 4,105, no chase.
If gold closes hard below 3,970, this weekly bounce idea is cooked. Then sellers take back control and the whole recovery becomes just another trap.
For now, I’m reading this as POC hold first, Fibo reclaim second, 4,203 liquidity next.
You think gold runs 4,203 before the real sellers show up?
Long 
Short 
 Short
Short
Long 
OBEROIRLTY: Elliott Wave 5 Projection | Bullish SetupHello traders! Looking at the Daily (1D) chart for Oberoi Realty Limited (NSE: OBEROIRLTY), we can observe a clear Elliott Wave impulse cycle in progress.
Here is the breakdown of the current technical setup:
Waves 1, 2, and 3 Complete: The stock has mapped out a strong impulsive advance, with Wave 3 peaking near the significant 1,984 - 1,995 resistance zone.
Wave 4 Pullback: The stock is currently undergoing its Wave 4 corrective phase. It appears to be finding solid support near the 1,829 level, which aligns with previous structural zones.
Wave 5 Projection: If the support holds, we are anticipating the start of a bullish Wave 5. The primary target for this final impulse wave would be a breakout above the previous Wave 3 high, pushing past the 1,995 mark into new highs.
Key Levels to Watch:
Current Price: ~1,821
Immediate Support: 1,829 (Zone to watch for confirmation of Wave 4 completion)
Overhead Resistance / Target: 1,984 - 1,995
Trading Plan:
Keep an eye out for bullish reversal patterns (like a hammer or engulfing candle) around this current support zone to confirm the start of Wave 5. Ensure you manage your risk and place a stop-loss below the Wave 4 support to protect against an invalidation of the wave count.
Disclaimer: This is for educational purposes and is not financial advice. Always do your own research before executing a trade. Long 
 Long
Long
XAUUSD: Final Wave 5 may signal ABC recovery.Gold is still trading inside a larger bearish structure, with price staying below the major descending trendline. From Kelly’s view, the current weekly chart suggests that gold may still be moving inside wave 5, but the market is also approaching an important area where a corrective ABC recovery could form later.
The key idea is simple: gold may continue lower first, then prepare for an ABC rebound if wave 5 completes around the lower Fibonacci buy zone.
⟡ Market structure
The chart shows gold has been under pressure since the major high, with each recovery attempt forming lower highs under the downtrend trendline. The broader structure is still bearish because price has not broken back above the descending resistance.
Gold is currently trading around 4,052 after consolidating above the 3,963 support area. The nearest resistance is the 4,090–4,120 sell zone. If price fails to reclaim this area, sellers may continue to control the weekly structure.
The lower target area is around 3,720–3,760, where the chart marks the 2.618 Fibonacci extension and the possible end of wave 5. This is the zone Kelly will watch carefully for a potential exhaustion reaction.
➤ Key levels
◌ 3,963: current support and short-term reaction level
◌ 4,052: current price area
◌ 4,090–4,120: sell zone and weekly resistance
◌ 4,380–4,420: end wave C / higher recovery target
◌ 3,720–3,760: end wave 5 / Fibonacci 2.618 buy zone
◌ Above 4,420: area where the larger bearish structure weakens
⌁ Elliott Wave view
From an Elliott Wave perspective, gold appears to be developing the final part of a larger bearish 5-wave cycle.
Wave 1 started the first major drop from the upper zone.
Wave 2 corrected higher but failed below the downtrend line.
Wave 3 created the strongest decline.
Wave 4 formed a sideways recovery near the sell zone.
Wave 5 may now continue lower towards the 3,720–3,760 Fibonacci completion area.
If wave 5 completes around this zone and price creates a strong bullish reaction, gold may then begin an ABC recovery into late next week. In that case, wave A could rebound towards 4,090–4,120, wave B may retest support, and wave C could extend towards the higher 4,380–4,420 resistance zone.
▸ Trading scenario
Preferred scenario: wait for price to retest resistance and show bearish confirmation before expecting wave 5 continuation.
Sell zone: 4,090–4,120 if rejection appears
Stop loss: above the confirmed rejection high or above 4,150
Take profit 1: 3,963
Take profit 2: 3,850
Take profit 3: 3,720–3,760
Recovery scenario: if gold reaches 3,720–3,760 and forms bullish confirmation, Kelly will watch for an ABC rebound setup.
Buy zone: 3,720–3,760 only after clear bullish reaction
Stop loss: below the confirmed wave 5 low
Take profit 1: 3,963
Take profit 2: 4,090–4,120
Take profit 3: 4,380–4,420 if wave C expands
Alternative scenario: if gold breaks above 4,120 and holds strongly, the wave 5 bearish continuation may weaken. In that case, price could start the ABC recovery earlier than expected.
⌁ Kelly’s view
For Kelly, the weekly structure is still bearish while gold remains under the downtrend trendline and below the sell zone. However, the market is getting closer to a possible wave 5 exhaustion area.
The cleanest plan is to follow the bearish structure first, then watch for reaction at the Fibonacci completion zone.
Gold may still need one more downside leg.
If wave 5 completes near the lower buy zone, an ABC recovery could appear later next week.
Share your view below. Short 
Long 
 Long
Long
Long 
Long 
The Hidden Psychology of Support and ResistanceLook at almost any price chart and you will find them.
A level where price repeatedly stops falling.
Another area where rallies keep losing momentum.
Sometimes price breaks through these levels and continues moving. Other times, it breaks the level for a few moments and then quickly reverses.
Most traders know these areas as support and resistance.
But support and resistance are not really about lines on a chart.
They are about people.
Behind every important price level is a story of traders who bought, sold, took profits, got trapped, or are still waiting for another opportunity.
Once you understand the psychology behind these levels, charts can start to look very different.
Why Do Support and Resistance Exist?
Markets are driven by decisions.
Every trader has a reason for entering a position.
Some believe price will rise.
Others believe it will fall.
When enough traders make similar decisions around the same price, the market begins to react there.
This creates areas of support and resistance.
Support forms when buying interest becomes strong enough to slow or stop a decline.
Resistance forms when selling pressure becomes strong enough to slow or stop a rally.
The level itself has no power.
The people trading around it create the reaction.
The Psychology Behind Support
Imagine a stock falls from ₹500 to ₹400.
At ₹400, many traders believe the stock has become attractive.
Some begin buying.
Others who previously missed the move decide to enter.
Short sellers may start taking profits.
All of this creates additional demand.
Price begins to stabilize.
The market has found temporary support.
Now imagine price rallies to ₹450 before falling back to ₹400.
Traders who watched the previous bounce remember what happened.
They may think:
"If price reaches ₹400 again, I'll buy."
This creates the possibility of even more demand.
The more traders who remember the same level, the more important that area can become.
The Psychology Behind Resistance
Resistance works in the opposite way.
Imagine a stock previously rallied to ₹500 but then experienced a sharp decline.
Many traders who bought near ₹500 may still be holding losing positions.
When price eventually returns to ₹500, some of these traders may decide to exit at breakeven.
Other traders may see the previous rejection and begin selling.
Short sellers may also enter.
Suddenly, selling pressure increases.
Price struggles to move higher.
The previous high has become a psychological barrier.
Why Previous Highs and Lows Matter
Traders remember prices.
A previous high represents a place where buyers failed to push the market higher.
A previous low represents an area where sellers were unable to continue pushing price lower.
When price returns to these areas, traders remember what happened before.
This memory influences future decisions.
That is why previous highs and lows often become important reference points.
The market doesn't have a memory in the human sense.
But the participants do.
Support and Resistance Are Zones, Not Exact Lines
One of the biggest mistakes beginners make is treating support and resistance as perfectly precise lines.
Real markets rarely behave that way.
A support level at ₹100 doesn't mean price must reverse exactly at ₹100.00.
Price may briefly move to ₹99.50 or ₹98.80 before buyers step in.
The same applies to resistance.
This is why it is often better to think in terms of **zones** rather than exact prices.
The goal is not to predict the exact turning point.
The goal is to identify an area where the balance between buyers and sellers may change.
When Support Becomes Resistance
One of the most interesting psychological shifts occurs when support breaks.
Imagine hundreds of traders bought around ₹100.
Then price suddenly falls below ₹100.
Those traders are now holding losing positions.
If price later returns to ₹100, some may want to exit their trades and reduce their losses.
At the same time, new sellers may view ₹100 as an opportunity to enter short positions.
The result?
A level that previously attracted buyers may now attract sellers.
Old support can become new resistance.
This isn't magic.
It's a change in trader psychology.
Why Breakouts Can Be So Powerful
A breakout represents a shift in expectations.
When price breaks a major resistance level, traders who were waiting on the sidelines may finally enter.
Short sellers may be forced to close their positions.
Momentum traders may join the move.
The combination of new buying and short covering can create a powerful rally.
The opposite can happen when support breaks.
Long positions may be stopped out.
New short sellers may enter.
Selling pressure increases.
This is why important support and resistance levels can produce strong moves when they finally break.
The Psychology of Trapped Traders
Some of the strongest market moves happen when traders become trapped.
Imagine price breaks above resistance.
Traders buy the breakout expecting a rally.
But instead of continuing higher, price falls back below the level.
Suddenly, those breakout buyers are trapped in losing positions.
If price continues falling, they may rush to exit.
Their selling adds further downward pressure.
This can create a sharp reversal.
The same process works in reverse after a false breakdown.
Understanding trapped traders can help explain why markets sometimes move so quickly after failed breakouts.
Strong Levels Are Often Tested Multiple Times
A support or resistance zone that has been respected several times can become psychologically important.
But there is an interesting paradox.
The more often a level is tested, the more attention it receives.
More traders begin watching it.
More orders accumulate around it.
Eventually, the level may become vulnerable to a breakout.
This is why traders should never assume that a level will hold simply because it has worked several times before.
Markets constantly change.
The Hidden Story Behind Every Level
The most useful way to think about support and resistance is to ask:
Who is trapped here?
Who is waiting to enter?
Who is taking profits?
Where are stop losses likely to be placed?
These questions reveal the psychology behind the chart.
A support level isn't just a line where price bounced in the past.
It is an area where traders have memories, expectations, and positions.
And those decisions can influence what happens when price returns.
Final Thoughts
Support and resistance are among the oldest concepts in technical analysis.
Yet their real power comes from something much deeper than chart patterns.
They work because traders remember.
They work because traders react.
They work because fear, greed, hope, and regret influence decisions around important prices.
A level becomes significant when enough market participants believe it is significant.
That belief creates orders.
Those orders create reactions.
And those reactions create the patterns we see on our charts.
So the next time you draw a support or resistance line, don't just ask:
"Will price bounce here?"
Ask a better question:
"What are traders likely to think and do when price reaches this area?"
Because behind every support and resistance level, there is a psychological battle.
And understanding that battle may be far more valuable than the line itself.
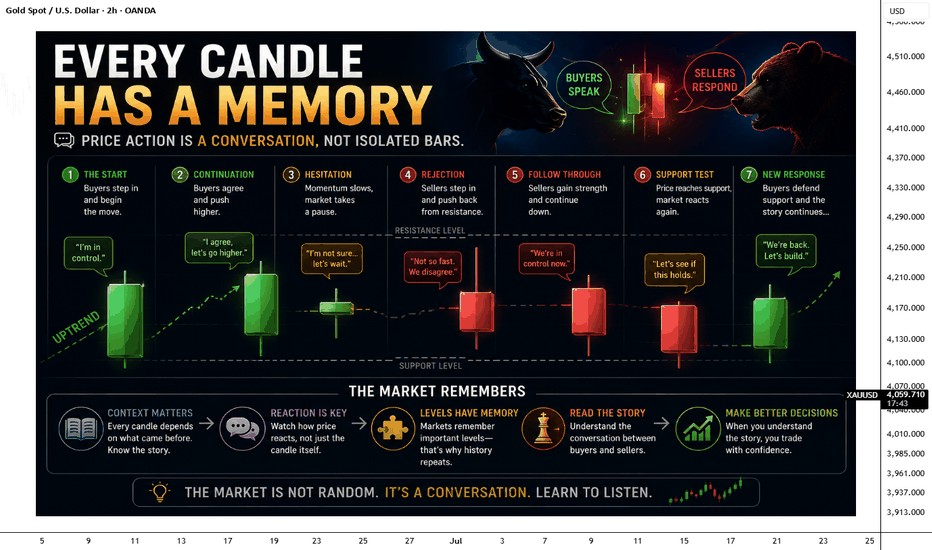
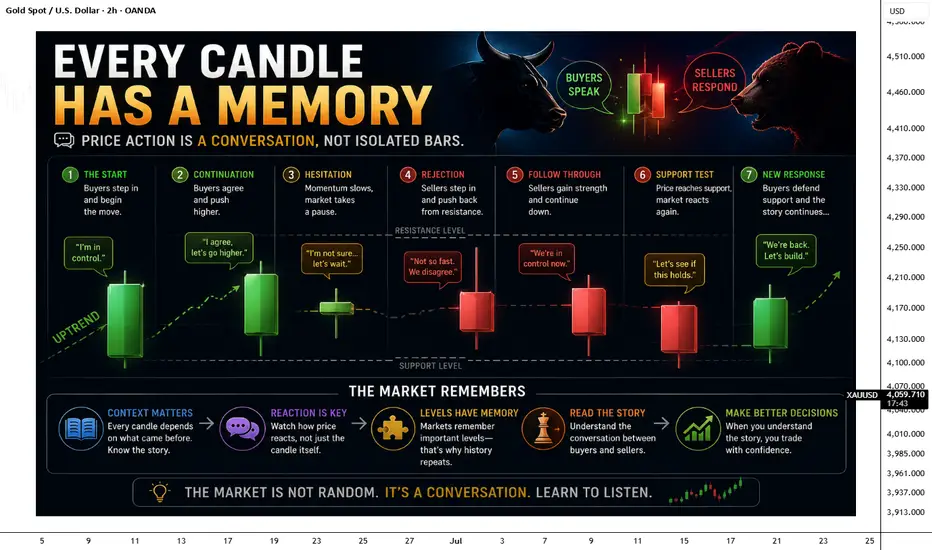
Every Candle Has a Memory!When beginners look at a chart, they often treat every candle as a separate event. A green candle means buyers are strong, and a red candle means sellers are in control. While this is partly true, it misses something much more important. **No candle is born in isolation. Every candle is influenced by the candles that came before it. Just like every sentence in a conversation depends on the previous one, every candle continues the story that the market has already been telling.
Imagine walking into a room where two people are arguing. If you hear only the last sentence, you will probably misunderstand the situation. But if you listen from the beginning, every word starts making sense. Price action works the same way. A single candle rarely tells the complete story. It only makes sense when viewed in the context of the candles surrounding it.
The First Candle Starts the Conversation
Every move in the market begins with a reason. It could be buyers becoming more aggressive, sellers taking profits, or important news changing market sentiment. The first candle simply starts the conversation. It asks a question, but it does not always provide the answer.
A large bullish candle, for example, shows that buyers were in control during that period. However, it does not tell us whether buyers will remain strong or whether sellers are waiting at the next resistance level. The next few candles will continue that story.
The Next Candle Responds:
Every new candle reacts to what happened before it.
Suppose a strong bullish candle appears. The following candle now has a decision to make. It can continue moving higher, showing that buyers still have confidence. It can become small, suggesting hesitation. Or it can reverse completely, showing that sellers have entered the market with greater strength.
The second candle is not creating a new story. It is responding to the previous one.
Trends Are Conversations:
A trend is not created by one candle. It is created by hundreds of candles agreeing with each other.
An uptrend is like a group of people repeating the same opinion. Buyers continue making higher highs and higher lows because each candle supports the previous one.
A downtrend works the same way. Every bearish candle reinforces the message that sellers remain in control.
The moment candles stop agreeing with each other, the conversation begins to change.
Rejection Is a Different Opinion:
Sometimes the market suddenly changes its tone.
Imagine a strong bullish candle reaching resistance, followed by a candle with a long upper wick. That wick tells us something important. Buyers tried to push price higher, but sellers refused to accept those prices and forced the market back down before the candle closed.
That single wick becomes a reply in the conversation. It tells us that someone disagreed with the previous move.
This is why experienced traders pay attention to how candles react to one another instead of memorizing individual candlestick patterns.
Memory Creates Context:
Markets remember important levels because traders remember them.
If price was rejected from a certain level yesterday, many traders will watch that same level today. If a breakout failed last week, traders will be cautious the next time price reaches that area.
Although candles do not literally have memory, the people trading the market do. Their decisions are influenced by what happened before, and those decisions shape the next candle.
This is why history often seems to repeat itself.
The Story Is More Important Than the Shape
Many beginners spend months memorizing candlestick patterns like Doji, Hammer, or Engulfing candles. While these patterns can be useful, they become much more meaningful when you understand the story behind them.
A bullish engulfing candle appearing after a long downtrend tells a completely different story than the same pattern appearing in the middle of a sideways market.
The shape of the candle matters, but its location and the conversation leading up to it matter even more.
My Thoughts:
Every candle is a response to what happened before it. Every trend is a conversation between buyers and sellers. Every wick represents an argument, every breakout is a statement, and every reversal is a change in opinion.
The next time you open a chart, don't look at candles as individual bars. Read them like sentences in a story. Because the market is not writing random candles.
By @BrightRally_Research on @TradingView Education