Trading Masterclass #1Institutional trading means trading like hedge funds, banks, prop firms, and professional desks. They do not trade based on emotions, random tips, or gambling. They use systems, probabilities, risk control, position sizing, discipline, and psychology.
Retail traders often lose because they focus only on “entry.” Institutions focus on:
Risk Management
Capital Protection
Position Sizing
Probability
Psychology
Consistency
Repeatable Edge  Education

Global Financial MarketsGlobal financial markets are systems where people, companies, and governments buy and sell financial assets across the world. They help move money from those who have extra funds to those who need funds.
Main Types of Global Financial Markets:
Stock Markets – Buying and selling shares of companies (e.g., NYSE, NSE).
Bond Markets – Governments and companies borrow money by issuing bonds.
Foreign Exchange (Forex) Markets – Trading currencies like USD, EUR, INR.
Commodity Markets – Trading gold, oil, wheat, etc.
Money Markets – Short-term borrowing and lending.
Derivatives Markets – Contracts based on assets like stocks or currencies.
Importance:
Provide funds for business growth
Support international trade
Create investment opportunities
Help manage financial risks
Affect global economies
Example:
If the US stock market falls sharply, markets in Asia and Europe may also be affected because markets are connected globally.  Education

 Education

 Long
Long
Reliance Industries – Elliott Wave Perspective (Daily)Reliance Industries continues to trade within its higher-degree Wave 3 (Cycle / Primary degree).
Intermediate degree Wave (3) of this larger degree Wave 3 was completed on 8 July 2024, followed by a corrective Wave (4) that ended on 7 April 2025. Since then, the stock has been unfolding a new impulsive structure, which now shows signs of completion.
There is a high probability that Wave 5 of this new impulse has ended, based on the following observations:
Wave 1 unfolded as a simple two-candle sequence, followed by Wave 2, which retraced approximately 35%.
Wave 3 was an extended five-wave structure and concluded on 9 July 2025, reaching 4.414× the length of Wave 1.
The subsequent Wave 4 formed a zigzag correction, retracing nearly 50% of Wave 3, and ended on 1 September 2025.
Wave 5 again unfolded as a five-wave structure and terminated on 5 January 2026, precisely near the 61.8% retracement of the entire Wave (1–3).
Notably, this impulse has peaked at levels similar to the 8 July 2024 high (Intermediate degree Wave 3). Additionally, the stock has now achieved roughly 2× the length of Intermediate Wave 1, further supporting the possibility of intermediate-degree Wave 3 exhaustion.
With the stock now undergoing a correction — the exact structure of which is yet to be identified — risk remains elevated. Also, stock has not met earnings estimates for last 2 quarters.
Conclusion:
Until the ongoing correction completes and a clearer structure emerges, it may be prudent to avoid initiating fresh positions. XAUUSD – Gold Pulls Back, But The Weekly Recovery Is Not Over XAUUSD – Gold Pulls Back, But The Weekly Recovery Is Not Over Yet
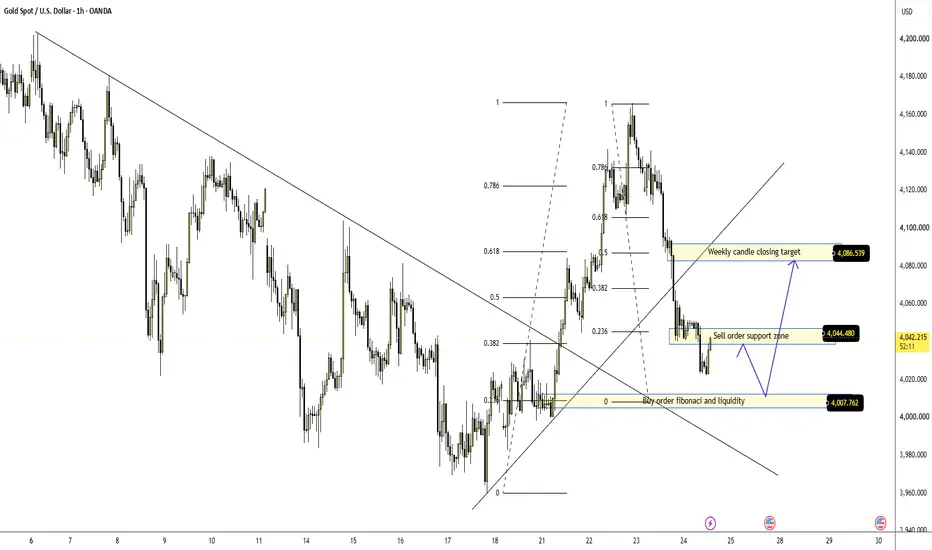
Gold is pulling back after a strong rejection from the recent high.
Price is currently trading around 4,038 after losing momentum from the upper area near 4,160. Sellers have clearly regained short-term control, and the chart is now testing whether this decline is only a correction or the start of a deeper bearish continuation.
The important point is simple: gold is still above the key buy order Fibonacci zone around 4,007. As long as this area holds, buyers still have a chance to defend the weekly recovery.
FUNDAMENTAL ANALYSIS
Gold is trading softer after dropping from its near two-week high, while the U.S. dollar also remains under pressure due to tariff concerns and profit-taking.
However, sellers have regained short-term control after the recent bearish breakdown signal, and weaker RSI on the daily chart shows that momentum has cooled.
Even with the pullback, gold is still on track for its first weekly gain after three weeks of losses. This makes today’s closing area very important.
TECHNICAL ANALYSIS – SMC + FIBONACCI
From an SMC perspective, gold has reacted strongly from the upper zone and created a clear downside move. The market broke below the short-term rising structure, showing that buyers lost control after the recent recovery.
The current sell order support zone around 4,044 is now acting as the first resistance. If price fails to reclaim this level, sellers may continue to pressure gold lower.
Below price, the key area is the buy order Fibonacci and liquidity zone around 4,007. This is the main decision zone on the chart. If buyers defend this level, gold may create a recovery back toward 4,044 and possibly the weekly candle closing target around 4,086.
The 4,086 area is important because it represents the weekly closing target and short-term recovery resistance. A clean move back above 4,044 would make this target more realistic.
But if gold breaks below 4,007 with strong momentum, the weekly recovery weakens and sellers may continue pushing price toward lower liquidity.
KEY PRICE ZONES
Current price: 4,038
Sell order support zone: 4,044
Buy order Fibonacci / liquidity zone: 4,007
Weekly candle closing target: 4,086
Short-term resistance: 4,044 – 4,086
Lower support if 4,007 fails: 3,980 – 3,960
Bullish recovery valid: Above 4,007
Bearish pressure remains: Below 4,044
Invalidation for recovery view: Below 4,007
TRADING SCENARIOS
Buy Scenario
Buy Zone: 4,007
Entry: Bullish reaction, liquidity sweep, or lower-timeframe CHoCH from the buy order Fibonacci zone
SL: Below 4,007 or below the nearest swing low
TP1: 4,044
TP2: 4,086
Breakout Buy
Condition: Break and hold above 4,044
Target: 4,086
Sell Scenario
Sell Zone: 4,044
Entry: Bearish rejection, failed reclaim, or lower-timeframe bearish CHoCH
SL: Above 4,086
TP1: 4,007
TP2: 3,980 – 3,960
Breakdown Sell
Condition: Clean break below 4,007
Target: 3,980 – 3,960
MY VIEW
Gold is under short-term selling pressure, but the weekly recovery is not fully broken yet.
The chart is now sitting between two important levels: 4,044 above and 4,007 below. If buyers defend 4,007, gold may still recover toward 4,086 before the weekly close. But if price rejects from 4,044 or breaks below 4,007, sellers may take control again.
For me, this is a decision-zone chart.
I do not want to chase the middle. I want to see whether gold can reclaim 4,044, or whether sellers push it back into the 4,007 liquidity zone.
Do you think gold will defend 4,007 and recover toward 4,086, or will sellers break the weekly support?
 Long
Long
XAUUSD: Wave 5 Selling Targets 3,993Gold is still trading under bearish pressure after breaking below the previous uptrend trendline. From Kelly’s view, the current structure suggests that the market may still be moving inside a bearish Elliott Wave sequence, with wave 5 aiming towards the lower Fibonacci target area.
The key idea is simple: gold may rebound slightly first, but as long as price stays below the sell zone and strong liquidity resistance, the downside structure remains active.
⟡ Market structure
The chart shows gold completed a strong recovery earlier, but that bullish structure weakened after price rejected from the upper area and broke below the rising trendline.
After the breakdown, gold created a clear bearish sequence with lower highs and lower lows. Price is now trading around 4,026, sitting directly under the 4,028–4,032 sell zone.
This area is important because it may act as the wave 4 retest before wave 5 continues lower. If sellers defend this zone, gold may rotate back towards the 4,000 support, then the 3,993 Fibonacci 2.618 target zone.
The strong liquidity zone around 4,045–4,052 is the key resistance above. If gold cannot reclaim this area, the bearish wave structure remains in control.
➤ Key levels
◌ 4,028–4,032: sell zone and wave 4 retest area
◌ 4,045–4,052: strong liquidity resistance
◌ 4,026: current price reaction area
◌ 4,000: first support and downside checkpoint
◌ 3,990–3,995: Fibonacci 2.618 target / possible wave 5 end
◌ Above 4,052: area where the bearish setup starts to weaken
⌁ Elliott Wave view
From an Elliott Wave perspective, gold appears to be developing the final bearish leg of a 5-wave decline.
Wave 1 started after price lost bullish momentum from the upper area.
Wave 2 created a corrective rebound but failed to change the structure.
Wave 3 delivered the stronger bearish push below the trendline.
Wave 4 may now be forming around the 4,028–4,032 sell zone.
If this zone holds, wave 5 may continue lower towards 3,990–3,995.
The Fibonacci 2.618 level near 3,993 is important because it aligns with the projected wave 5 completion zone. This makes the lower support area a key target for sellers, but also a zone where a short-term reaction may appear.
▸ Trading scenario
Preferred scenario: wait for price to retest the sell zone and show bearish confirmation.
Sell zone: 4,028–4,032 if rejection appears
Stop loss: above 4,052 or above the confirmed rejection high
Take profit 1: 4,000
Take profit 2: 3,993
Take profit 3: 3,980 if wave 5 extends strongly
Alternative scenario: if gold breaks above 4,052 and holds with strong acceptance, the bearish wave 5 setup weakens. In that case, price may move into a larger corrective recovery before the next structure becomes clear.
⌁ Kelly’s view
For Kelly, this is still a bearish Elliott Wave setup. Gold has already broken the uptrend line, and the recovery attempts are still happening below resistance.
The cleanest plan is to wait for price reaction around 4,028–4,032. If sellers defend this zone, the next move may continue towards the Fibonacci wave 5 target near 3,993.
Gold remains weak below the sell zone. If resistance holds, wave 5 may continue lower before a stronger reaction appears.
Share your view below. Short 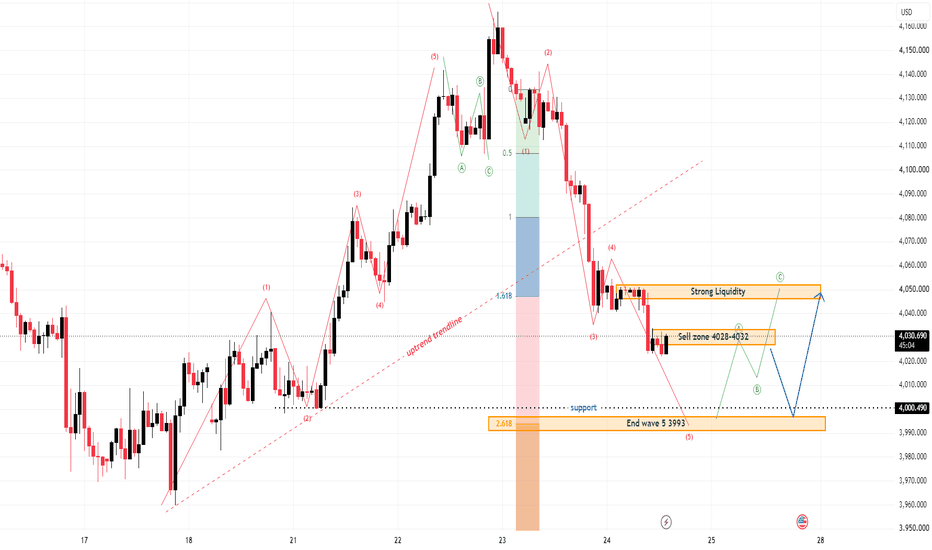
XAUUSD (H1) | Gold Coils Below $4,080 Resistance
Weekly Close Shakeout or Pre-FOMC Bear Trap?
The Gold market (XAUUSD) enters a highly anticipated Friday session under tight technical compression as market participants prepare for the upcoming weekly close. With the crucial US Federal Reserve policy decision looming next week, institutional desks (Smart Money) are actively de-risking and rebalancing positions.
Fundamentally, the intraday order flow is guided by automated trading algorithms capitalizing on pre-FOMC positioning. As broader macroeconomic uncertainty keeps volatility compressed, gold remains structurally capped beneath major overhead supply layers. Unless safe-haven buyers force a decisive breakout above key technical pivots, the path of least resistance favors a targeted liquidity sweep to rebalance lower structural inefficiencies before the weekend.
Analyzing the H1 market geometry, the key coordinates to track for today's session include:
Major Overhead Resistance: 4,080.000 – 4,120.000 – Premium supply confluence zone and dynamic channel ceiling. This acts as the primary invalidation threshold for short-term bears.
Immediate Trading Pivot: 4,020.000 – 4,040.000 – Near-term horizontal checkpoint where high-frequency algorithms are executing intraday order-matching.
Major Liquidity Target (Demand Floor): 3,940.000 – 3,960.000 – Major institutional accumulation floor and structural liquidity pool containing resting buy-limit clusters.
Will algorithmic sellers force a clean Friday flush toward the $3,940 demand floor, or will pre-weekend short-covering spark an unexpected squeeze back above $4,080?
The Bearish Case (Sellers): The H1 bearish order flow remains structurally dominant beneath the $4,080 resistance. With traders de-risking ahead of next week's Fed meeting, buyers lack the aggressive volume to break dynamic ceilings. A puncture below $4,020 will trigger stop-loss cascades, driving a swift capitulation sweep straight into the $3,940 demand matrix.
The Bullish Case (Buyers): Shorting at the bottom of a compressed range ahead of the weekly close is a high-risk trap. The $3,940 – $4,000 zone represents a heavily defended institutional discount floor. If buyers absorb intraday supply and print a lower-timeframe Change of Character (CHOCH) above $4,040, a sharp V-shaped short-squeeze will catch breakout sellers off guard.
💬 What is your execution playbook for today's Friday close? Are you shorting the resistance retest or waiting to buy the extreme liquidity sweep? Share your charts below!
Short 
AXISBANKSupport Levels
S1: ₹1,242
S2: ₹1,228
S3: ₹1,207 (major support)
Resistance Levels
R1: ₹1,277
R2: ₹1,298
R3: ₹1,312 (major resistance)
Trading View
Bullish above ₹1,277: Momentum can extend towards ₹1,298–1,312.
Bearish below ₹1,242: Selling pressure may push the stock towards ₹1,228 and then ₹1,207.
Best swing buying zone: Around ₹1,228–1,242, provided price shows a bullish reversal.
Strong breakout confirmation: Sustained close above ₹1,312.
Recent market action has been weak after quarterly results, so watch for confirmation before taking fresh long positions. Bharti AirtelSupport Levels
S1: ₹1,920–1,930
S2: ₹1,890–1,900
Strong Support: ₹1,850
Resistance Levels
R1: ₹1,960–1,980
R2: ₹2,010–2,030
Major Resistance: ₹2,100
Trading View
Bullish above: ₹1,980 (can open the way towards ₹2,030–2,100)
Bearish below: ₹1,900 (next downside zone around ₹1,850)
If you're trading intraday, keep an eye on ₹1,930 as immediate support and ₹1,960 as the first hurdle. Reliance IndustriesSupport
S1: ₹1,270
S2: ₹1,250
S3: ₹1,220
Resistance
R1: ₹1,300
R2: ₹1,325
R3: ₹1,360
Trading View
Bullish Scenario
Sustained move above ₹1,300 can target ₹1,325 → ₹1,360.
A breakout above ₹1,360 would improve the medium-term trend.
Bearish Scenario
A close below ₹1,270 may lead to ₹1,250, followed by ₹1,220 if selling pressure continues.
Trading Bias
Short-term: Bearish to Neutral
Swing: Wait for a breakout above ₹1,300 or a reversal from ₹1,250–1,270 before considering fresh long positions.  Long
Long
 Short
Short
Nifty : Intraday Trading Plan: 24-Jul-2026Date: 24th July 2026
Instrument: Nifty 50 Index
Timeframe: 15 Minutes
Current Close: 23,872.20
Overall Nifty Trend & Market Sentiment
The Nifty 50 has been witnessing a corrective phase from the recent swing high of 24,350. The price action shows a series of lower highs and lower lows, indicating a short-term Bearish Bias. However, the market is currently consolidating in a critical zone.
Primary Trend: Bearish (Correction from highs).
Intraday Bias: Neutral to Bearish (until 23,911 is crossed).
Key Observation: The market is currently sitting inside a "No Trade Zone" (23,835 - 23,911). This is a decision-making area.
🗺️ Key Levels to Watch
🔴 Major Resistance: 24,247.00
🔴 Last Intraday Resistance: 24,087.00
Opening Resistance: 23,911.00
🟠 Opening Support: 23,835.00
🔵 Last Intraday Support Zone: 23,609 - 23,650
🚀 Scenario 1: Gap Up Opening (100+ Points)
(Expected Open: ~23,975 or higher)
If Nifty opens with a strong Gap Up above 23,972, it immediately clears the "Opening Resistance" of 23,911. This invalidates the immediate bearish structure and suggests strong buying interest.
Action: Bullish / Long Side (Green Line) 🟢
Plan: Wait for the first 15-minute candle to settle. If the price sustains above 23,911, look for Call (CE) buying opportunities.
Target 1: 24,087 (Last Intraday Resistance).
Target 2: 24,247 (Major Resistance).
Stop Loss: Strict SL below the Opening Resistance (23,911).
Chart Logic: Follow the Solid Green Line. If the market faces rejection at 24,087, watch the Dashed Green Line which indicates a potential pullback or consolidation before the next move.
⚖️ Scenario 2: Flat Opening (Inside No Trade Zone)
(Expected Open: Between 23,835 and 23,911)
This is the most critical scenario. The market opens right inside the grey box labeled "No Trade Zone". This indicates indecision and a battle between buyers and sellers.
Action: No Trade / Sideways (Orange Line) 🟠
Plan: Do not trade inside this zone. Option buyers will suffer from Theta Decay (time value loss) here.
Bullish Trigger: Wait for a 15-min candle close above 23,911. Then go Long.
Bearish Trigger: Wait for a 15-min candle close below 23,835. Then go Short.
Chart Logic: The Orange Line/Zone represents the "No Trade" area. The Dashed Orange Line shows that even if it moves up to 24,000, it might face selling pressure and come back down (uncertainty).
📉 Scenario 3: Gap Down Opening (100+ Points)
(Expected Open: ~23,770 or lower)
If Nifty opens with a significant Gap Down below 23,772, it breaks the "Opening Support" of 23,835. This confirms the continuation of the bearish trend.
Action: Bearish / Short Side (Red Line)
Plan: Wait for a pullback to retest 23,835 as resistance. If rejected, enter Short (PE buying).
Target 1: 23,700 (Psychological support).
Target 2: 23,609 - 23,650 (Last Intraday Support Zone).
Stop Loss: Above the Opening Support (23,835).
Chart Logic: Follow the Solid Red Line. The Dashed Teal/Green Line at the bottom indicates that once the price hits the support zone (23,609), a reversal or bounce is possible, so book profits there.
🎓 Educational Insight: Understanding the Chart Lines
🟠 Orange Line/Zone: Represents the "No Trade Zone". In trading, consolidation zones are dangerous for option buyers. The market lacks direction here.
🟢 Green Line: Indicates a Bullish/Long trend. When price breaks resistance, momentum shifts upward.
🔴 Red Line: Indicates a Bearish/Short trend. When price breaks support, panic selling or profit booking ensues.
〰️ Dashed Lines: These indicate "Maybe" or Uncertainty. For example, a dashed line after a rise suggests the trend might pause or pull back. It warns traders not to chase the price blindly at resistance levels.
🛡️ Risk Management Tips for Options Trading
🔹 Avoid the "No Trade Zone": Never buy options when the market is sideways (Flat Open scenario). Time decay (Theta) will eat your premium.
🔹 Position Sizing: Never risk more than 2-5% of your total capital on a single intraday trade.
🔹 Stop Loss is Mandatory: In options, premiums can drop 20-30% in minutes. Always have a system SL (e.g., 10-15% of premium price).
🔹 Trail your SL: If Nifty moves 50 points in your favor, move your Stop Loss to your entry price (Cost-to-Cost) to make it a risk-free trade.
📝 Summary & Conclusion
For 24-Jul-2026, the Nifty is at a crucial junction.
Bullish View: Only valid above 23,911. Targets are 24,087 and 24,247.
Bearish View: Only valid below 23,835. Targets are 23,609 - 23,650.
Neutral View: Between 23,835 and 23,911. Stay away.
The chart suggests that the path of least resistance is currently downwards (Red Line), but a Gap Up can change the narrative instantly. Respect the levels and wait for confirmation!
⚠️ Disclaimer:
I am not a SEBI registered analyst. This post is for educational purposes only and does not constitute financial advice. Trading in F&O involves high risk and can lead to capital loss. Please consult your financial advisor before taking any trades. Past performance is not indicative of future results.
#Nifty50 #TradingPlan #IntradayTrading #OptionBuying #TechnicalAnalysis Long 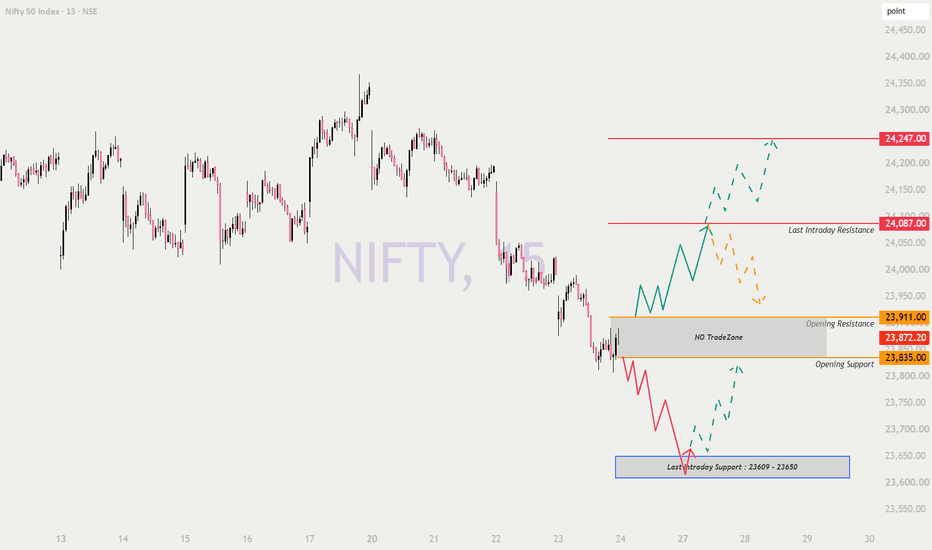
What Does "Wave 3 = 1.618 × Wave 1" Really Mean?
Understanding Fibonacci Extension and Trend-Based Fibonacci Extension
Fibonacci Extension vs. Trend-Based Fibonacci Extension
Most traders are familiar with the Fibonacci Retracement tool , which provides Fibonacci ratios from 0 to 1 . It requires two touch points , generally the top and bottom of a price swing, and is primarily used to identify potential support and resistance during a correction .
Fibonacci Extension is an equally important tool, but is used for an entirely different purpose. Let us understand the difference.
There are two ways to use Fibonacci Extension:
1. Fibonacci Extension
Like the Fibonacci Retracement tool, the Fibonacci Extension tool requires two touch points , representing the beginning and end of a price swing. Unlike the retracement tool, i t projects Fibonacci ratios above 1 , helping estimate the probable extent of the next price move.
Usage:
Suppose a trader enters a trade after price finds support at the 61.8% retracement level. The Fibonacci Extension tool can then be used to identify potential profit targets, with 1.618 being one of the most commonly watched extension levels.
2. Trend-Based Fibonacci Extension (TBFE)
This is the tool that virtually every experienced Elliott Wave analyst uses extensively. In fact, it is one of the most important tools in Elliott Wave analysis.
Unlike the standard Fibonacci Extension tool, Trend-Based Fibonacci Extension (TBFE) projects Fibonacci levels from a "reference point" , while keeping the projection dynamically linked to the preceding price swing. This makes it ideal for analysing developing waves in real time.
How to use TBFE and interpret its levels
Trend-Based Fibonacci Extension uses three touch points . The first point marks the beginning of the impulse wave, the second point marks its end, and the third point marks the end of the subsequent correction. Once these three points are selected, the tool projects a series of Fibonacci extension levels—0.236, 0.382, 0.618, 1.000, 1.272, 1.618, 2.000, 2.618, and beyond.
The interpretation of these levels is what matters most.
The 1.000 extension signifies that, measured from the end of the correction (the reference point), the projected wave has travelled a distance equal to the length of the original impulse wave .
Similarly, the 1.618 extension indicates that, from the same reference point, the projected wave has travelled 1.618 times the length of the original impulse wave .
Every extension level expresses the length of the developing wave as a multiple of the reference swing, measured from the reference point. Thus, a 1.000 extension represents a wave equal in length to the reference swing, while a 1.618 extension represents a wave that is 1.618 times the length of the reference swing.
Why is this important?
The Elliott Wave Principle is built on the premise that every wave bears a mathematical relationship to another wave, and these relationships are most commonly expressed through Fibonacci ratios .
Some common examples are:
Wave 3 often extends to 1.618 × Wave 1, or even higher in strong trending markets.
Wave 5 frequently relates to the length of Wave 1-3 or Wave 3 alone.
Corrective waves also exhibit recurring Fibonacci relationships.
As each sub-wave develops, TBFE enables these relationships to be monitored in real time. Instead of merely guessing where a wave may terminate, we can identify high-probability target zones based on well-established Fibonacci relationships.
You do not need to be an Elliott Wave analyst to benefit from these levels.
Understanding how TBFE works will help you better interpret Elliott Wave analysis. When an Elliott Wave analyst marks Fibonacci ratios and target zones on a chart, they are not arbitrary numbers—they represent the mathematical relationships that repeatedly occur between market waves.
Once you understand this concept, following live chart updates and Elliott Wave analysis will become much easier and more meaningful.
 Education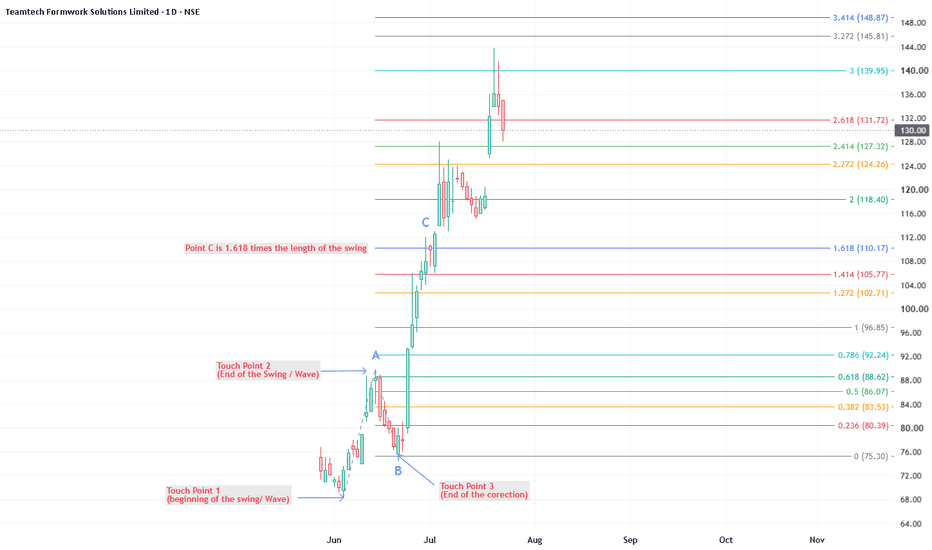
 Long
Long
Short 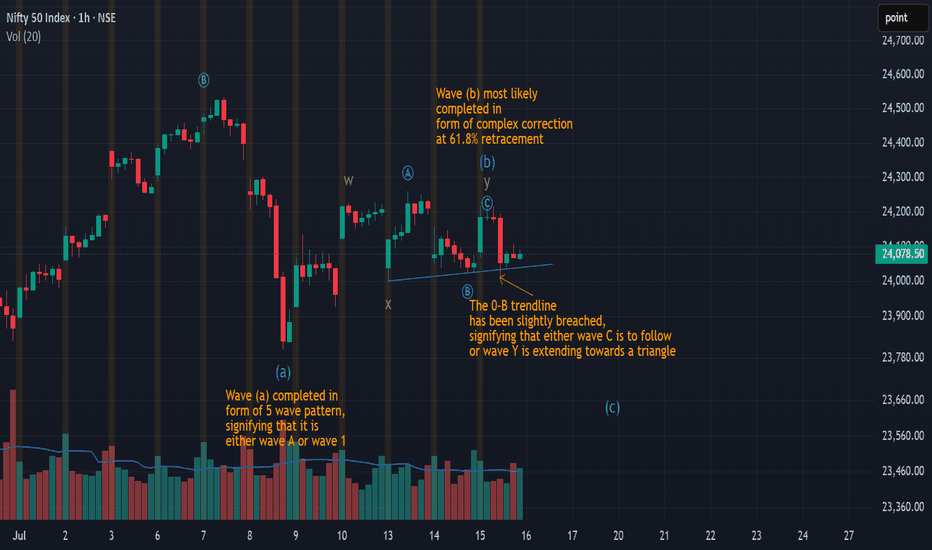
 Long
Long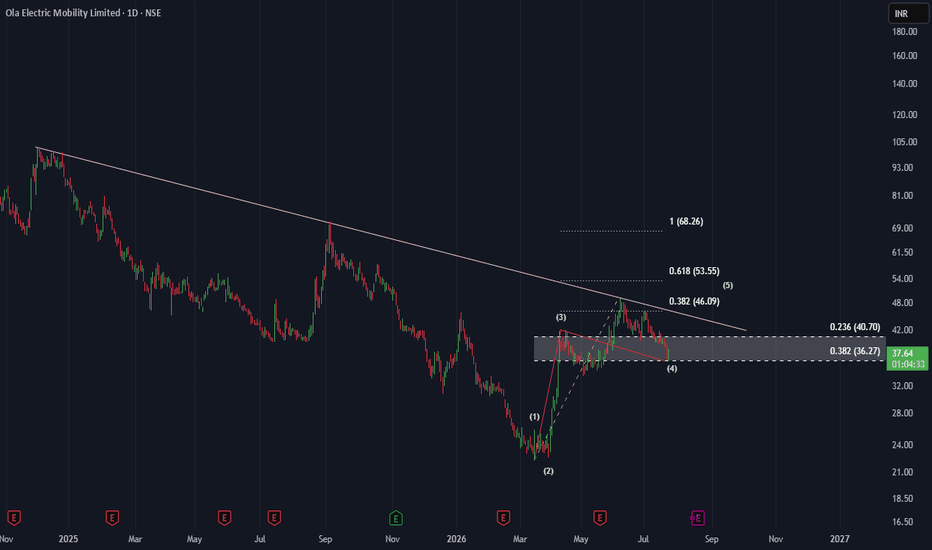
Internal Structure of a Converging Triangle (ABCDE)🌊 Understanding the Internal Structure of an Elliott Wave Converging Triangle (ABCDE)
A Converging Triangle is one of the most recognizable Elliott Wave corrective patterns. It consists of five legs labelled (A)-(B)-(C)-(D)-(E), with each swing becoming progressively smaller as price contracts between two converging trendlines.
As illustrated in the chart, the triangle develops after a strong impulsive move and typically appears in Wave 4 of an impulse or Wave B/Y/X of a corrective structure. Once the triangle is complete, the dominant trend usually resumes with a sharp thrust out of the pattern.
📌 Internal Structure :-
Unlike an impulse wave, every leg of a triangle is corrective.
One important point many traders overlook is that each leg—(A), (B), (C), (D), and (E)—does not have to be a simple Zigzag.
As shown in the diagram, any leg can unfold as:
Single Zigzag (ABC) → 5-3-5
Double Zigzag (WXY) → 3-3-3
Triple Zigzag (WXYXZ) → 3-3-3-3-3
This flexibility is one of the reasons triangle analysis often confuses traders. The market may continue extending one leg into a Double or Triple Zigzag before moving to the next swing, while still respecting the converging boundaries.
📈 Market Psychology :-
Each swing inside the triangle represents a battle between buyers and sellers.
(A) begins the contraction.
(B) retraces but fails to continue the previous trend.
(C) reverses again with reduced momentum.
(D) produces another smaller corrective swing.
(E) completes the final contraction, leaving the market compressed and ready for expansion.
Notice how every swing becomes smaller, reflecting declining volatility and increasing indecision.
🚀 What Happens Next?
Once Wave (E) is complete, the triangle usually ends with a powerful thrust in the direction of the larger trend.
This thrust is often fast because the market has spent considerable time building energy inside the contracting range.
⚠️ Key Takeaway :-
A Converging Triangle is not a continuation of the trend itself—it is a pause before continuation.
The most important concept is to focus on the internal structure of each leg, rather than assuming every swing is identical. Correctly identifying whether a leg is a Single Zigzag, Double Zigzag, or Triple Zigzag can significantly improve wave counts and help avoid premature trading decisions.
***********************************************************************
Warning ⚠
This post is for educational purposes only and should be combined with proper risk management and confirmation from price action before making trading decisions.
***********************************************************************
#ElliottWave #ConvergingTriangle #TrianglePattern #ABCDE #CorrectiveWaves #WaveAnalysis #TechnicalAnalysis #PriceAction #MarketStructure #Zigzag #DoubleZigzag #TripleZigzag #Wave4 #WaveB #WaveX #TradingEducation #TradingView #StockMarket #SwingTrading #PositionTrading #ChartAnalysis #Nifty #BankNifty #LearnTrading #NikhilKanal Education 
 Long
Long