Nifty : Intraday Trading Plan: 22-Jul-2026
Welcome traders! 👋 Here is a detailed, professional trading plan for Nifty 50 for the upcoming session. We will analyze the chart structure to define our strategy for every possible opening scenario.
🎨 Chart Legend & Color Code
🟠 Orange Line/Box: No Trade Zone / Sideways Market / Caution Area.
🟢 Green Line/Box: Bullish Zone / Support / Long Side.
🔴 Red Line: Bearish Zone / Resistance / Short Side.
⚪ Dashed Line: Probable Trend (Maybe/Maybe Not) – Wait for confirmation!
📈 Overall Nifty Trend (Intraday)
Looking at the chart, Nifty is currently trading at 24,193.95. The market is in a consolidation phase after recent volatility.
Immediate Bias: Neutral to Slightly Bullish.
Key Observation: The price is sandwiched between the Opening Support (24,146) and Opening Resistance (24,230-24,251).
The "Green" Path: If buyers defend 24,146, we could see a solid move up towards 24,317 (Last Intraday Resistance) and potentially 24,375.
The "Red" Path: If sellers push price below 24,146, we might see a slide down to the 24,033-24,056 support zone.
🚀 Scenario 1: Gap Up Opening (100+ Points)
(Expected Open: ~24,295 - 24,300)
If the market gaps up by 100+ points, it will open very close to the Last Intraday Resistance (24,317) and well above the Opening Resistance Zone (24,230-24,251).
🔍 Analysis: A gap up of this magnitude often leads to profit booking. The price is entering the "Red Zone" (Resistance).
🟢 Bullish Action (Long): Do not chase the gap immediately. Wait for the price to sustain above 24,317 (Red Line). If a 15-min candle closes above this level, look for a move towards 24,375 (following the green dashed line).
🔴 Bearish Action (Short): If the price opens near 24,300 and shows rejection candles (Shooting Star, Bearish Engulfing) at 24,317, initiate a Short position. The target would be a gap fill down to 24,250.
🟠 No Trade: Avoid buying right at the open as the Risk:Reward ratio is poor near resistance.
⚖️ Scenario 2: Flat Opening
(Expected Open: ~24,180 - 24,210)
If the market opens flat, it opens right in the middle of the chart, between the Orange Line (24,146) and the Orange Box (24,230-24,251).
🔍 Analysis: This is the classic "Chop Zone". The market lacks direction initially.
🟠 No Trade Zone: The zone between 24,146 and 24,230 is your "Sideways" area. Trading here is dangerous for option buyers due to Theta decay.
🟢 Bullish Action (Long): Wait for a breakout above the Orange Box (24,251). Once confirmed, go Long with a target of 24,317.
🔴 Bearish Action (Short): Wait for a breakdown below the Orange Line (24,146). Once confirmed, go Short with a target of 24,056 (Green Box).
⚪ Dashed Line Logic: The red dashed line shows a potential drop from the resistance zone, while the green solid line shows a potential rise from support. Patience is key here!
📉 Scenario 3: Gap Down Opening (100+ Points)
(Expected Open: ~24,090 - 24,100)
If the market gaps down significantly, it opens below the Orange Line (24,146) and heads straight towards the Last Intraday Support (24,033-24,056).
🔍 Analysis: Panic selling might occur initially. The price is entering the "Green Box" (Strong Support).
🟢 Bullish Action (Long): Watch the 24,033-24,056 zone closely. If the price stabilizes here and forms a reversal pattern (like a Hammer), take a Long position for a bounce back to 24,146 (following the green dashed line up).
🔴 Bearish Action (Short): If the price crashes through 24,033 with high volume, the support has failed. Go Short (follow the trend down).
️ Caution: Gap downs often see a "Dead Cat Bounce". Don't short right at the support line; wait for a breakdown.
🛡️ Risk Management Tips for Options Trading
Trading options requires strict discipline. Here are some golden rules:
Stop Loss is Mandatory: Never trade without a Stop Loss (SL). For options, a 10-15% premium SL or a spot level SL (as mentioned above) is crucial.
🔹 Position Sizing: Never risk more than 2-5% of your total capital on a single trade. If you have ₹1 Lakh, don't lose more than ₹2,000-₹5,000 on one setup.
🔹 Avoid the "Orange Zone": If the market is sideways (Flat opening scenario), option buyers will lose money due to time decay (Theta). Stay out or trade very small quantities.
🔹 Trail Your SL: Once you are in profit, move your Stop Loss to your entry price (Cost-to-Cost). Protect your capital first!
🔹 Don't Average Losers: If a trade goes against you, exit. Do not add more quantity to a losing position hoping for a recovery.
Summary & Conclusion
To summarize the plan for 22-Jul-2026:
Trend: The market is range-bound. Watch 24,146 (Support) and 24,230-24,251 (Resistance).
Gap Up: Watch for rejection at 24,317 (Short) or breakout (Long to 24,375).
Flat: Stay out of the 24,146 - 24,230 zone (Orange/No Trade). Trade the breakout/breakdown only.
Gap Down: Watch for support at 24,033-24,056 (Long for bounce).
Conclusion: The chart suggests a battle between bulls and bears in the 24,146 - 24,251 range. The Orange zones indicate areas of confusion—avoid trading there. Wait for the market to pick a direction (Green or Red lines) before committing your capital. The dashed lines remind us that anything is possible, so always wait for candle confirmation! 📈📉
⚠️ Disclaimer:
I am not a SEBI registered analyst. This post is for educational purposes only. Trading in the stock market and F&O involves high risk and can lead to capital loss. Please consult your financial advisor before taking any trades. The charts and levels are based on technical analysis and probabilities, not guarantees. 🙏  Long
Long
 Long
Long
BRIAN XAUUSD – GOLD REBOUNDS, BUT THE REAL TEST IS ABOVE BRIAN XAUUSD – GOLD REBOUNDS, BUT THE REAL TEST IS ABOVE
Gold is recovering from last week’s bottom area, but the market is still not in a clean bullish structure.
Price is moving inside a short-term rising channel after reacting from the lower value zone. The rebound looks controlled, but with US-Iran tension still active and the market pricing at least one Fed hike by year-end, gold may continue to face selling pressure at higher prices.
The chart is clear now: gold can still push higher, but the upper liquidity zone is where the real test begins.
Technical structure
On the H1 chart, gold has bounced from the lower base and is now trading around 4,060.
The POC Buy Reaction Zone around 4,005 - 4,012 remains the main support below current price. As long as gold holds above this area, the short-term rebound can continue.
However, the upper zone around 4,095 - 4,105 is marked as the main sell area. This is where sellers may defend again if price reaches higher liquidity.
The rising channel supports the recovery, but price is now getting closer to resistance. That means chasing buy too late becomes risky.
Important zones
POC Buy Reaction Zone: 4,005 - 4,012
Main value support and reaction base.
Buy scalping area: 4,055 - 4,065
Short-term reaction area inside the current rebound.
Careful selling zone: 4,081
First upper reaction level.
Sell gold here: 4,095 - 4,105
Main resistance and preferred sell-reaction zone.
Last week’s bottom: 3,959
Major downside reference if the recovery fails.
Trading scenario
Sell reaction from 4,095 - 4,105
Entry:
Look for sell positions only if price rallies into 4,095 - 4,105 and shows clear rejection.
Stop Loss:
Above the sell zone or above the local rejection high.
Take Profit:
TP1: 4,081
TP2: 4,055 - 4,065
TP3: 4,005 - 4,012
This setup is based on waiting for gold to move into upper liquidity first, then watching whether sellers defend that value zone.
Final view
Gold can continue the short-term rebound while it holds above the POC Buy Reaction Zone.
But the main structure is not fully bullish yet. The stronger decision area is above, around 4,095 - 4,105.
If gold reaches that zone and fails, sellers may take control again.
For now, I do not want to chase the middle. Let price reach liquidity. Then trade the reaction.
 Long
Long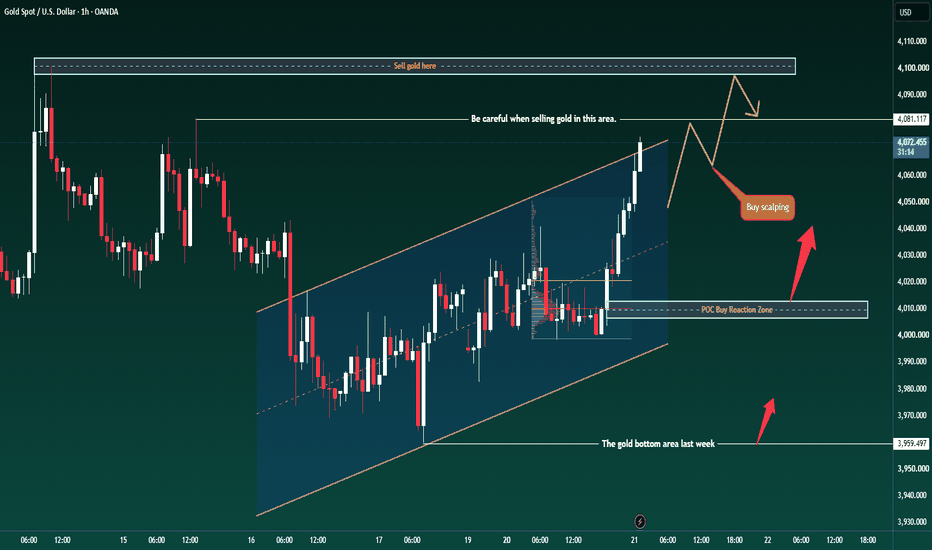


Trading AnalysisWhere is Nifty right now?
Nifty closed at 23,689 on Thursday May 14. After a brutal fall earlier this week (it touched ~23,300), it bounced back for 2 days in a row. So right now it's in a recovery mood — but it hasn't really "fixed" itself yet. Think of it like someone who had a fever, now feeling slightly better, but not fully healthy.
2 What's the wall above? (Resistance)
If Nifty tries to go up next week, it will hit a wall around 23,500–23,600 first. That's the first test. If it somehow crosses that, the BIGGER wall is at 23,900–24,000 — where all the major moving averages (50-day & 200-day) are sitting. Lots of sellers will be waiting there to book profits. So going above 24,000 next week? Unlikely unless something very positive happens.
3 What's the floor below? (Support)
If Nifty starts falling, the first safety net is around 23,300–23,150. This zone has held multiple times recently. If it breaks this level decisively (and stays below it), then the next stop could be 23,000 or even 22,900. That's the danger zone — but that's not the most likely scenario for next week.


Induslnd bank weekly chart bullish Reversal #nifty #reversalIndusInd Bank – Weekly Chart Analysis
📈 Trend: Bullish
The stock is forming a strong Higher High (HH) and Higher Low (HL) structure.
Price is trading above the Supertrend, indicating bullish momentum.
🔑 Key Levels
Current Price: ₹1,067
Immediate Support: ₹1,000–1,020
Major Support: ₹900–930
Immediate Resistance: ₹1,100
Major Resistance: ₹1,250–1,300
📊 Technical Outlook
The weekly trend remains positive.
As long as the stock holds above ₹1,000, the bullish structure remains intact.
A weekly breakout above ₹1,100 could open the door for a move toward ₹1,250–1,300.
🎯 Trading Plan
Buy on Dip: ₹1,000–1,020 (after bullish confirmation)
Breakout Buy: Above ₹1,100 with strong volume
Stop Loss: Below ₹980 (weekly closing basis)
Overall View:
IndusInd Bank is in a strong bullish trend. As long as it stays above ₹1,000, the probability of further upside remains favorable.  Long
Long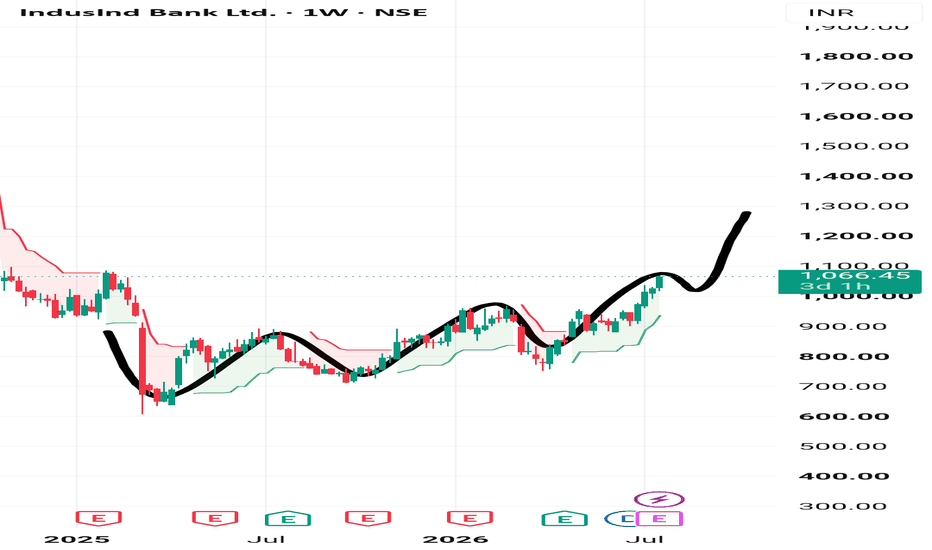
 Long
Long
Long 
Education 
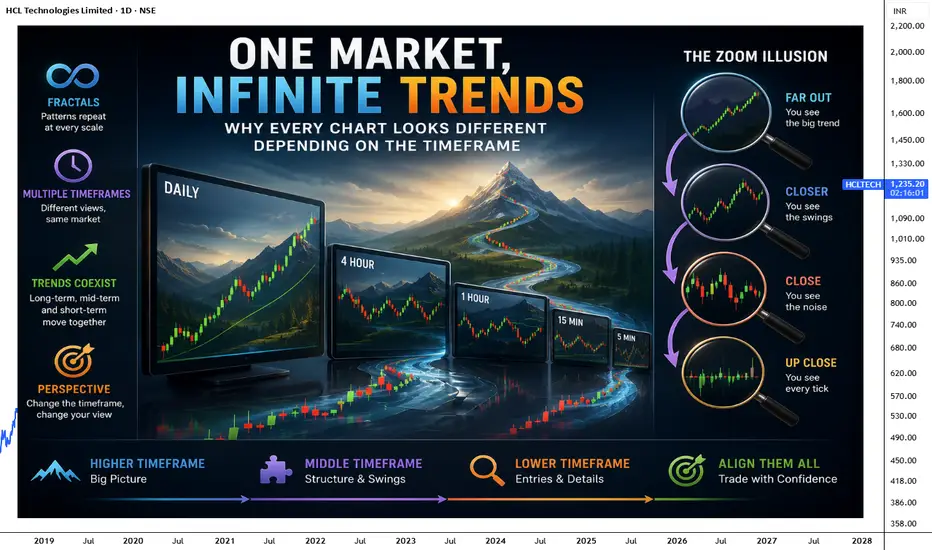
One Market, Infinite TrendsHave you ever noticed something strange while looking at charts? You open the 5-minute timeframe and see a strong uptrend. Then you switch to the 1-hour chart, and the market suddenly looks like it is moving sideways. Move to the daily timeframe, and now it looks like a downtrend. The obvious question is, **which one is correct?
The surprising answer is that they are all correct . The market does not have just one trend. It has many trends happening at the same time. Understanding this simple idea can completely change the way you read charts and explain why experienced traders rarely rely on only one timeframe.
Every Timeframe Tells a Different Story
Think of standing in front of a mountain. If you stand very close, you only see rocks, trees, and small details. As you move farther away, you begin to see the entire mountain. Neither view is wrong. You are simply looking at the same object from a different distance.
Charts work the same way. A lower timeframe shows every small battle between buyers and sellers. A higher timeframe hides that noise and reveals the bigger picture. The market has not changed. Only your perspective has.
The Market Is Fractal:
One of the most fascinating characteristics of financial markets is that they are fractal. This means similar patterns repeat themselves across different timeframes.
A breakout on the 5-minute chart may look almost identical to a breakout on the daily chart. Trends, pullbacks, consolidations, and reversals appear everywhere, whether you are looking at one minute or one month.
It is like zooming into the branches of a tree. Every branch looks similar to the whole tree. The pattern repeats itself at different sizes.
This is why traders can use many of the same price action concepts on almost any timeframe.
Why Trends Can Coexist?
Many beginners believe there can only be one trend at a time. In reality, several trends can exist together without contradicting each other.
Imagine climbing a staircase.
Each step moves upward.
At the same time, you may walk slightly left or right while climbing.
From close up, your movement looks different.
From a distance, everyone can clearly see you are moving upstairs.
The market behaves in a similar way.
The daily chart may be in a strong uptrend.
Inside that uptrend, the 1-hour chart may show a temporary pullback.
Within that pullback, the 5-minute chart may even have its own short-term uptrend.
Each timeframe is simply showing a smaller part of the bigger picture.
The Zoom Illusion
Imagine opening Google Maps.
At the highest zoom level, you can see your entire country.
Zoom in, and you only see your city.
Zoom in again, and you see individual streets.
Finally, you see a single building.
Nothing has changed except your level of zoom.
Charts work the same way.
Changing timeframes is simply changing your zoom level.
The market itself remains the same.
Which Timeframe Is the Best?
This is one of the most common questions traders ask.
The truth is that no timeframe is better than another.
A scalper may only care about the 1-minute chart.
A swing trader may focus on the 4-hour and daily charts.
A long-term investor may rarely look below the weekly timeframe.
The best timeframe is the one that matches your trading style.
Instead of searching for the "perfect" timeframe, successful traders learn how different timeframes work together.
The Bigger Picture Always Matters:
Imagine reading a single sentence from a book without knowing the rest of the story. It is easy to misunderstand its meaning.
The same happens in trading.
Looking at only one timeframe can hide important information. A perfect buy setup on the 15-minute chart might actually be trading directly into a strong resistance level visible on the daily chart.
This is why experienced traders often begin with higher timeframes to understand the overall market direction before moving to lower timeframes to fine-tune their entries.
My Thoughts:
The market does not change when you switch timeframes. Only your perspective changes. Every timeframe reveals a different layer of the same story. Lower timeframes show the details, higher timeframes reveal the bigger picture, and together they create a complete view of the market.
The next time you see two charts showing different trends, remember this simple idea.
The market is not contradicting itself. You are simply looking at the same story from different distances.
By @BrightRally_Research on @TradingView  Education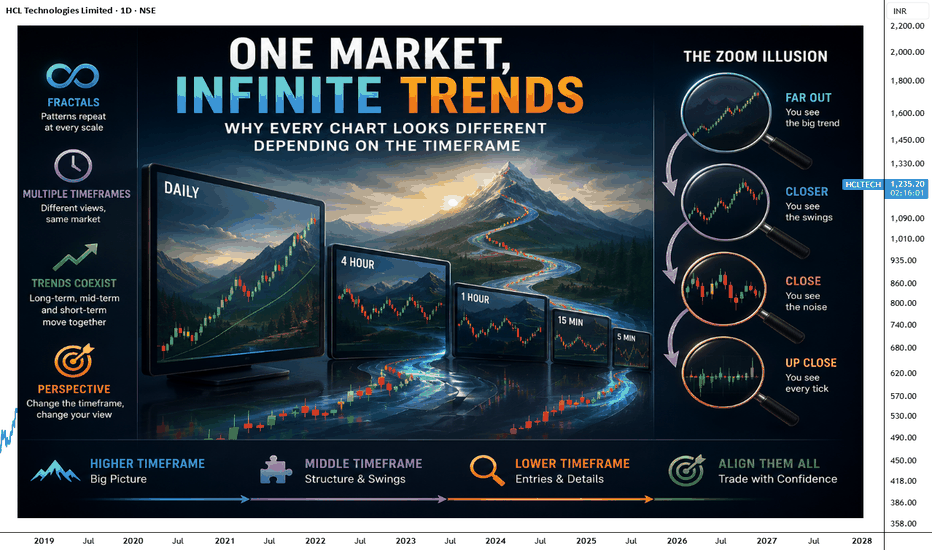
 Long
Long
 Long
Long
 Short
Short
Gold Eyes 4,080 — Breakout or Bull Trap?> Yến:
Gold Eyes 4,080 — Breakout or Bull Trap?
Gold continues to recover after reclaiming its ascending channel, while the U.S. Dollar remains under pressure as traders price in the possibility of Fed rate cuts later this year. With Treasury yields stabilizing and risk sentiment improving, buyers are attempting to regain short-term control.
However, the market is now approaching an important institutional supply area where the next impulsive move could begin.
Market Structure
✅ Price has broken the previous bearish trendline.
✅ The ascending channel remains intact.
✅ Higher highs and higher lows continue to develop.
✅ Price is trading above immediate demand, confirming buyers remain in control.
From an SMC perspective, institutions appear to be repricing the market higher while targeting liquidity resting above previous highs.
Key Levels
🟢 Immediate Demand (FVG): 4,000 – 4,005
First mitigation zone for buyers.
Intermediate Resistance: 4,028 – 4,032
Potential intraday reaction area.
🔴 Internal Relief Retest: 4,058 – 4,062
Important supply zone where profit-taking may appear.
🎯 Primary Buy-Side Liquidity Target: 4,080 – 4,085
Main upside objective if bullish momentum continues.
The breakout above the descending trendline suggests institutional buying interest has returned.
Rather than chasing price higher, Smart Money often allows price to revisit mitigation zones before driving toward the next Buy-Side Liquidity pool.
The current structure continues to favor buying while the ascending channel remains intact.
Will Gold sweep Buy-Side Liquidity above 4,080 first, or revisit demand before the next impulsive rally?
> Yến:
TradingView MIND
Gold Breaks Trendline—Is 4,080 the Next Liquidity Target? 🚀
Gold has reclaimed its bullish channel after breaking the descending trendline, while a softer USD continues to support precious metals.
From an SMC perspective, buyers remain in control as long as price holds above 4,000–4,005 demand. The next key obstacle sits at 4,060, where Smart Money could engineer a short-term pullback before continuing higher.
If bulls maintain momentum, the market may target the 4,080–4,085 Buy-Side Liquidity zone.
📌 Bias: Bullish
🟢 Buy Zone: 4,000–4,005
🔴 Resistance: 4,060–4,062
🎯 Target: 4,080–4,085
Do you expect Gold to break straight into buy-side liquidity, or will Smart Money retest demand first?
Long 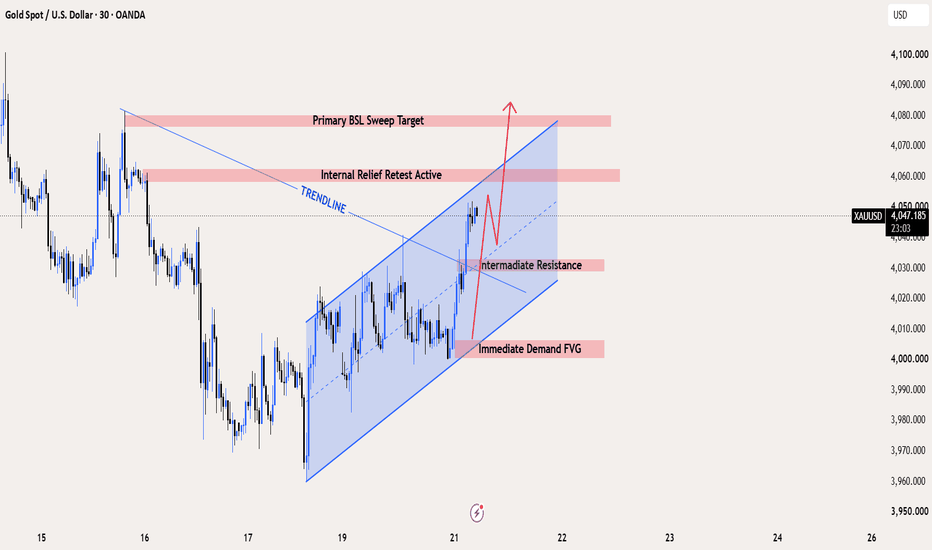
 Long
Long
 Long
Long
NIFTY – INTRADAY TRADING PLAN | 21-Jul-2026 | Expiry DayPrevious Close: 24,239.50 | Last Intraday Support: 24,162 | No Trade Zone: 24,251–24,317 | Last Intraday Resistance Zone: 24,464–24,510 | Buyer's Support: 24,032–24,055
⚠️ This is an educational post for learning purposes only. Please read levels along with price action, volume & candle confirmation before acting. Do not trade blindly on levels.
🟢 SCENARIO 1: GAP UP OPENING (100+ points, i.e., Open above ~24,340)
🔘 A gap-up of 100+ points means Nifty opens well above the No Trade Zone (24,251–24,317) directly near or above the resistance zone (24,464–24,510). This requires patience as gap-up opens are often followed by profit booking.
• 🟢 If price sustains above 24,464–24,510 zone with strong 15-min candle close, it confirms bullish continuation → Long bias can be considered on retest of this zone as support.
• 🔴 If price fails to sustain and slips back below 24,464 after initial spike, it signals exhaustion → Book profits on longs, avoid fresh longs, wait for further confirmation.
• 🟠 If gap-up open comes but price starts drifting back toward No Trade Zone (24,251–24,317) — treat this as a false gap/trap. Best to stay on sidelines till a clear breakout or breakdown happens.
⚙️ Action Plan:
▫️ Wait for first 15-30 min candle to close before entry — don't chase the gap.
▫️ Long Entry: Above 24,510 with SL below 24,464 → Target next resistance zones (trail SL).
▫️ If rejection seen from 24,464–24,510 zone, consider short only after confirmation candle, targeting back toward 24,317.
🟠 SCENARIO 2: FLAT OPENING (Within No Trade Zone 24,251–24,317)
🔘 A flat opening inside the No Trade Zone means the market lacks directional bias at open. This orange zone on chart is a "sideways/consolidation" zone — the dashed nature of trend lines here indicate uncertainty, so patience is key.
• 🟠 If Nifty opens and stays within 24,251–24,317, avoid trading immediately. Let the market pick a direction with volume confirmation.
• 🟢 Breakout above 24,317 with strong volume → Bullish bias activates, look for long opportunities targeting 24,464–24,510 resistance zone.
• 🔴 Breakdown below 24,251 with strong volume → Bearish bias activates, look for short opportunities targeting Last Intraday Support 24,162 and further toward Buyer's Support 24,032–24,055.
⚙️ Action Plan:
▫️ No Trade Zone = No Trade Action. Sit on hands till breakout/breakdown confirmed.
▫️ Use 15-min or 30-min candle close outside zone as trigger, not just wick/spike.
▫️ Avoid overtrading in this chop zone — this is where most retail traders lose money.
🔴 SCENARIO 3: GAP DOWN OPENING (100+ points, i.e., Open below ~24,140)
🔘 A gap-down of 100+ points brings price directly near or below Last Intraday Support (24,162), heading toward Buyer's Support Zone (24,032–24,055). This is a critical zone where buyers may step in.
• 🔴 If price opens below 24,162 and continues to fall with weak bounce, bearish momentum continues → Short bias favoured toward Buyer's Support 24,032–24,055.
• 🟢 If price finds support at 24,032–24,055 zone with reversal candle (hammer/bullish engulfing), this indicates buyers stepping in → Long opportunity for pullback toward 24,162 and possibly No Trade Zone.
• 🟠 If price hovers between 24,032–24,162 without clear direction, treat as consolidation — avoid fresh positions till breakout/breakdown confirmed.
⚙️ Action Plan:
▫️ Short Entry: Below 24,032 with SL above 24,055 → Target lower levels with trailing SL.
▫️ Long Entry (Reversal Play): Only after confirmation candle at 24,032–24,055 zone, SL below the zone low.
▫️ Do not catch falling knives — wait for confirmation candle before entering long from support.
🎯 OPTIONS TRADING – RISK MANAGEMENT TIPS
• 🔸 Always trade options with a predefined Stop Loss — never average a losing options position.
• 🔸 Avoid buying deep OTM options on gap-up/gap-down days — theta decay + IV crush can hurt even if direction is correct.
• 🔸 Position size should never exceed 2-3% of total capital per trade.
• 🔸 Prefer slightly ITM or ATM options for better delta and less time decay impact intraday.
• 🔸 Book partial profits at first target and trail SL for remaining quantity — protect gains.
• 🔸 Avoid trading in No Trade Zones — options premiums decay fast in sideways/choppy markets.
• 🔸 Keep an eye on India VIX — high VIX means wider stop losses needed, adjust position size accordingly.
• 🔸 Never hold overnight positions in weekly options without proper hedge, given theta risk.
📝 SUMMARY & CONCLUSION
Today's plan revolves around three key zones — No Trade Zone (24,251–24,317), Resistance Zone (24,464–24,510), and Support Zones (24,162 & 24,032–24,055).
✅ Gap-up opening → Watch resistance zone reaction for long/short bias.
✅ Flat opening → Stay out of No Trade Zone, wait for breakout/breakdown.
✅ Gap-down opening → Watch buyer's support zone for reversal or continuation.
Discipline and patience are more important than prediction. Let the market show its hand at key zones before committing capital. Risk management in options is what separates consistent traders from the rest. 📈📉
⚠️ DISCLAIMER
I am not a SEBI registered analyst. This post is purely for educational purposes to help learners understand price action and level-based trading concepts. Please consult your financial advisor before making any trading/investment decisions. Trading in the stock market and derivatives is subject to market risk. 🙏 Long 
XAUUSD — 4,035 Is the Reload Zone XAUUSD — 4,035 Is the Reload Zone
Gold is starting the week with that heavy feeling still sitting on the chart, almost like every bounce is being used to ask the same question: are buyers strong enough, or are they just giving sellers a better price?
Price is holding around the 4,000 area after a weak recovery from 3,982.995, but the bounce has not changed the bigger structure yet. The chart is still printing lower reactions, and the move into the Fibo zone around 4,020 - 4,040 looks more like a retracement than a real reversal. For newer traders, this is the part to slow down: when price drops hard, then climbs back into a 0.5 - 0.618 area without breaking structure, that zone can become a reload area for sellers.
That is why my main view is bearish while gold stays below 4,054.121. The wider pressure also supports that idea, with USD demand still firm as geopolitical tension keeps the market defensive. Gold may still bounce in small waves, but unless it can reclaim 4,054.121 and then push toward 4,072.676, the recovery looks limited.
The main smart money thesis here is simple: price may be breathing into the Fibo zone before hunting lower liquidity again. If sellers reject 4,020 - 4,040 and gold breaks below 3,982.995, the next downside magnet becomes 3,927.583.
This bearish idea becomes weak only if gold reclaims 4,054.121 cleanly and holds above it. A stronger invalidation would be price moving back into the order block and liquidity zone around 4,080 - 4,100.
Key price zones to watch
Current reaction area: 4,000 - 4,020
Main supply / Fibo reload zone: 4,020 - 4,040
Bearish confirmation zone: clean break below 3,982.995
First downside liquidity target: 3,960
Main downside target: 3,927.583
Upper resistance if sellers weaken: 4,054.121
Major order block + liquidity zone: 4,080 - 4,100
Invalidation: clean reclaim above 4,054.121, stronger above 4,100
Do you see this bounce as a real recovery attempt, or just a Fibo pullback before gold hunts 3,927?
Short 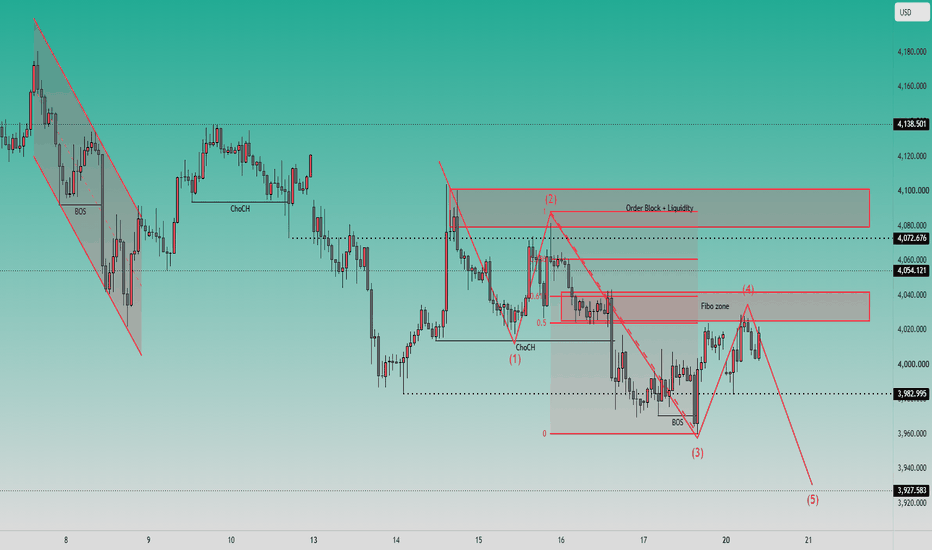
XAUUSD — Sell the 4,020–4,030 RetestFundamental Analysis
Gold remains sensitive to USD momentum, Treasury yields, and shifts in Fed rate expectations. Softer U.S. data could support a short-term recovery, but renewed dollar strength may keep the broader pressure tilted to the downside.
Technical Analysis
On the 1H chart, XAUUSD is trading near 4,004.55 below the marked 4,020–4,030 resistance zone. This area previously acted as support and may now become a sell zone after the breakdown. If price recovers into this region and fails to reclaim it, bearish continuation could target the strong support at 3,982.80 before extending toward the descending trendline near 3,925–3,930.
Important Key Levels
Current price: 4,004.55
Main sell zone: 4,020–4,030
Short-term support: 3,982.80
Short-term resistance: 4,020–4,030
Liquidity area: 4,090–4,108
Main target: 3,925–3,930
Invalidation: above 4,044.50
Trading Scenario
Main Sell Setup
Entry: 4,020–4,030
Stop Loss: 4,044.50
Take Profit 1: 3,982.80
Take Profit 2: 3,960
Take Profit 3: 3,925.80
Sell Condition
Wait for price to retest the 4,020–4,030 zone and show bearish rejection. A long upper wick, bearish engulfing candle, failed reclaim, or 1H close back below the zone may confirm seller pressure. If price breaks and holds above 4,044.50, the sell setup is no longer valid.
Overall View
The main bias remains bearish while XAUUSD stays below the former support zone and continues to respect the broader descending structure. The preferred plan is to wait for a recovery into 4,020–4,030 rather than chase price near current levels, with 3,982.80 as the first reaction area and 3,925.80 as the main downside target.
Do you also see 4,020–4,030 as the key sell zone, or are you waiting for a deeper liquidity sweep first? Short 
XAUUSD: Wave 5 bearish trend continues.Gold is still trading under short-term bearish pressure after failing to hold above the recovery trendline. From Kelly’s view, the current structure suggests that price may be preparing for another downside continuation, with wave 5 still open towards the lower Fibonacci target zones.
The key idea is simple: gold may retest resistance first, but the bearish structure remains valid while price stays below the sell zone.
⟡ Market structure
The chart shows gold attempted to recover from the lower area, but the rebound lost strength near the 4,020–4,030 region. Price is now trading around 4,004 and reacting below the broken uptrend line.
This is important because the trendline that previously supported the recovery is now acting as a retest area. If gold cannot reclaim this line with strength, the current bounce may only be a correction before the next bearish leg continues.
The nearest sell-test area is around 4,005–4,012, while the stronger sell zone wave 4 sits near 4,020–4,030. As long as these zones hold, sellers still have the technical advantage.
➤ Key levels
◌ 4,005–4,012: sell-test trendline zone
◌ 4,020–4,030: sell zone wave 4 and main resistance
◌ 4,004: current price reaction area
◌ 3,982: first buy scalping reaction level
◌ 3,959: next support checkpoint
◌ 3,938–3,945: Fibonacci 1.618 target area
◌ 3,855–3,865: possible wave 5 completion zone
◌ Above 4,030: area where the bearish setup starts to weaken
⌁ Elliott Wave view
From an Elliott Wave perspective, gold appears to be developing the final part of a bearish 5-wave sequence.
Wave 1 started the downside move after the recovery failed.
Wave 2 created a short rebound but could not break the structure.
Wave 3 pushed price lower with stronger selling pressure.
Wave 4 is now likely forming as a retest into the trendline and sell zone.
If this resistance holds, wave 5 may continue towards 3,938–3,945 first, then 3,855–3,865 if momentum expands.
This is why Kelly would not treat the current bounce as a bullish reversal yet. The market is still below the key resistance and the Elliott structure still supports one more downside leg.
▸ Trading scenario
Preferred scenario: wait for price to retest the sell-test trendline or the sell zone wave 4 and show bearish confirmation.
Sell zone: 4,005–4,030 if rejection appears
Stop loss: above the confirmed rejection high or above 4,030
Take profit 1: 3,982
Take profit 2: 3,959
Take profit 3: 3,938–3,945
Take profit 4: 3,855–3,865 if wave 5 extends strongly
Alternative scenario: if gold breaks above 4,030 and holds with strong acceptance, the bearish wave 5 setup weakens. In that case, price may move into a larger corrective recovery before the next direction becomes clear.
⌁ Kelly’s view
For Kelly, this is still a sell-the-retest structure. Gold has not fully reversed yet, and the current reaction is happening under the broken trendline and wave 4 resistance.
The cleaner plan is to wait for confirmation near resistance, not chase price while it is already close to support.
Gold remains vulnerable below the sell zone.
If sellers defend 4,005–4,030, wave 5 may continue towards the Fibonacci targets below.
Share your view below. Short 
 Long
Long