RELIANCE: Falling Wedge Bullish Reversal at Strong Support ₹1469Technical Analysis
Pattern Formation : The 1-Day chart of Reliance Industries Limited (RELIANCE) displays a multi-month Falling Wedge pattern. Lower highs and lower lows are gradually narrowing toward a technical apex, indicating seller exhaustion.
Support Zone: Price action is testing a major Strong Support Area around ₹1,200 – ₹1,210. This zone aligns with past macro swing lows and includes a recorded False Breakout / Liquidity Sweep (under ₹1,200), signaling strong institutional buying defense.
Accumulation / Spring: The chart highlights a rounded accumulation curve (green shade) emerging from the lower trendline of the wedge, forming a potential "spring" structure near the ₹1,200 zone.
Resistance & Targets:
Immediate Resistance: ₹1,372 (Intermediate Horizontal Resistance Band).
Primary Target: ₹1,469 (Upper Resistance Zone / Measured Move Target).
Fundamental Drivers
Energy & Petrochemicals: Stable refining margins and expansion into green energy initiatives (solar, hydrogen, and gigafactories) provide long-term balance sheet stability.
Consumer Businesses (Retail & Telecom): Steady ARPU growth in Jio Platforms alongside consistent revenue expansion in Reliance Retail continue to drive core earnings growth.
Balance Sheet Flexibility: Strong institutional capital access and investment grade ratings maintain defensive strength despite broader market volatility.
Trading Idea Summary
Current Price: ₹1,244.00
Accumulation Zone: ₹1,210 – ₹1,240
Stop Loss: Below ₹1,195 (daily candle close)
Target 1: ₹1,372.40
Target 2: ₹1,469.50
Risk-to-Reward: 1:3.5+
Disclaimer
This post is for educational and informational purposes only and does not constitute financial or investment advice. Technical chart patterns and fundamental data are subject to market risks. Please perform your own research or consult a certified financial advisor before making any trading decisions.
 Long
Long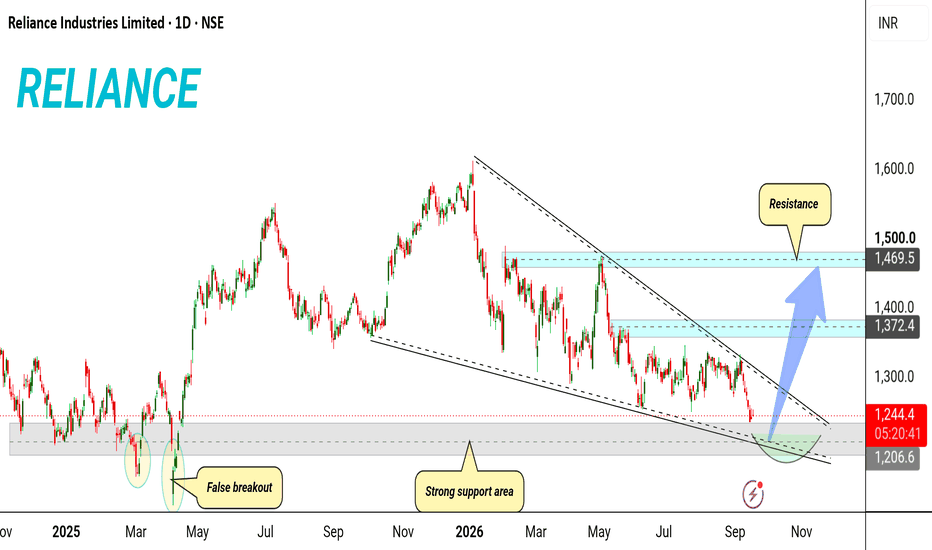
The Market Broke The RuleFor years, traders have been taught a simple relationship: rising yields are bad for equities. Higher borrowing costs increase the discount rate applied to future earnings, financial conditions become tighter, and expensive growth assets can come under pressure. The relationship is real, but treating it as a mechanical rule is where the analysis starts to break down.
The recent market reaction provides a useful case study. U.S. Treasury yields moved sharply higher as inflation concerns, rising oil prices and changing expectations around monetary policy pushed the 10-year yield close to the 5% level. Yet equities were still able to rally rather than simply following the textbook relationship. That apparent contradiction is where the more interesting market analysis begins.
The Market Doesn't Trade One Variable in Isolation.
A higher yield can create pressure on equities, but the market is constantly weighing that pressure against everything else happening at the same time. Inflation expectations, economic growth, earnings expectations, oil prices, liquidity, positioning and expectations for central-bank policy can all influence the final reaction.
In this case, the inflation data did not deliver the kind of upside surprise investors had feared. Treasury yields pulled back from their highs, while equities responded positively as some of the immediate policy concerns eased. The important point is not that yields suddenly stopped mattering. It is that the market was responding to the entire change in expectations rather than simply reacting to the direction of one chart.
This Is Why Correlations Are Not Rules.
A relationship between two assets can be statistically meaningful without producing the same reaction every single time. When the dominant driver changes, the relationship can weaken, reverse or temporarily disappear.
If yields rise because growth expectations are improving, the market may interpret that very differently from a rise caused by accelerating inflation or fiscal concerns. The same percentage-point move in yields can therefore carry a completely different message depending on what is driving it.
Context Changes the Meaning of Price.
This is one of the most important distinctions between watching markets and actually analysing them. A trader who only sees “yields up” may immediately expect stocks to fall. A trader looking at the broader picture asks why yields are rising, what the market expected beforehand, what is happening to inflation, how oil is behaving, and whether equity earnings expectations are changing at the same time.
The direction of a variable matters. But the reason behind that direction often matters more.
The Rule Wasn't Really Broken.
The mistake was treating a relationship as a law.
Markets are interconnected, but they are not mechanical. The same input can produce different outcomes when the surrounding conditions change. That is why experienced market analysis focuses less on memorising relationships and more on understanding the forces competing to move price.
The next time you see a familiar correlation appear to fail, don't immediately assume the market is irrational. Start with a better question: what changed in the information the market is pricing?
Sometimes the market isn't breaking the rule.
We're just looking at the wrong rule.  Education
ORCHID PHARMA (NSE) — BULLISH BREAKOUTChart: 1D | Orchid Pharma Limited | CMP: ₹1,024.9 (+6.11%) (Dated 09.09.2026)
Setup:
Orchid Pharma rallied sharply from the ₹500 zone earlier this year to touch highs near ₹1,133, after which it entered a tightening consolidation — forming a symmetrical/descending triangle pattern.
Key Levels:
Demand Zone: ₹960 – ₹1,025 (expected retracement/reaction area)
Stop Loss (SL): ₹875 (below demand zone — invalidates setup)
Target 1 (T1): ₹1,250
Trailing Stop Target (TSL): ₹1,370
Risk-Reward:
Entry near demand zone (~₹1,000) with SL at ₹875 gives a risk of ~₹125. Target 1 at ₹1,250 offers a reward of ~₹250 (~2:1 R:R), with TSL extension toward ₹1,370 for trend-followers.
Invalidation:
A daily close below ₹875 would invalidate the bullish structure and suggest deeper correction.
Not financial advice — for educational/idea-sharing purposes only. Please do your own due diligence before trading.
POLYCAB | Rectangle Breakout→Rising Wedge→Breakdown in ProgressOverview
POLYCAB has completed a textbook three-phase technical sequence on the Daily chart — a long-term Rectangle base, followed by a powerful breakout rally, and now a Rising Wedge breakdown that appears to be unfolding in real time.
Phase 1 — Rectangle Base (May 2024 to October 2025)
For approximately 17 months, POLYCAB consolidated inside a well-defined Rectangle pattern between roughly ₹4,500 and ₹7,700. Price tested both boundaries multiple times — classic accumulation behaviour with neither buyers nor sellers in full control.
Phase 2 — Rectangle Breakout & Rally
In October 2025, price broke out of the upper boundary of the Rectangle decisively. This triggered a powerful rally from the ₹7,700 breakout zone all the way to a high of ₹10,126 — a move of approximately 2,400 points or 31% from the breakout level.
During this rally phase, a Rising Wedge formed — two upward-sloping converging lines compressing price into a tightening structure.
Phase 3 — Rising Wedge Breakdown (Now)
The Rising Wedge is a bearish reversal pattern. Price tagged the wedge high at ₹10,126 and has since reversed sharply, breaking below the lower wedge boundary. Current price at ₹9,531 confirms the breakdown is in progress.
This is the most critical phase to watch right now.
Key Support Levels to Watch
🟢 Top Support — 9,294
🟢 Second Support — 8,794
🟢 Third Support — 8,294
🟢 Bottom Support — 7,737 (Rectangle breakout retest zone)
Each level represents a potential area where buyers may step in. The most important is ₹7,737 — the original rectangle breakout level. If price reaches here and holds, it would be a classic breakout retest — a strong buy zone for long-term traders.
Two Scenarios Going Forward
🔴 Scenario A — Wedge Breakdown Continues
Price continues declining through support levels toward ₹8,794 and ₹8,294. Watch for volume confirmation on each break. Ultimate target of the wedge breakdown measured from the wedge height points toward the ₹7,737 breakout zone.
🟢 Scenario B — Support Hold & Recovery
Price finds support at ₹9,294 and reclaims the wedge lower boundary. This would invalidate the breakdown and signal buyers are defending the structure. A close back above ₹9,750 would be the first confirmation.
What This Setup Teaches
After a strong breakout from a long base, markets often form a secondary pattern during the rally phase. A Rising Wedge within a bullish trend is a warning sign — it shows momentum weakening even as price makes higher highs.
The lesson: breakouts don't always go straight up. Patterns within the rally phase deserve equal attention.
Conclusion
POLYCAB has delivered a complete three-phase technical sequence. The Rectangle base gave the foundation. The breakout gave the rally. The Rising Wedge is now signalling a potential correction phase.
Watch the support levels closely — each one tells the next chapter of this story.
For educational purposes only. Not financial advice. Always manage your risk.  Short
Short
RELIANCE — Falling Wedge at the Apex, Yearly L4 Reclaimed Eight months of grinding lower since that January top near 1,600, and the whole thing has drawn itself into a textbook falling wedge. The range has squeezed from roughly 290 points down to about 95. We are at the apex. Something has to give. ⏳
🎯 The pivot story just got better. With the full yearly CPR on the chart, price has been trading below the entire 2026 value area all year. TC sits at 1,496.3, P at 1,422.2, BC at 1,348.1. Below that, L4 at 1,313.9 broke in February and capped the stock for six months. Today price is back above it at 1,326.4.
🔗 And look at the cluster overhead. Upper wedge rail, Weekly High at 1,345.9, and yearly BC at 1,348.1 are all sitting within three points of each other. Three separate frameworks stacked on one number. Clearing it does not just break a wedge, it puts price back inside the yearly value area for the first time since January. Downside is just as clean: Weekly Low 1,249.8 rests on the lower rail.
📈 Volume, now that it is on: participation dried up steadily through the wedge, which is exactly what you want to see into an apex. Today's bar is already running warm with most of the session still ahead. That is a hint, not a confirmation. The bar that matters is the breakout candle itself, and it needs to close above the recent average or the whole thing is suspect.
📉 RSI: February to June gave a lower low in price against a higher low in RSI, roughly 29 up to 39. Four months of quiet divergence. RSI is now leaning on its own falling trendline from May around 53 to 55, holding above the midline through the base.
🚀 Long trigger: daily close above 1,348. One candle breaks the wedge, takes the weekly high, reclaims yearly BC and snaps the RSI trendline together.
🎯 Targets: 1,422 (yearly P), then 1,496 (TC), then 1,564 (CP), and the measured move lands almost exactly on yearly H5 at 1,627.5. That last one is a nice piece of geometry.
🛑 Invalidation: daily close below 1,250. Reopens the 1,200 handle.
😴 In between? Nothing. The apex is a coin flip by design. Trade the break, not the boredom.
⚠️ Earnings land inside the breakout window, so size for a gap.
Educational analysis, not investment advice. Manage your own risk. 🙏 Long 
NIFTY Sellers Take Control After the Doji, Testing the 50 (W)EMAOverview
Nifty closed the week at 24,366, down 204.65 points or 0.83%. This follows directly from last week's doji at resistance, and the answer to "which side wins" has come in: sellers took control this week, with price rejecting from a high of 24,620.95 and closing near the Weekly 50 EMA (24,358.08).
Follow-up on Last Week's View
Last week we flagged a doji forming right at the resistance zone (24,601–24,989), a classic sign of indecision after a multi-week rally, with the next 1-2 candles expected to confirm direction. That confirmation has now arrived. Price failed to clear last week's high (24,774.30), and this week's red candle closed well below it, right on top of the Weekly 50 EMA. The Rising Wedge structure we've been tracking remains intact, and this week's price action leans toward the bearish resolution of that pattern.
Pattern Explanation
Nifty is now sitting almost exactly on the Weekly 50 EMA (24,358), a genuine make-or-break zone. Below this, the rising trendline support and Support 1 (23,817.80) are the next levels in line. The falling wedge resistance line above continues to cap every rally attempt, reinforcing the cautious read from last week.
Key Levels
Resistance Zone: 24,601.70–24,989.35
Weekly 50 EMA (current test zone): 24,358.08
Support 1: 23,817.80
Support 2 (Trendline): 23,611.00
Major Support: 23,070.15
Weekly 200 EMA: 22,291.99 (long-term trend remains up)
Scenarios
If Nifty closes next week below the 50 EMA (24,358), it would confirm sellers are in control, and price could slide toward the rising trendline support and 23,817–23,611 zone.
If Nifty reclaims 24,620 (this week's high) with strength, it would suggest the pullback was shallow, and buyers could make another attempt at the 24,774–24,989 resistance zone.
Beginner's Lesson
A doji at resistance is a warning sign, not a guarantee, and this week is a good example of why we wait for the next candle rather than acting on the doji alone. Once the follow-through candle closes clearly in one direction, especially a strong red candle like this week's, it adds real weight to the case that sellers have taken the upper hand, at least for now. The 50 EMA test that follows is the next confirmation point to watch.
Conclusion
Nifty's doji hesitation resolved bearish this week, with price now testing the Weekly 50 EMA directly. A close below this zone would tilt the bias toward the rising trendline support near 23,817–23,611. A recovery back above 24,620 would keep the broader uptrend structure alive. This remains a level-to-level market, with the current test at the 50 EMA the key thing to watch into next week.
This is for educational purposes only and not investment advice. Please do your own research or consult a financial advisor before making any trading decisions. NIFTY Weekly View — Weekly Support Holds at 24,025Overview
Nifty closed the week at 24,252.00, down 114 points or 0.47%, extending last week's bearish follow-through. Price dipped to test Weekly Support near 24,025 and closed well above it by week's end.
Follow-up on Last Week's View
Last week we flagged sellers taking control after the doji at resistance, with price testing the Weekly 50 EMA (24,358) as the key level. That test resolved bearish, price closed below the 50 EMA this week, confirming sellers had the upper hand. This week, that follow-through carried price down to test the next major support level.
Pattern Explanation
This week's low of 24,025.65 tested the Weekly Support level (24,025) almost exactly, and price recovered to close at 24,252, well above the low. The Rising Wedge structure we've been tracking remains intact, with the falling dotted resistance line above continuing to cap rallies. Resistance 1 (24,360, near the Weekly 50 EMA) and Resistance 2 (24,601.70) remain the levels to reclaim for any bullish case to build. The rising Trendline Support below is also gradually approaching current price levels and will be an important zone to watch in the coming weeks.
Key Levels
Resistance 2: 24,601.70
Resistance 1 / Weekly 50 EMA: 24,360 / 24,353.66
Weekly Support: 24,025
Support 2: 23,818.00
Support 3 (Trendline): 23,611.00
Major Support: 23,070.15
Scenarios
Bullish: If Nifty holds above Weekly Support (24,025) and reclaims 24,360 (Resistance 1 / 50 EMA) with strength, it would suggest the pullback is done, opening the door for another attempt at 24,601 and the wedge resistance above.
Bearish: If Nifty comes back down and closes below 24,025, it would be a meaningful break, and price could slide toward Support 2 (23,818) and Support 3 (23,611).
Beginner's Lesson
A well-established support level, like the one tested this week, often holds on its first few tests, especially if it's been respected before. Price dipping into a support zone and closing back above it by the end of the week is a healthy sign, it shows buyers stepped in exactly where expected. Watching whether this level continues to hold on future tests, especially as other levels like trendlines converge nearby, gives a clearer picture of how strong the support really is.
Conclusion
Nifty tested and held Weekly Support at 24,025 this week. Holding this zone with a reclaim of 24,360 would favor buyers again. A future close below 24,025 would tilt the bias bearish toward 23,818 and 23,611. This remains a level-to-level market, with this week's successful support test being an encouraging sign for the bulls, at least for now.
This is for educational purposes only and not investment advice. Please do your own research or consult a financial advisor before making any trading decisions. BEL — Falling Wedge Testing Apex, Bullish SetupOverview
Bharat Electronics is trading at 410.80, up 0.07%, testing the apex of a falling wedge that has formed since the May high of 464.40. Price recently bounced off Major Support at 382 and has climbed back up to test the wedge's converging trendlines, right at the 50 EMA (407.93) and 200 EMA (409.88) cluster.
Pattern Explanation
Since the May high, the stock has made lower highs and lower lows within two converging trendlines, the hallmark of a falling wedge. Price recently tested the wedge support and Major Support zone (382) together, holding just above the Invalidation level (380), before bouncing back up to test the wedge's upper boundary, where it now also runs into the 50 and 200 EMA cluster. This confluence of wedge resistance and EMA resistance makes the current zone an important test.
Trade Setup
Entry: Buy on every dip near current levels and closer to the 407–410 EMA cluster support
Stop Loss / Invalidation: 380 (below Major Support)
Target 1: 424
Target 2: 435
Key Levels
Wedge Resistance + EMA Cluster: 408–411
Major Support: 382
Invalidation: 380
Target 1: 424
Target 2: 435
Beginner's Lesson
When a falling wedge's resistance line lines up closely with key moving averages, like the 50 and 200 EMA here, it creates a stronger resistance zone than either alone. A breakout through this kind of confluence zone, with a clean close above it, carries more weight than breaking a single trendline in isolation, since it means price has cleared multiple layers of overhead pressure at once. In setups like this, buying on dips toward support rather than chasing strength can offer a better entry, as long as the broader structure stays intact.
Conclusion
BEL is testing an important confluence zone at the wedge apex and EMA cluster. Buying on dips within this zone, with a close above 411 confirming strength, would support the bullish case toward 424 and 435. A slip below 380 would invalidate this setup.
This is for educational purposes only and not investment advice. Please do your own research or consult a financial advisor before making any trading decisions.  Long
Long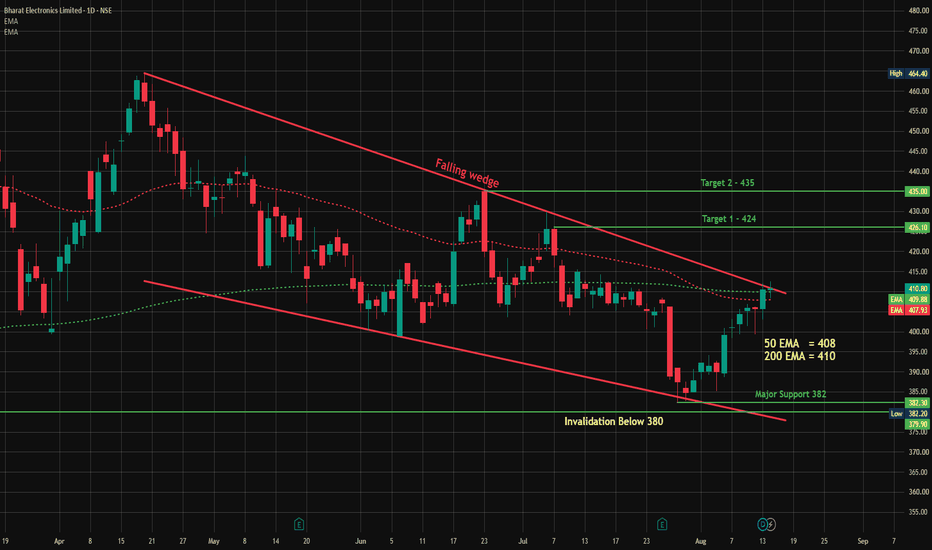
Gold Under Hyper-Contraction Just Before a Major ExpansionProbable Scenario Analysis:
⏺ Present Scenario:
Presently, Gold TVC:GOLD is in a hyper-contraction phase. There are two visible contraction chart patterns observable in the chart. The first pattern is a head-and-shoulder (H&S) pattern. The second pattern is a rising parallel channel. Technically, gold is flat and making too random moves. There is no trend confirmation yet.
🟢 Bullish Scenario
There is no bullish scenario. Doubt every upmove. However, if the price decisively sustains above 4425, then a bullish setup might emerge. The probable bullish target above 4425 would be - 4450.
🔴 Bearish Scenario
Gold has entered into the shorting zone. If we look at the rising parallel channel, we can see that the price is trading within the lower control limit (LCL) of the channel. It is a sign of weakness. Also, there is a probable formation of an H&S pattern. Stay bearish below 4400. The probable targets below 4400 would be - 4375, 4350, 4325, and 4300.
🟡 No Trading Zone: (4425 - 4400).
● Intraday, Weekly, and Monthly Bias
Establish bias with respect to the opening price (of the particular session - Intraday, Weekly, and Monthly). If the price sustains above the opening price, then don't think of shorting. Look for bullish trades only. On the contrary, if the price sustains below the opening price, then don't think of going long. Look for bearish trades in that case.
● Disclaimer + End Note
- All the analyses would fail in the case of a major gap up, gap down, or price structure anomaly. Thus, practice PRAGMATISM in the live session.
- Trade only if there is a set-up. Remember, not trading is an extension of the trading activity.
- Mark your points. Trade your points. Price is GOD. Anything can happen in the markets. Thus, trade what you see, not what you believe.
- Always PRACTICE RISK MANAGEMENT. Always PROTECT YOUR CAPITAL. Be RESPONSIBLE.
- Be Strategic. Be Courageous. Be Patient. Be Wise.
- Every day is a new day. Thus, do not carry the baggage of past successes or failures. Leave the gardens of winning and losing. Establish yourself in equanimity. Always think from a new perspective.
- Let the joy of trading drive your effectiveness, not greed or fear. Believe in Possibilities.
Happy Trading! BSE Ltd — Bouncing from 0.786 Fib Support, Fresh Bullish SetupOverview
BSE closed today at 3,596.1, up 4.02%, a strong bounce after finding support near the 0.786 Fib level (3,334.6) that we flagged as the next zone to watch in our last update. This bounce has brought price back up toward the falling wedge's upper trendline, and it's worth tracking as a fresh setup.
Follow-up Context
In our earlier post, we noted the 0.618 Fib + wedge zone (3,570–3,610) had failed to hold, and price fell through to the 0.786 Fib level. That level has now given the bounce we were watching for, with today's strong green candle confirming buyer interest at this support.
Pattern Explanation
Price has been falling in a wedge shape since the May high of 4,446.8, with both trendlines sloping down but converging. A falling wedge, like this one, is generally a bullish reversal pattern once broken decisively to the upside. Price is now testing the wedge's upper boundary again after bouncing off deep Fib support, an important test to confirm whether this bounce has real strength behind it.
Today's bounce also came on strong volume, 6.34M shares traded versus the 20-day average of 2.94M, roughly double the usual activity. That kind of volume pickup on a reversal day suggests real buying interest stepped in at this support zone, rather than just a quiet drift higher.
Trade Setup
Entry: Buy on strength above 3,600, ideally with confirmation of a close above the wedge's upper trendline
Stop Loss / Invalidation: 3,334 (below the 0.786 Fib support, would negate this bullish setup)
Target 1: 3,739 (0.5 Fib)
Target 2: 3,906 (0.382 Fib)
Key Levels
Support (Invalidation): 3,334.6 (0.786 Fib)
Wedge Resistance: ~3,600–3,650
Target 1: 3,739
Target 2: 3,906
50 EMA: 3,684.8
200 EMA: 3,261.0
Beginner's Lesson
After a sharp fall, the first bounce off a deep support level doesn't automatically mean the downtrend is over. What matters is whether the bounce can clear the resistance zone above it (here, the wedge's upper trendline) with real strength. Volume helps here too, a bounce on strong volume, like today's, carries more weight than one on light, half-hearted buying. If the bounce fails and price falls back below the recent support, it was likely just a pause within the bigger downtrend, not a reversal.
Conclusion
BSE is showing a strong, volume-backed bounce off the 0.786 Fib support and is now testing the falling wedge's upper boundary. A clean close above this zone would support further upside toward 3,739 and 3,906. A slip back below 3,334 would invalidate this bullish setup.
This is for educational purposes only and not investment advice. Please do your own research or consult a financial advisor before making any trading decisions.  Long
Long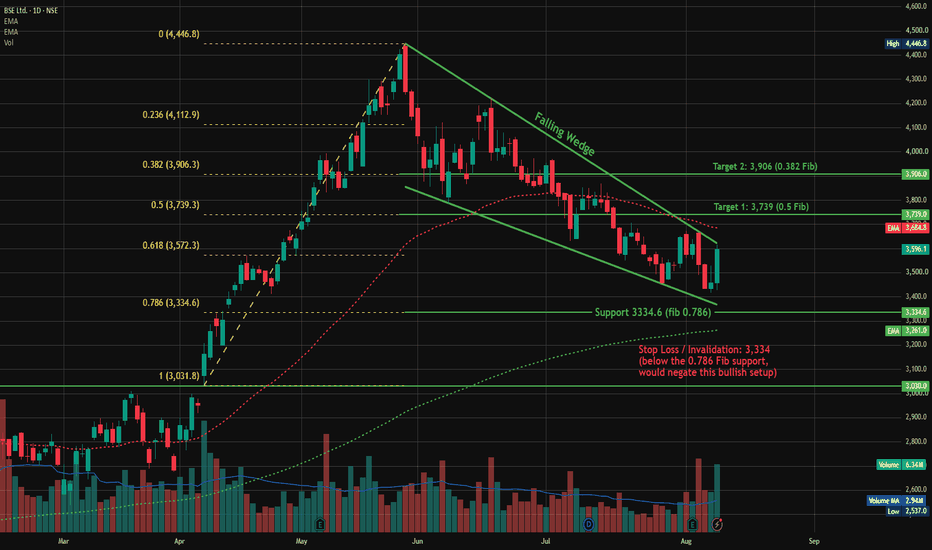
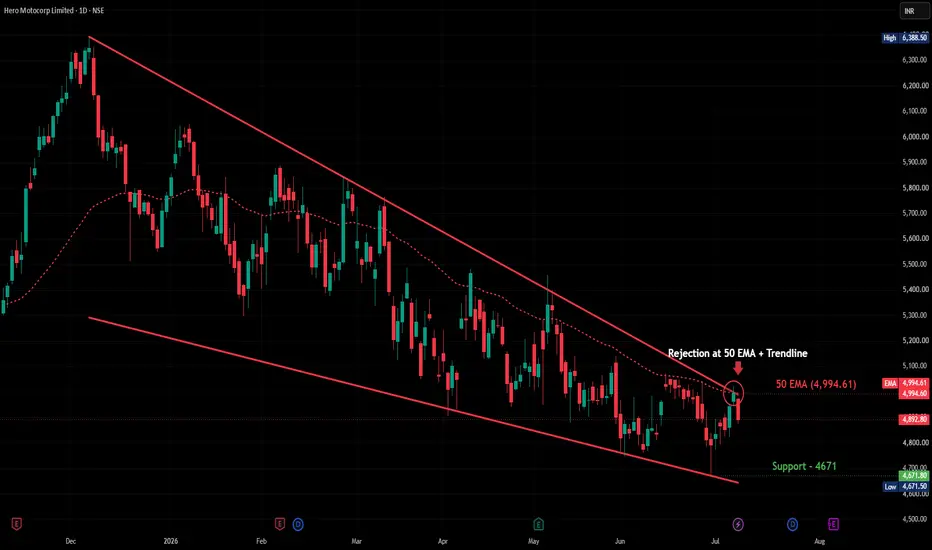
HEROMOTOCO — Falling Wedge Resistance Holds at the 50 EMAOverview
Hero MotoCorp attempted to break above its falling wedge resistance today, touching a high of 4,975 before reversing sharply to close down 2.05% at 4,892.80. Notably, this rejection occurred right at the 50 EMA (4,994.61), which has been tracking closely with the wedge's upper boundary — a double layer of resistance that proved difficult to clear on the first attempt.
Pattern Explanation
The stock has been compressing inside a falling wedge since the December high of 6,388.50, with the upper resistance trendline and the 50 EMA converging in the same zone through recent sessions. This kind of confluence — a structural trendline lining up with a widely-watched moving average — often makes for a tougher resistance to clear cleanly, and today's rejection candle reflects exactly that dynamic. Sellers stepped in decisively at this zone rather than letting price consolidate above it.
Key Levels
Resistance (Wedge Trendline + 50 EMA Confluence): 4,975–5,000
Support (Wedge Lower Boundary): tracking near 4,750–4,800 currently
Prior Swing Support: 4,671.50
Scenarios
If support holds: A pullback that stabilizes above the wedge's rising support line and the recent low near 4,671 keeps the pattern intact, setting up a possible second attempt at the 50 EMA and resistance trendline later.
If support breaks: A sustained close below the wedge's lower boundary would suggest sellers are back in control, with the pattern breaking down rather than resolving bullishly.
Beginner's Lesson
When a trendline and a moving average line up in the same price zone, it often creates a stronger resistance than either would on its own — this is called confluence. A single rejection at such a zone isn't necessarily bearish for the bigger picture, but it does tell you buyers need to work harder to clear it. Watching whether the stock holds its rising support on this pullback will say a lot about whether the next attempt has a better chance.
Conclusion
Hero MotoCorp's rejection at the 50 EMA and wedge resistance keeps the stock range-bound for now. Worth tracking how the pullback behaves relative to the wedge's support line before expecting another test of resistance. As always, wait for confirmation before drawing conclusions.
Not investment advice. For educational purposes only. Please consult your financial advisor before making any trading decisions. TVSMOTOR Rising Wedge Recovery Strong Q1 FY27 Earnings📊 TVS Motor Company: Daily Technical Snapshot – Rising Wedge Recovery & Strong Q1 FY27 Earnings
📊 STWP Technical Analysis
________________________________________
MARKET STRUCTURE SNAPSHOT | NSE: TVSMOTOR | DAILY
Closing Price: 3,792.00 (+201.80 | +5.62%)
Core Trend: Strong Uptrend
Market State: Recovery Within Uptrend
Price Structure: Price has rebounded strongly after forming a Bullish Engulfing near the rising support trendline and is now attempting to break above the descending resistance of a Rising Wedge consolidation. The recovery is supported by improving momentum, healthy volume participation and strong quarterly earnings.
________________________________________
OPERATIONAL PRICE GRID & KEY REFERENCE LEVELS
Model Reference Level: 3,810.00
Hard Invalidation Level: 3,260.70
Structural Risk: 549.30 (14.42%)
Resistance Levels: R1 3,875.73 | R2 3,959.47 | R3 4,108.93
Support Levels: S1 3,642.53 | S2 3,493.07 | S3 3,409.33
Range Structure: Low 3,260.70 | High 4,108.93
Higher Timeframe Observation Zones: 3,960 | 4,109 | 4,250
________________________________________
🏢 BUSINESS & FUNDAMENTAL UPDATE
TVS Motor reported a strong Q1 FY27 performance, exceeding market expectations across revenue, profitability and margins. Standalone revenue increased 38% YoY to 13,896 crore, while net profit rose 51% YoY to a record 1,174 crore. EBITDA grew 41%, with margins expanding to 12.8%, despite concerns over rising input costs and a higher EV mix. The company also recorded its highest-ever quarterly vehicle sales of 1.63 million units, driven by robust growth across motorcycles, scooters, exports and electric vehicles, with EV sales surging 86% YoY. The Board also declared plans to raise up to 1,000 crore through debt instruments. The stronger-than-expected earnings, improving margins and record sales provided a positive fundamental backdrop to the stock's ongoing technical recovery and trendline breakout attempt.
________________________________________
⚠️ MOMENTUM, PARTICIPATION & CPR DATA
Volume Profile: 2.39 Million Shares
Volume Character: Strong Relative Participation
RSI: 65.36 (Strong Momentum Zone)
ADX: 18.85 (Trend Strength Improving)
ROC: +2.14%
MACD Status: Fresh Bullish Crossover
CCI: +127.60 (Positive Momentum)
Stochastic Reading: 93.64 (Extended Momentum Zone)
Current Bias: BUY ON PULLBACKS AFTER BREAKOUT CONFIRMATION
CPR State: Bullish Zone | CPR Moving Down (Narrow)
Today's CPR: Pivot 3,586.70 | Top 3,588.40 | Base 3,584.90
Tomorrow's CPR (Projected): Pivot 3,726.30 | Top 3,759.10 | Base 3,693.40
________________________________________
📚 EDUCATIONAL OBSERVATION
TVS Motor has staged a strong recovery after forming a Bullish Engulfing candlestick near the lower boundary of its rising support trendline. The stock is now testing the upper boundary of a Rising Wedge consolidation, signalling that buyers have regained control following a brief corrective phase. The recent price action indicates that selling pressure has gradually weakened while demand has improved near key support levels. The strong bullish candle, combined with improving momentum indicators, reflects renewed buying interest. However, the trendline breakout is still in progress, and confirmation would require sustained trading above the wedge resistance, preferably supported by stronger-than-average trading volume.
Momentum indicators continue to improve. The RSI at 65.36 reflects healthy bullish momentum without entering an extreme overbought zone. MACD has generated a fresh bullish crossover, suggesting strengthening upside momentum, while the ROC of +2.14% indicates improving price acceleration. The CCI reading of +127.60 confirms positive buying momentum, and the Stochastic reading of 93.64 highlights sustained participation. While momentum remains constructive, elevated readings may also result in short-term consolidations after a sharp advance. The projected Central Pivot Range (CPR) for the next trading session has shifted higher, with the projected Pivot at 3,726.30. A higher CPR reflects improving market acceptance of higher prices and supports the prevailing bullish structure as long as prices remain above key support levels. Immediate attention remains focused on the resistance zone between 3,876 and 3,959, which also coincides with the upper boundary of the Rising Wedge. A decisive close above this region, supported by improving participation, would confirm the breakout and could shift attention towards the higher-timeframe observation zones near 4,109 and 4,250. On the downside, 3,643 remains the first important support, while the structural invalidation level is positioned near 3,261.
________________________________________
📖 Educational Note
The combination of strong quarterly earnings, record vehicle sales, margin expansion, and a technical recovery within a Rising Wedge provides a constructive backdrop for the stock. However, from a technical perspective, the current setup will be considered fully confirmed only if price sustains above the wedge resistance with continued participation. Support and resistance levels should be treated as observation zones rather than predictive targets. Technical analysis and financial results are educational tools that help investors evaluate market structure and business performance within a disciplined risk-management framework.
________________________________________
Disclaimer
This analysis is provided strictly for educational and informational purposes.
It does not constitute financial, investment or trading advice and should not be interpreted as a recommendation to buy or sell any security. Investments in the stock market are subject to market risks, including the possible loss of capital. Historical performance, financial results, chart patterns and technical indicators do not guarantee future outcomes. Please conduct your own research and consult a SEBI-registered investment adviser before making investment decisions. STWP assumes no responsibility or liability for any financial loss arising directly or indirectly from the use of this analysis.
 Long
Long
BSE Ltd — Pulling Back Hard, Watching the 0.618 Fib + Wedge ZoneOverview
BSE has had a strong run since April, but today it's seeing a sharp fall (currently down 2.11%, trading around 3,607). This drop has brought price right into an important zone — where an old Fibonacci level and a wedge pattern are meeting. Let's break down what we're watching.
What's Happening
Price rallied hard from 3,031 all the way to a high of 4,446 in just a couple of months. That's a big move, so some pullback is normal. Since then, price has been falling in a wedge shape (marked in red), and today's fall has pushed it right down to the 0.618 Fib level around 3,572.
Right now, price is trading between its two EMAs — below the 50 EMA (3,800) but still above the 200 EMA (3,209). This tells us the bigger uptrend isn't broken, but the stock is definitely cooling off hard after its big run.
Key Levels to Watch
Zone to Watch: 3,570–3,610 (0.618 Fib + wedge support meeting here)
If this zone breaks: next level is 0.786 Fib at 3,334
If price bounces from here: first hurdle above is 0.5 Fib at 3,739, then 0.382 Fib at 3,906
Bigger picture support: 200 EMA around 3,209
Since the Market Is Still Open Today
This is based on where price is trading right now, not a closed candle. Since we're mid-session, wait for the close today (or even a session or two more) before treating this zone as confirmed support or a broken level.
Two Ways This Can Go
If the zone holds: A bounce from here, especially with a strong green candle, would be a good sign buyers are stepping back in. Watch for price to reclaim 3,739 next.
If the zone breaks: A close well below 3,570 today or tomorrow would mean sellers are still in control, and 3,334 becomes the next zone to watch.
Beginner's Lesson
When a stock falls sharply after a big rally, it's easy to panic or get excited too early. The smart move is to mark the zone where multiple signals line up (like we did here with the Fib level and wedge), and then simply wait. Let price show you what it wants to do, rather than guessing in the middle of a sharp move.
Conclusion
BSE is testing an important zone today after a strong rally. As always, we prefer to wait for confirmation rather than jumping in mid-fall. We'll keep watching and post an update once this plays out.
For educational purposes only. Not financial advice. Always manage your risk.  Long
Long
HCLTECH Falling Wedge Breakout After Strong Q1 FY27 Results📊 HCL Technologies: Daily Technical Snapshot – Falling Wedge Breakout After Strong Q1 FY27 Results
📊 STWP Technical Analysis
________________________________________
MARKET STRUCTURE SNAPSHOT | NSE: HCLTECH | DAILY
Closing Price: 1,221.20 (+57.10 | +4.91%)
Core Trend: Recovery within Long-Term Uptrend
Market State: Confirmed Falling Wedge Breakout
Price Structure: Price has broken above a multi-month Falling Wedge, supported by a strong bullish breakout candle and significantly higher trading volume. The breakout signals weakening selling pressure and improving buyer conviction.
________________________________________
OPERATIONAL PRICE GRID & KEY REFERENCE LEVELS
Model Reference Level: 1,237.00
Hard Invalidation Level: 1,119.00
Structural Risk: 118.00 (9.54%)
Resistance Levels: R1 1,251.47 | R2 1,281.73 | R3 1,326.47
Support Levels: S1 1,176.47 | S2 1,131.73 | S3 1,101.47
Range Structure: Low 1,119.00 | High 1,326.47
Higher Timeframe Observation Zones: 1,355.00 | 1,472.95
________________________________________
MOMENTUM, PARTICIPATION & CPR DATA
Volume Profile: 9.03 Million Shares
Volume Character: Very High Relative Participation
RSI: 62.89 (Strong Momentum Zone)
ADX: 14.20 (Early Trend Development Phase)
ROC: +10.78%
MACD Status: Fresh Bullish Momentum Structure
CCI: +174.99 (Strong Bullish Momentum)
Stochastic Reading: 92.37 (Extended Momentum Zone)
Current Bias: BUY ON PULLBACKS
CPR State: Bullish Zone | CPR Moving Up (Wide)
Today's CPR: Pivot 1,169.70 | Top 1,166.90 | Base 1,172.50
Tomorrow's CPR (Projected): Pivot 1,206.75 | Top 1,213.95 | Base 1,199.50
________________________________________
📚 EDUCATIONAL OBSERVATION
HCL Technologies has confirmed a breakout from a multi-month Falling Wedge, a chart pattern widely regarded as a bullish reversal formation that often develops after an extended corrective phase. The breakout is supported by a strong bullish candle, improving momentum indicators and significantly higher trading volume, reflecting renewed buying interest and strengthening market participation.
A Falling Wedge forms as prices create progressively lower highs and lower lows within converging trendlines. As the pattern matures, selling pressure gradually weakens while buyers begin accumulating at lower levels. A decisive breakout above the upper boundary often signals that the corrective phase may be ending and that a fresh upward trend could be developing.
Momentum indicators continue to support the improving technical structure. The RSI at 62.89 reflects healthy bullish momentum without entering an extreme overbought zone. MACD has generated a fresh bullish crossover, indicating strengthening upside momentum, while the ROC of +10.78% highlights strong price acceleration. The CCI reading of +174.99 confirms robust buying pressure, and the Stochastic reading of 92.37 reflects sustained momentum, although elevated readings also suggest that short-term consolidations or pullbacks remain a normal possibility after a sharp breakout.
The projected Central Pivot Range (CPR) for the next trading session has shifted higher, with the projected Pivot at 1,206.75. A rising and widening CPR generally reflects improving market acceptance of higher prices and often supports trend continuation when accompanied by healthy participation. The current dashboard therefore maintains a constructive outlook with a preference for buying on pullbacks rather than chasing extended moves.
Immediate attention remains focused on the resistance zone between 1,251 and 1,282. A sustained move above this region could strengthen the breakout further and bring the higher-timeframe observation zones near 1,355 and 1,473 into focus. On the downside, 1,176 remains the first important support, while the structural invalidation level is positioned near 1,119.
________________________________________
🏢 BUSINESS & FUNDAMENTAL UPDATE
HCL Technologies recently announced its Q1 FY27 financial results (quarter ended June 2026), delivering a strong operational performance despite a challenging environment for the global IT services sector.
Key Highlights
Net Profit: 4,624 crore, up 20.32% year-on-year from 3,843 crore.
Revenue: 34,579 crore, representing 13.94% year-on-year growth from 30,349 crore.
Interim Dividend: The Board declared an interim dividend of 12 per equity share (face value 2) for FY27. The record date is 17 July 2026, while the dividend will be paid on 27 July 2026.
FY27 Guidance: Management reiterated its constant currency revenue growth guidance of 1–4%, maintaining its earlier outlook despite macroeconomic uncertainty.
The quarterly performance comes at a time when the broader IT sector continues to face headwinds from cautious enterprise technology spending, reduced discretionary budgets and increasing discussions around AI-driven pricing pressure across traditional IT services. Against this backdrop, HCLTech's stronger-than-expected profitability, double-digit revenue growth and stable guidance demonstrate operational resilience and disciplined execution.
Interestingly, the stock had already attracted strong buying interest ahead of the earnings announcement, rallying nearly 5% in the previous trading session. The combination of robust quarterly earnings, a healthy dividend announcement, stable management guidance and a technically confirmed Falling Wedge breakout provides both fundamental and technical support for the improving market structure.
________________________________________
📖 Educational Note
Support and resistance levels should be viewed as observation zones rather than predictive targets. Chart patterns, price action, volume analysis, momentum indicators and CPR are educational tools that help market participants understand evolving market structure within a disciplined risk-management framework. Similarly, strong quarterly results can improve investor sentiment but should always be evaluated alongside broader market conditions, valuation and risk management principles.
________________________________________
⚠️ Disclaimer
This analysis is provided strictly for educational and informational purposes.
It does not constitute financial, investment or trading advice and should not be interpreted as a recommendation to buy or sell any security.
Stock market investments are subject to market risks, including the possible loss of capital.
Past performance, historical observations, chart patterns, earnings performance and technical indicators do not guarantee future results.
Please conduct your own research and consult a SEBI-registered investment adviser before making investment decisions.
STWP assumes no responsibility or liability for any financial loss arising directly or indirectly from the use of this analysis.
 Long
Long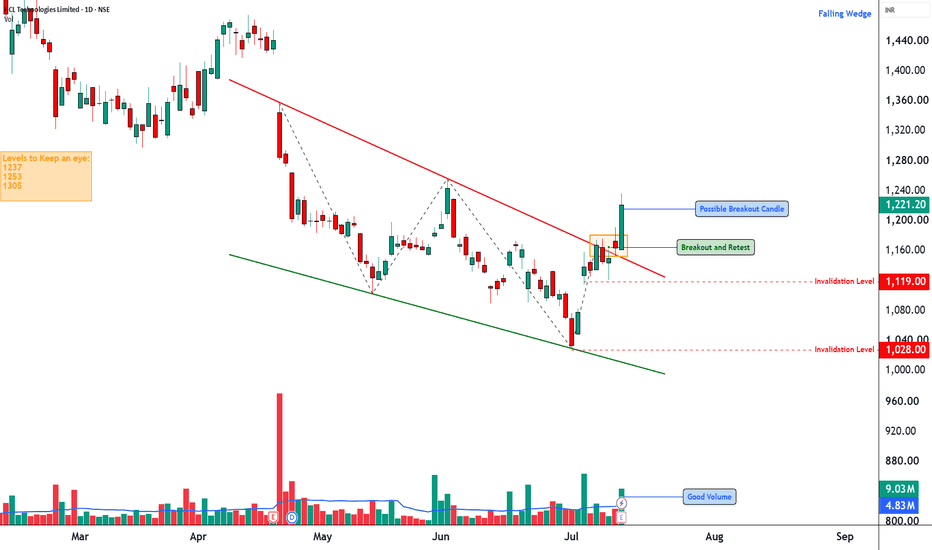
MCX Falling Wedge Recovery Setup📊 MCX: Daily Technical Snapshot – Falling Wedge Recovery Setup
📊 STWP Technical Analysis
________________________________________
MARKET STRUCTURE SNAPSHOT | NSE: MCX | DAILY
Closing Price: 2,742.00 (+98.80 | +3.74%)
Core Trend: Downtrend (Swing Structure)
Market State: Recovery Attempt Within Falling Wedge
Price Structure: Price is trading inside a Falling Wedge, a bullish reversal pattern, after forming a Bullish Engulfing near the lower boundary. Buyers have defended support, and the stock is now attempting to challenge the upper boundary of the wedge.
________________________________________
OPERATIONAL PRICE GRID & KEY REFERENCE LEVELS
Model Reference Level: 2,766.00
Hard Invalidation Level: 2,571.80
Structural Risk: 194.20 (7.02%)
Resistance Levels: R1 2,807 | R2 2,872 | R3 2,978
Support Levels: S1 2,636 | S2 2,530 | S3 2,465
Range Structure: Low 2,571.80 | High 2,978.00
Higher Timeframe Observation Zones: 2,872 | 2,978 | 3,100 | 3,180
________________________________________
MOMENTUM, PARTICIPATION & CPR DATA
Volume Profile: 4.93 Million Shares
Volume Character: Strong Relative Participation
RSI: 42.96 (Recovering Momentum Zone)
ADX: 20.18 (Trend Development Phase)
ROC: -3.14%
MACD Status: Negative Momentum Showing Signs of Stabilization
CCI: -155.33 (Recovering from Oversold Zone)
Stochastic Reading: 35.72 (Recovering from Oversold Zone)
Current Bias: WAIT FOR BREAKOUT CONFIRMATION
CPR State: Bullish Zone | CPR Moving Down (Normal)
Today's CPR: Pivot 2,651.55 | Top 2,655.75 | Base 2,647.40
Tomorrow's CPR (Projected): Pivot 2,701.00 | Top 2,721.50 | Base 2,680.50
________________________________________
📚 EDUCATIONAL OBSERVATION
MCX has shown encouraging signs of recovery after forming a Bullish Engulfing candlestick near the lower boundary of a Falling Wedge, a chart pattern commonly associated with bullish reversals following a corrective phase. The recent price action suggests that selling pressure is gradually weakening while buyers have started defending lower price levels.
The recent decline briefly pushed prices below nearby support before buyers quickly regained control, creating characteristics of a liquidity sweep (false breakdown). Such behaviour often reflects seller exhaustion, where weak hands exit the market before stronger buying interest emerges. The subsequent bullish engulfing candle reinforces this recovery attempt and highlights improving short-term sentiment.
Several technical observations are currently supporting the developing structure:
Falling Wedge Recovery Setup
Bullish Engulfing Candlestick
Liquidity Sweep / False Breakdown
Strong Bullish Recovery Candle
Bullish VWAP Position
Strong Relative Volume Participation
Buyers Regaining Short-Term Control
Momentum indicators are beginning to stabilise after the recent correction. The RSI at 42.96 remains below the stronger momentum zone but has started recovering, indicating improving buying interest. MACD continues to remain below the zero line, suggesting that the broader corrective trend is still intact, although downside momentum appears to be slowing. The CCI reading of -155.33 reflects a deeply oversold condition from which the stock has begun recovering, while the Stochastic reading of 35.72 also points towards improving momentum after emerging from oversold territory.
The projected Central Pivot Range (CPR) for the next trading session has shifted moderately higher, with the projected Pivot at 2,701.00. While this reflects improving market acceptance of higher prices, the setup continues to favour patience until a clearer directional breakout develops.
The immediate technical focus remains on the upper boundary of the Falling Wedge, which also coincides with the resistance zone between 2,807 and 2,872. A decisive close above this region, supported by stronger-than-average trading volume, would confirm the wedge breakout and significantly improve the probability of a broader bullish reversal. Upon confirmation, the higher-timeframe observation zones near 2,978, 3,100, and 3,180 may become relevant for future market structure analysis.
From a business perspective, Multi Commodity Exchange of India (MCX) is India's leading commodity derivatives exchange, facilitating trading across precious metals, base metals, energy and agricultural commodities. Continued growth in commodity market participation, increasing institutional activity and expansion of derivative products provide a constructive long-term backdrop for the company.
Support and resistance levels should be viewed as observation zones rather than predictive targets. Chart patterns, candlestick analysis, price action, volume studies, momentum indicators and CPR are educational tools that help market participants understand evolving market structure within a disciplined risk-management framework.
________________________________________
⚠️ Disclaimer
This analysis is provided strictly for educational and informational purposes.
This is not financial, investment or trading advice and should not be considered a recommendation to buy or sell any security.
Stock market investments are subject to market risks, including the possible loss of capital.
Past performance, historical observations, chart patterns and technical indicators do not guarantee future results.
Please conduct your own research and consult a SEBI-registered investment adviser before making investment decisions.
STWP assumes no responsibility or liability for any financial loss arising directly or indirectly from the use of this information.
 Long
Long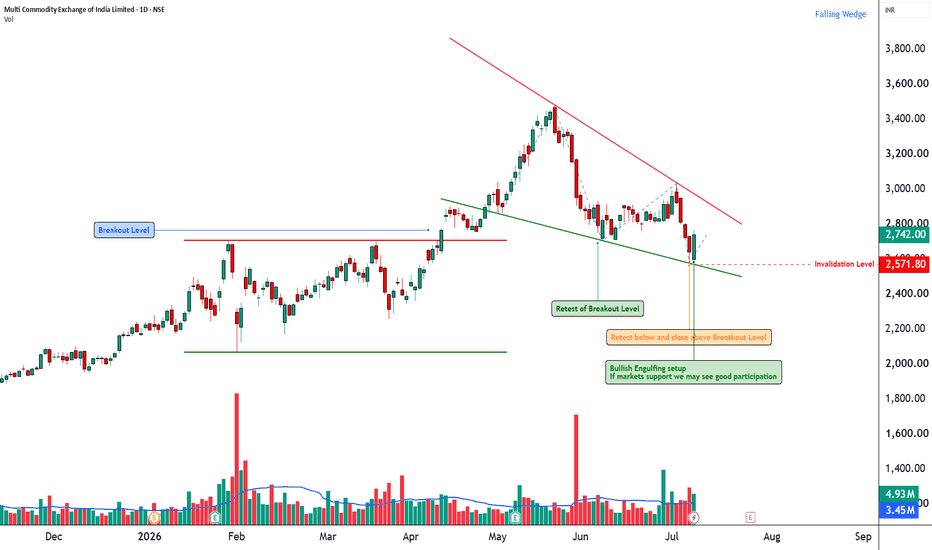
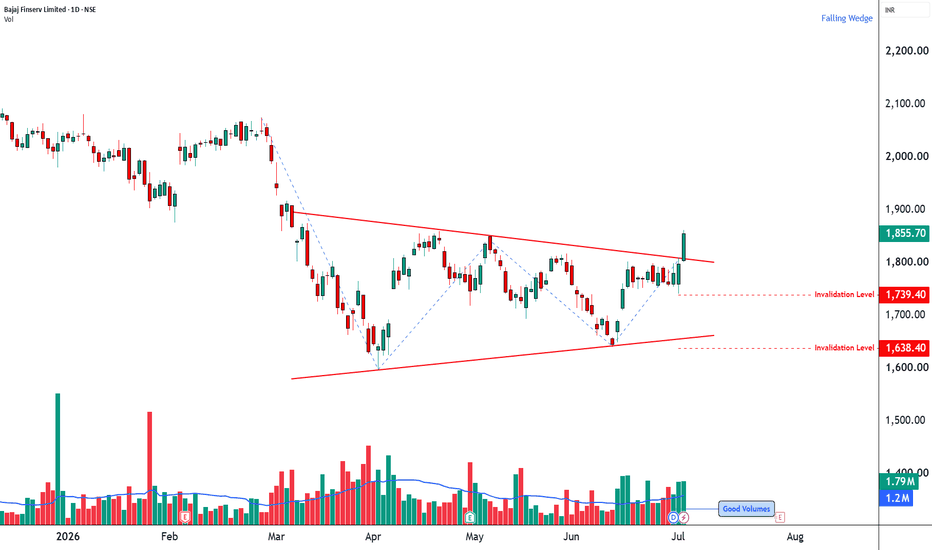
BAJAJFINSV Falling Wedge Breakout Attempt📊 Bajaj Finserv: Daily Technical Snapshot – Falling Wedge Breakout Attempt
📊 STWP Technical Analysis
________________________________________
MARKET STRUCTURE SNAPSHOT | NSE: BAJAJFINSV | DAILY
Closing Price: ₹1,855.70 (+₹58.10 | +3.23%)
Core Trend: Recovery within Intermediate Uptrend
Market State: Bullish Recovery with Breakout Attempt
Price Structure: Price is attempting to break above a Falling Wedge pattern after forming a Higher Low, supported by improving momentum.
________________________________________
OPERATIONAL PRICE GRID & KEY REFERENCE LEVELS
Model Reference Level: ₹1,862.00
Hard Invalidation Level: ₹1,638.40
Structural Risk: ₹223.60 (12.00%)
Resistance Levels: R1 ₹1,877.97 | R2 ₹1,900.23 | R3 ₹1,938.47
Support Levels: S1 ₹1,817.47 | S2 ₹1,779.23 | S3 ₹1,756.97
Range Structure: Immediate Trading Range ₹1,638.40 – ₹1,938.47
Higher Timeframe Observation: Sustained acceptance above ₹1,900 could strengthen the bullish structure towards the ₹1,940 region.
________________________________________
MOMENTUM, PARTICIPATION & CPR DATA
Volume Profile: 1.79 Million Shares
Volume Character: Normal Relative Participation
RSI: 65.64 (Strong Momentum Zone)
ADX: 21.33 (Trend Development Phase)
ROC: +5.16%
MACD: Positive Momentum Structure
CCI: -46.11 (Recovering Towards Positive Territory)
Stochastic: 97.04 (Extended Momentum Zone)
Current Bias: BUY ON PULLBACKS AFTER BREAKOUT CONFIRMATION
CPR State: Bullish Zone | Wide Projected CPR
Today's CPR: Pivot ₹1,782.85 | Top ₹1,790.20 | Base ₹1,775.45
Tomorrow's Projected CPR: Pivot ₹1,839.75 | Top ₹1,847.70 | Base ₹1,831.75
________________________________________
📚 EDUCATIONAL OBSERVATION
Bajaj Finserv has staged a strong recovery from its recent swing low and is now attempting to break above a Falling Wedge, a chart pattern that is commonly associated with bullish reversals when confirmed by price and volume. The recent formation of a Higher Low indicates that buyers have started defending higher price levels, suggesting an improvement in market structure.
The latest session produced a strong bullish candle that challenged the upper boundary of the wedge, signalling renewed buying interest. Although trading volume remained within the normal range, the price action reflects improving market sentiment and increasing participation from buyers.
Several technical factors are aligning in favour of the current recovery:
Falling Wedge Breakout Attempt
Higher Low Formation
Strong Bullish Candle
RSI Breakout
Bollinger Band Expansion
Positive Price-Volume Confirmation
Improving Relative Strength versus NIFTY
Buyers' Dominance
Momentum indicators continue to support the developing structure. RSI at 65.64 reflects healthy bullish momentum without reaching extreme overbought conditions. MACD remains in positive territory, indicating improving trend strength, while ADX at 21.33 suggests that a new trend may be beginning to develop. Although CCI remains slightly negative at -46.11, it is steadily improving, indicating that bearish momentum is fading. The Stochastic reading of 97.04 highlights strong short-term momentum but also suggests that temporary pullbacks may occur after sharp advances.
The projected Central Pivot Range (CPR) for the next trading session has shifted higher, with the Pivot projected at ₹1,839.75. A rising and wide CPR generally reflects improving market acceptance of higher prices and often supports trend continuation when accompanied by sustained buying interest.
The immediate technical focus remains on the resistance zone between ₹1,878 and ₹1,900. A decisive close above this region, supported by stronger-than-average volume, would confirm the Falling Wedge breakout and strengthen the overall bullish structure. If confirmed, the next observation area lies near ₹1,938. On the downside, ₹1,817 acts as the first important support, while the structural invalidation level remains at ₹1,638.40.
From a business perspective, Bajaj Finserv is one of India's leading diversified financial services companies with operations spanning lending, insurance, wealth management and digital financial services. Its diversified business model, strong brand presence and continued focus on financial inclusion provide a constructive long-term business outlook.
Support and resistance levels should be treated as observation zones rather than predictive targets. Chart patterns, price action, volume analysis, momentum indicators and CPR are educational tools intended to help market participants understand evolving market structure within a disciplined risk-management framework.
________________________________________
⚠️ Disclaimer
This analysis is provided strictly for educational and informational purposes.
It does not constitute financial, investment or trading advice and should not be interpreted as a recommendation to buy or sell any security.
Investments in the stock market are subject to market risks, including the possible loss of capital.
Historical performance, chart patterns and technical indicators do not guarantee future results.
Please conduct your own research and consult a SEBI-registered investment adviser before making any investment decisions.
STWP assumes no responsibility or liability for any financial loss arising directly or indirectly from the use of this analysis.
 Long
Long