Wedge
BAJAJHCARE - Breakout Wedge PatternView : Bullish
Entry Zone- 435- 420 (Trend line break inside Broadening wedge)
Exit Zone - 500 - 510 Range or while price touch upper resistance line (marked in red)
Stoploss : Close below 380
Risk/Reward Ratio: 1:1.50
Timeframe: Daily and Weekly
Notes: Trendline break inside the broadening wedge pattern. Price consolidates since Nov 2021.
* This is not a trading recommendation, for educational purposes only
Trent Ltd – Breakout in Progress📊 Analysis:
Trent Ltd is trading near its resistance zone around ₹7,020, forming a rising wedge pattern, which indicates sustained bullish momentum. The stock is supported by the 21-EMA and 50-EMA, confirming strength in the trend. A breakout above ₹7,020 could trigger further upside.
📈 Trading Plan:
Entry: Buy above ₹7,030 (on breakout confirmation with volume).
Target 1: ₹7,600
Target 2: ₹7,870
Stop-Loss: ₹6,810 (below recent swing low to limit risk).
🛑 Risk-to-Reward Ratio: Approximately 1:
Updater Service Ltd. Good for a short swing. - At a support
-Good ROE ROCE
- Risk 11%
Updater Services Limited: UDS
Operates as an integrated business services provider in India, offering solutions in facilities management (IFM) and business support services (BSS). It caters to industries like hospitality, manufacturing, and IT, providing services such as housekeeping, pest control, logistics, staffing, and sales enablement.
Financial Overview:
Revenue Growth: The company achieved a trailing twelve-month revenue of ₹26 billion as of S
WIPRO - broken out of an Ascending Wedge patternASCENDING WEDGE PATTERN -
wipro has broken out of ascending wedge pattern with gap-up opening indicating strong bullish momentum for the stock
100D MOVING AVERAGE -
price has tested the 100D simple moving average several times and have gone upwards indicating strong potential for upward movement
HIGHER HIGHS & HIGHER LOWS -
price has formed multiple higher highs & higher lows indicating price is having bullish momentum
TARGET PRICE -
price will go till 317 level
Is LINKUSDT About to Surge? Yello Paradisers! Could LINKUSDT be on the verge of a major breakout? Here's what we're seeing that could signal a bullish move.
💎LINKUSDT has been trading within a descending channel, but underneath it, a clear W pattern has emerged, increasing the chances of bullish momentum. If LINKUSDT breaks out and closes a candle above the resistance zone, it will confirm both the descending channel and the W pattern, making a bullish move even more likely.
💎On the flip side, if the price pulls back, we
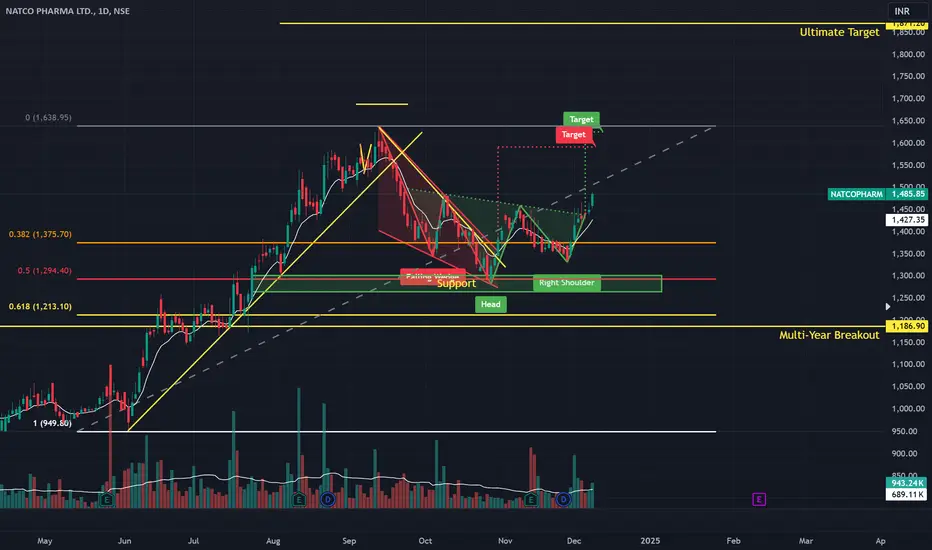
Perfect Time for a Long Entry.Natco Pharma has clearly turned it's way now, after a fall of more than 20% from it's ATH, is has shown some good reversal confirmations, first being it has take rejection form Fibonacci 0.5 level as well as From it's Important Support Zone, Second being formation of two Bullish Chart Pattern i.e. Inverted Head & Shoulders and Falling Wedge pattern and it has given breakout of these pattern too. There are higher probabilities of it going towards a New ATH.
BOMDYEING - Broadening Wedge PatternView : Bullish
Entry Zone- 221- 210 (Trend line break inside Broadening wedge)
Exit Zone - Based on Trader mindset. Exit 1 - 237
Exit 2- 250
Exit 3 - Price reach upper resistance line of Wedge
Stoploss : Close below 202
Risk/Reward Ratio: 1:2
Timeframe: Daily
Notes: Trednline break inside the broadening wedge pattern. Price consolidate since July 2024.
* This is not a trading recommendation; for educational purposes only
FETUSDT: Will This Key Zone Make or Break the Bullish Move?Yello, Paradisers! 🚨 Are you ready for a potential game-changing move in FETUSDT? We're currently sitting in a crucial zone that could decide the next big trend.
💎FETUSDT is riding within a descending channel, and right now, the price is hovering around a key level. If we see a breakout above the resistance zone and a strong candle close, the odds of a bullish rally will significantly increase.
💎But what if the price pulls back? In that scenario, we could see a potential double-bottom pattern
Bajaj Auto Swing Idea (Long)Bajaj Auto is showing a reversal to upside due to following reason:
1)3 attempt for reversal this the 4th attempt for
reversal, might break the doji swing high
2) Parallel channel formation/ wedge pattern
3) Doji candle formation indication of reversal.
(Note: Author not responsible for anyone's profit or loss, nor a sebi registered RA, this only for educational purpose. Please do your own due diligence before taking any trades.)
Is STXUSDT About to Explode or Collapse?Yello Paradisers! Could we be on the verge of a major breakout for STXUSDT, or are we staring down a potential breakdown? Let’s dive into the details so you don’t miss out on this crucial moment!
💎STXUSDT has formed a descending channel, and right now, the price is sitting near a key support zone. This combination significantly raises the odds of a bullish move.
💎What we’re looking for is a Change of Character (CHoCH) in the lower time frame from this support zone. If that happens, the probabi
Is SUSHIUSDT About to Break Out or Break Down?Yello, Paradisers! Are we on the brink of a big move in SUSHIUSDT, or are we about to see a breakdown? Let’s dive into the current setup so you're fully prepared for what might come next!
💎SUSHIUSDT has formed a falling wedge pattern—a bullish signal that’s increasing the probability of an upward move. Along with this, SUSHIUSDT is consolidating near a key support zone, further boosting the chances of a breakout. However, for us to be confident in this bullish scenario, we need to see a Change
Bata Weekly falling wedge Bullish Divergence Squeeze Hello Everyone,
Bata India formed RSI bullish Divergence on weekly timeframe also afalling wedge pattern monthly timeframe peanut chart pattern upside breakout possibilities so buy on dips is good strategy once break above 1550-1600 will go for 2000,2200,2500++
Bullish Breakout in Castrol India Ltd: Falling Wedge Pattern ConCastrol India Ltd has shown a strong bullish signal by breaking out of a falling wedge pattern on the daily chart. The breakout is accompanied by a significant surge in volume, confirming the strength of the move.
Suggested Trading Levels:
Entry: Near ₹220.34 (current breakout level).
Stop Loss (SL): ₹195.00 (below the breakout zone and support level).
Targets:
Target 1: ₹250.00 (initial resistance level).
Target 2: ₹280.00 (based on the height of the falling wedge added to the br
Wedge pattern breakoutPlease look into the chart for a detailed understanding.
Consider these for short-term & swing trades with 2% profit.
For BTST trades consider booking target for 1%-2%
For long-term trades look out for resistance drawn above closing.
Please consider these ideas for educational purpose
Please note that, if there are some big targets, those are drawn thinking for long term.
Wedge Pattern BreakoutPlease look into the chart for a detailed understanding.
Consider these for short-term & swing trades with 2% profit.
For BTST trades consider booking target for 1%-2%
For long-term trades look out for resistance drawn above closing.
Please consider these ideas for educational purpose
Please note that, if there are some big targets, those are drawn thinking for long term.
Real Success Rates of the "Rising Wedge" in TradingReal Success Rates of the Rising Wedge in Trading
Introduction
The rising wedge, also known as the "rising wedge" in English, is a chart pattern that has a remarkable success rate in trading. This analysis details its performance, reliability and complementary indicators to optimize its use.
Success Rate and Performance
-Key Statistics
Overall success rate: 81% in bull markets
Average potential profit: 38% in an existing uptrend
-Breakout Direction
Bearish: 60% of cases
Bullish: 40% of cases
Will SOLUSDT’s Breakout Trigger the Next Bullish Wave?Yello Paradisers! SOLUSDT has delivered an impressive move, breaking out of a descending channel—commonly referred to as a bull flag in higher timeframes. This formation typically signals continuation after a period of consolidation, where the channel resembles a flag following a strong bullish pole.
💎If SOLUSDT retests the broken resistance zone and forms a bullish I-CHoCH (Internal Change of Character) in lower timeframes, this would significantly increase the probability of a continuation to
Are You Ready for a Major AVAXUSDT Move?Yello Paradisers! 👋 AVAXUSDT is at a critical juncture, and it’s essential to stay focused.
💎Currently, the AVAXUSDT is trading within a descending channel, but we’re seeing the potential formation of a bullish W pattern. This is where things get interesting.
💎If AVAX breaks out and closes a candle above the resistance zone, it will validate the W pattern, significantly increasing the chances of a bullish move. 🚀
💎On the other hand, if we see a pullback, the support zone could give us a doubl
💎Get ready for some action with PEPEUSDT💎 Paradisers, #PEPE has broken out of its descending channel and formed an inverse head and shoulders pattern, presenting an opportunity for a small scalp trade.
💎If #PEPEUSDT breaks above the resistance level, we can expect a bullish move. However, my targets are modest due to the current market volatility.
💎In the event of a pullback, we can anticipate a bounce from the bullish Order Block (OB), but confirmation is necessary here. The targets for this potential bounce will also be small.
💎S