Wedge
Is SEIUSDT Poised for a Breakout or a Trap?Yello Paradisers! Is SEIUSDT about to make a major move, or are we looking at a potential trap? 📉
💎We’ve spotted a descending channel on SEIUSDT, typically a bullish pattern—but let’s not get ahead of ourselves. To confirm this setup and stack the odds in our favor, we need to see a breakout and a candle close above the resistance zone. Without this, it's all just speculation.
💎If the price pulls back, we might witness a potential bounce and the formation of a double bottom pattern—another bul
SHIBUSDT: Is a Bullish Reversal on the Horizon?Yello, Paradisers! Have you been tracking SHIBUSDT? The recent price action has formed a descending channel, which could be setting the stage for a bullish move. But how can we know if it's time to jump in? 🤔
💎If SHIBUSDT shows a Change of Character (CHoCH) from the support zone, shifting towards a bullish market structure, it could signal a strong bullish move.
💎If the price starts to rise from the current levels, it could also form a W pattern. A breakout and a candle close above the resista
Will TRBUSDT Trigger a Massive Bullish Rally?Yello, Paradisers! 🌞 Is TRBUSDT about to explode, or will it fizzle out? Let’s dive in!
💎TRBUSDT has broken out of its descending channel and formed a W pattern, which typically signals a strong probability for a bullish move ahead.
💎But here's the key—if TRBUSDT breaks above the resistance zone and closes a candle above it, we can expect the bullish momentum to kick in. 🚀
💎However, if we see a pullback, watch for a potential bounce from the support zone. For those of you who love to scalp, t
page industries falling wedge and long consolidation
Hi guys,
you can see page has fallen from 54349 to 33070
a decent correction and market leader in textiles(under garments)
i think next sector will be textiles however page is at very discount price and downside is very limited
can see faling wedge refer the above image for other time frames and can expect all time high in long term
also after long donwtrend back uptrend
disclaimer- this is not any investment call or idea , this just my view and it can go wrong ,this is only for edu
Suzlon.. currently in Falling Wedge. Looking at this chart of Suzlon Energy Ltd. on NSE, here are some key observations:
1. **Falling Wedge Pattern**:
- The recent price action shows a falling wedge, a pattern characterized by converging trendlines sloping downwards. This often suggests a potential bullish reversal if the price breaks out above the upper trendline.
2. **Uptrend Channel**:
- The price is still within a broader upward trend channel, indicating the overall bullish trend is intact despite the recent correc
Potential positive move in ELPROINTL it took a support at 200 DMA on a daily chart, and it formed a bullish wedger pattern and RSI crossing 40+, all these indicate it to have potential to move up from the CMP. Lets see how it goes in the upcoming month.
Disclaimer: Kindly consult your financial advisor before taking any trade..!!
BankNifty - Did You Miss The Explosive Move from 51000 ? Disclaimer:
This is for informational purposes only and is not a solicitation or offer to buy or sell any securities or products. Consult Your Financial Advisor
As per last idea we proposed that holding 51000 & above BankNifty Index can push upside towards 52050 & Above 52100 - can look for 52900-53100
Happy We achieved 78% of the target & got the maximum points of 1500 points in the Index
Last Idea
What Next ?
Index again forming a similar looking pattern from the highs of
ONGC Near falling wedge pattern 1: 8 Risk reward long setupOil and Gas sector retested the flag pattern breakout.
ONGC also had retested breakout given earlier and last daily candle showing rise in volume with positive closing.
ONGS also formed falling wedge pattern and we are near breakout of the pattern.
I see 1: 8 potential up side trade.
*SWING TRADE*
Buy ONGC 285
Stop Loss: 279
Target 1 (1:2) 299
Target 2 (1:4) 313
Target 2 (1:6) 325
Target 2 (1:8) 340
_Duration 2-3 months_
Trade as per your risk-taking capacity.
TNSR BULLISH IDEA$TNSR is showing bullish vibes after breaking out from a descending channel and successfully retesting the current support. It's a great time to accumulate a spot position.
Keep an eye on the next resistance at around 0.55. If momentum continues, look for potential gains toward 0.65 and possibly higher to 1.40.
TLM READY FOR BREAKOUT! ASX:TLM is looking bullish! After breaking out and retesting successfully, the price has cleared previous resistance, showing strong support around 0.00962.
Looking ahead, the next major target sits at 0.01712. If the bullish momentum continues, we might see it stretch even higher. Keep an eye on support around 0.00959 and 0.00719 as support levels.
KEY HUGE MOVEMENT IS COMING! NYSE:KEY is in a large Falling Wedge pattern, hinting at a potential breakout. It has retraced 75% from the March 2024 high of 0.0135 to the current 0.0043.
Look for resistance near 0.01000 as a breakout target. Initial resistance sits around 0.0077, 0.01000 and above. Watch for support at 0.0032 to manage risk.
KLong
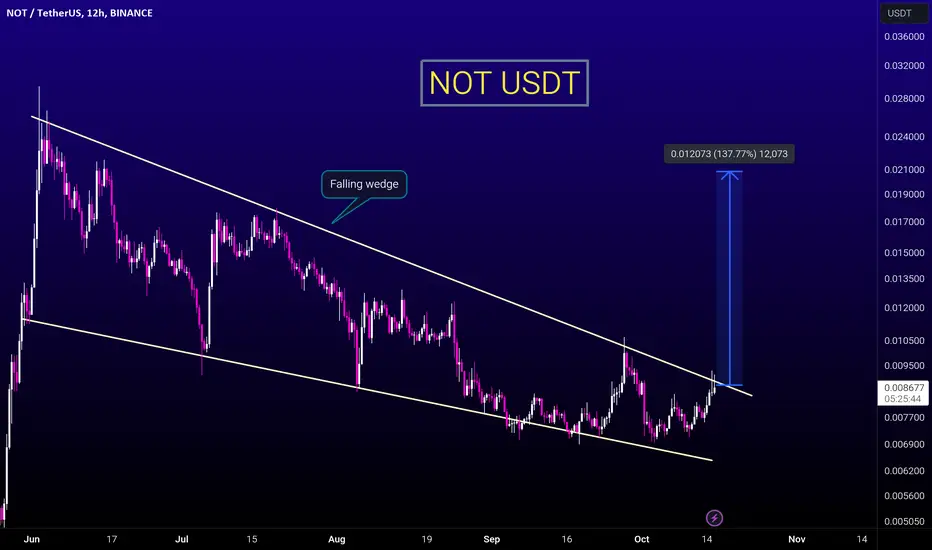
NOTCOIN (NOT) BREAKOUT ALERTGETTEX:NOT shows a textbook Falling Wedge pattern breaking out, indicating a potential bullish reversal.
With the breakout, expect a bullish wave potentially doubling in value. Initial resistance might be around 0.017, while a more ambitious target could reach up to 0.021.
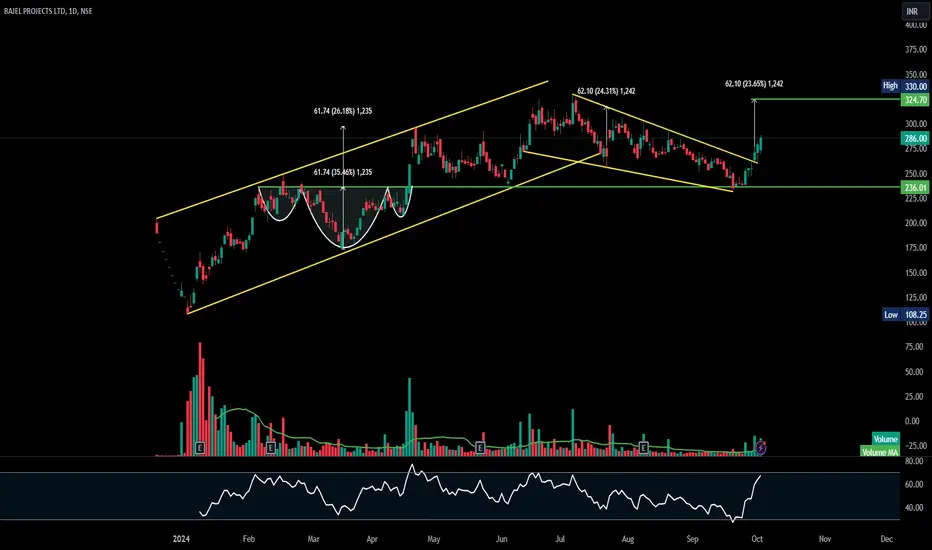
BAJEL - falling wedge Breakout - DailyThe chart of **Bajaj Electricals (BAJEL)**, as shown in the uploaded image, displays a well-defined technical pattern.
### Key Observations:
1. **Uptrend Channel**: The price action is contained within an ascending channel, marked by parallel yellow trendlines. This signifies an ongoing uptrend, with the stock making higher highs and higher lows.
2. **Breakout**: The stock has broken out from the downtrend or consolidation pattern that formed between Oct 1st 2024. This breakout suggests a