Wedge
DOGS/USDT: BUY ZONE ACTIVATED! 60-70% PROFIT POTENTIAL!!Hey everyone!
If you're enjoying this analysis, a thumbs up and follow would be greatly appreciated!
DOGS looks promising right now, breaking out from a falling wedge and currently retesting the wedge. I recommend going long here with a tight stop loss and low leverage.
Targets:
$0.00094
$0.00108
$0.00121
$0.00133
Stop Loss: $0.000736
Leverage: 5x
What are your thoughts on DOGS's current price action? Do you see a bullish pattern? Share your analysis in the comments below!
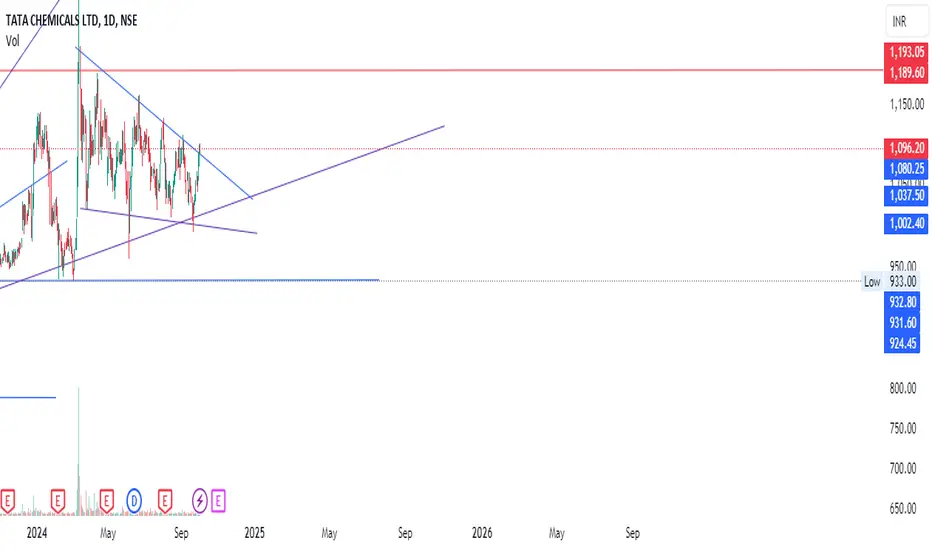
Harsha Engineers International Ltd: Falling wedge PatternHarsha Engineers International Ltd: Falling wedge Pattern
BO soon stock
33 % upside potential
Levels mentioned on chart & given targets seems achievable.
Plan your trade accordingly.
Views are for โโEDUCATIONAL PURPOSE ONLYโโ,trade at your own risk.
"Trade what you see, Not what You Think"
Happy Trading(:)
SURYAROSNI๐ถ๐ ๐๐ฐ๐ฎ๐ป๐ป๐ฒ๐ฑ ๐๐ต๐ฟ๐ผ๐๐ด๐ต ๐ต๐๐ป๐ฑ๐ฟ๐ฒ๐ฑ๐ ๐ผ๐ณ ๐๐๐ผ๐ฐ๐ธ๐ ๐๐ผ ๐๐ต๐ฎ๐ ๐๐ผ๐ ๐ฑ๐ผ๐ป'๐ ๐ต๐ฎ๐๐ฒ ๐๐ผ๐ธ
Here are My Top 4 Breakout Picks
2. SURYAROSNI
-cash from operations up
-borrowings reduced substantially
-margins improved YOY
DEVIT๐ถ๐ ๐๐ฐ๐ฎ๐ป๐ป๐ฒ๐ฑ ๐๐ต๐ฟ๐ผ๐๐ด๐ต ๐ต๐๐ป๐ฑ๐ฟ๐ฒ๐ฑ๐ ๐ผ๐ณ ๐๐๐ผ๐ฐ๐ธ๐ ๐๐ผ ๐๐ต๐ฎ๐ ๐๐ผ๐ ๐ฑ๐ผ๐ป'๐ ๐ต๐ฎ๐๐ฒ ๐๐ผ๐ธ
Here are My Top 4 Breakout Picks
4. DEVIT
-promoter holding up
-fixed assets and capex are up
-improved margins
Cons
-sales are down though
Swing Trade Alert: Surya RoshniSurya Roshni is showing a strong breakout on the weekly timeframe, accompanied by huge volume. Here's why this is worth noting:
Volume Confirmation: The large volume indicates strong buying interest and adds confidence to the breakout.
Technical Breakout: Breaking above key resistance on the weekly chart signifies potential for sustained upside.
๐ฏ What to Watch:
Monitor the stock's price action for confirmation of this breakout.
Sustained volume and follow-through above the breakout level can
JSW Steel channel consolidation breakout bullrunJSW steel has good move pending on higher levels. above 920 it can break the channel patten. Mostly bullish upmove possible. 760 is major support range below the channel breakdown it can give good fall till 400 which is more unrealistic. Expecting bull run in this stock. Jindal steel already given. JSW steel has pending move. Focus. Although this flag patten is slightly bearish pattern but now a days these pattern upper side breakout give rocket move too.
Keep this in mind. Options is a dangero
BEPL Looks BullishBhansali Engineering polymers ltd looks bullish for two reasons:
1. FVG - Price Reflected from Fair Value Gap with a bullish movement.
2. Support Line - Price reached to it's support line where FVG Supported it well
Price can reach to 181 in short term, which is around 11% Upside movement.
Note: This analysis is just for educational purpose. Do you own research before investing.
UNITEDPOLY๐ถ๐ ๐๐ฐ๐ฎ๐ป๐ป๐ฒ๐ฑ ๐๐ต๐ฟ๐ผ๐๐ด๐ต ๐ต๐๐ป๐ฑ๐ฟ๐ฒ๐ฑ๐ ๐ผ๐ณ ๐๐๐ผ๐ฐ๐ธ๐ ๐๐ผ ๐๐ต๐ฎ๐ ๐๐ผ๐ ๐ฑ๐ผ๐ป'๐ ๐ต๐ฎ๐๐ฒ ๐๐ผ๐ธ
Here are My Top 4 Breakout Picks
4. UNITEDPOLY
-promoter stake up from 36% to 50% in last few years
-capital expenditure up
-highest ever sales and may benefit from the Bangladesh fiasco
Is WOOUSDT Primed for a Bullish Breakout?Yello Paradisers! Could WOOUSDT be gearing up for a big move? Letโs dive in.
๐WOOUSDT has broken out of a falling wedge and formed a cup & handle pattern, significantly increasing the chances of a bullish move. But the real confirmation is still ahead.
๐If WOOUSDT breaks above the resistance zone and closes a candle above it, this will confirm the pattern, and we can then expect a strong bullish move.
๐In the case of a pullback, we could see a bounce from the support zone. For a more reliable
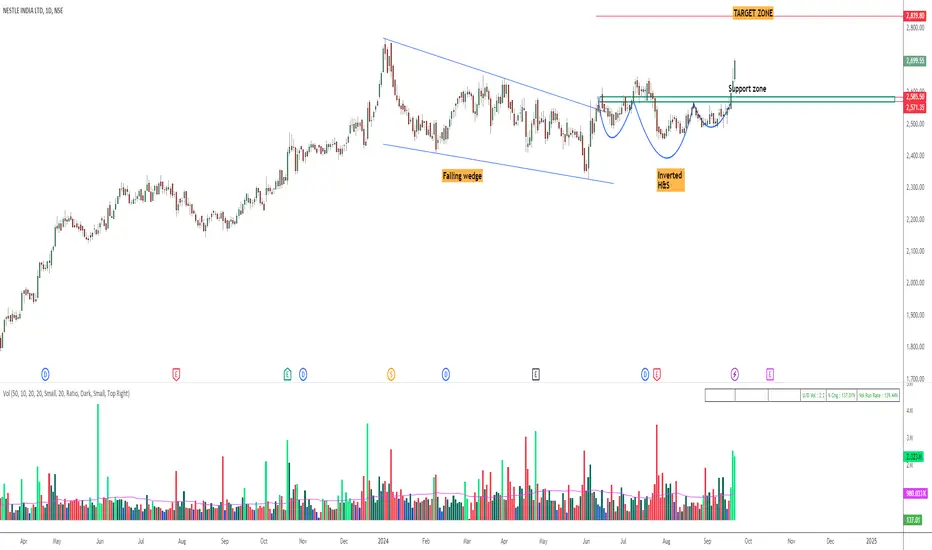
Extraordinary volumes in NESTLEIND - what is cookingNestle India Ltd. is a subsidiary of the global food and beverage giant, Nestle. It's known for its popular products like Maggi, Nescafe, and KitKat.
Key Financial Highlights (as of latest quarter):
Profitability: Nestle India has consistently shown strong profitability, with high profit margins and healthy returns on equity (ROE) and assets (ROA).
Growth: The company has demonstrated steady revenue growth over the years, driven by strong brand recognition and product innovation.
Financial Hea
CEG -Falling Wedge Breakout -DailyThis chart depicts **Constellation Energy Corporation (CEG)** on NASDAQ with a daily timeframe. Here's an analysis of the current price action:
### Key Observations:
1. **Falling Wedge Breakout:**
- The stock has broken out of a **falling wedge pattern**, a bullish signal. The wedge starts around the high in May 2024, with a steady decline until early September.
- The breakout occurred with strong momentum, as evidenced by the sharp price rise to **$254.98**, signaling the potential star
DALMIA SUGAR STOCK :- DALMIA SUGAR
TREND :- POSITIVE
SETUP :- ALL TIME HIGH BREAKOUT IN WEEKLY TIMEFRAME
TIMEFRAME :- WEEKLY
BUY :- AT CUREENT PRICE AND BUY ON RETESTING BREAKOUT LEVEL
STOPLOSS :- BREAKOUT CANDLE LOW
TARGET :- 20 %
NOTE :- please consult your advisor before investing in stocks which i recommended
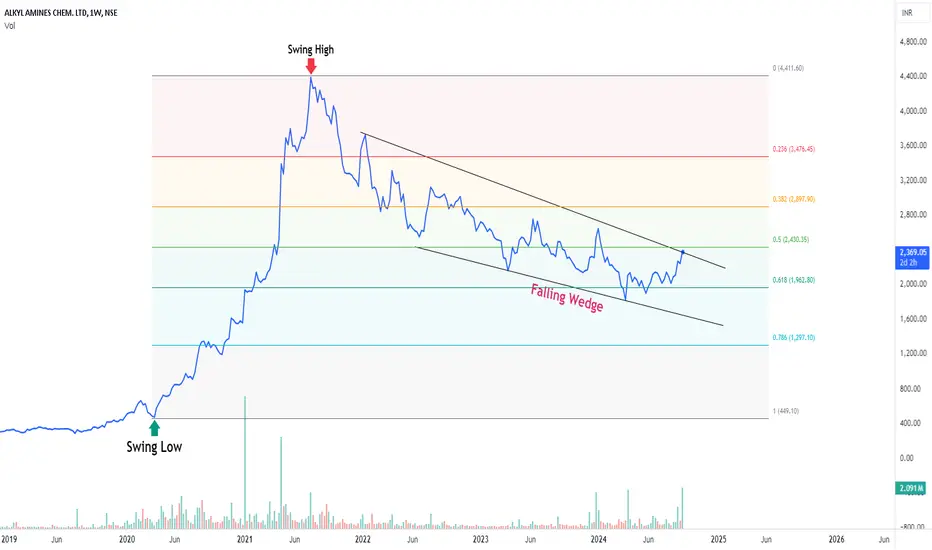
ALKYLAMINE : How to spot Trend Reversal There are 3 tools to identify a Trend Reversal
Fibonacci Retracement Indicator:
- Fibonacci retracement levels are prices, depicted as horizontal lines on a chart, that indicate where support or resistance could likely to occur.
- The indicator is useful because it can be drawn between any two significant price points, such as a high and a low. The indicator will then create the levels between those two points.
Here in this chart Swing low is 462 and Swing high is 4386
The price has fallen
TIAUSDT: A Bullish Breakout or False Hope? Key Levels to WatchYello, Paradisers! Are we about to witness a massive bullish move in TIAUSDT, or will it break down and catch traders off guard? ๐ฑ Let's break it down.
๐TIAUSDT has broken out of its descending channel and is in the process of forming a W pattern, which is increasing the probability of a bullish move.
๐However, for the bullish scenario to truly play out, we need TIAUSDT to break above the resistance zone and close a candle above it. Only then can we expect further upward momentum. But remember
Is NEARUSDT Setting Up for a Breakout? Key Levels to Watch Now!Yello, Paradisers! ๐จ Are we about to witness a major bullish move on NEARUSDT? The falling wedge pattern that has formed is signaling a potential breakout, but there are key signs to watch out for before making any moves.
๐If NEARUSDT approaches the support zone and shows bullish signs, followed by a breakout from the falling wedge, the chances of an upward surge become much stronger. Confirmation will be crucialโlook for signs like:
๐Change of Character (CHoCH) towards a bullish market struct