AsianPaints | Wyckoff Events & Phases Explained !!Wyckoff developed a price action market theory which is still a leading principle in today's trading practice.
The Wyckoff method states that the price cycle of a traded instrument consists of 4 stages – Accumulation, Markup, Distribution, and MarkDown.
👉TEXTBOOK EXAMPLE Accumulation Schematic: Wyckoff Events and Phases
Price Action Analysis
And this is the accumulation stage -
1) PS— Preliminary Support, where substantial buying begins to provide pronounced support after a continued down-move.
- Volume increases and price spread widens, signaling that the down-move may be approaching its end.
2) SC—Selling Climax, the point at which widening spread and selling pressure usually in high point and heavy or panicky selling by the public is being absorbed by larger professional interests at or near a bottom.
- Often price will close well off the low in an SC, reflecting the buying by these large interests.
3) AR—Automatic Rally, which occurs because intense selling pressure has greatly decline.
- A wave of buying easily pushes prices up.
- The high of this rally will help define the upper boundary of an accumulation.
4) ST—Secondary Test, in which price revisits the area of the SC to test the supply/demand.
- If a bottom is to be confirmed, volume and price spread should be decline as the market approaches support in the area of the SC.
- It is common to have multiple STs after an SC.
5) SOS—Sign Of Strength, a price advance on increasing spread and relatively higher volume.
6) LPS—Last Point Of Support, the low point of a reaction or pullback after an SOS.
7) BU/LPS- Backing up to an LPS means a pullback to support that was formerly resistant, on diminished spread and volume.
All the phases of accumulation stage-
Phase A:
Phase A marks the stopping of the prior downtrend.
-- Up to this point, supply has been dominant.
-- The approaching cutback of supply is evidenced in preliminary support (PS) and a selling climax (SC).
-- A successful secondary test (ST) in the area of the SC will show less selling than previously and a narrowing of spread and decreased volume, generally stopping at or above the same price level as the SC.
-- If the ST goes lower than that of the SC, one can anticipate either new lows or prolonged consolidation.
-- Horizontal lines may be drawn to help focus attention on market behavior, as seen in the two Accumulation Schematics above.
Phase B:
-- Phase B serves the function of “building a cause” for a new uptrend
-- In Phase B, institutions and large professional interests are accumulating relatively low-priced inventory in anticipation of the next markup.
--There are usually multiple STs during Phase B'
-- Institutional buying and selling impart the characteristic up-and-down price action of the trading range.
--Early on in Phase B, the price swings tend to be wide and accompanied by high volume.
Phase C:
-- It is in Phase C that the stock price goes through a final test of the remaining supply.
-- this marks the beginning of a new uptrend, trapping the late sellers (bears).
-- It indicates that the stock is likely to be ready to move up, so this is a good time to initiate at least a partial long position.
-- The appearance of an SOS shortly after a spring or shakeout validates the analysis.
Phase D:
--During Phase D, the price will move at least to the top
--LPSs in this phase are generally excellent places to initiate or add to profitable long positions.
Phase E:
--large operators can occur at any point in Phase E.
--These are sometimes called “stepping stones” on the way to even higher price targets.
--------------------------------------------------
Regards,
Revive Traders
------------------------------------------------
Guys check out the related POST as well, it went FANTASTIC !
🙏FOLLOW for more !
👍LIKE if U find it useful !
✍COMMENT your views & feedback !
Wedge
EURJPY SHORT Entry: 🎯 Target: ⛔ Stop Loss: (MARKED IN CHART)
💡 RISK REWARD 1 : 6
💰 Risk 1% of your trading capital.
⚠️ Markets can be unpredictable; research before trading.Disclaimer: This trade idea is based on Elliott Wave analysis and is for informational purposes only. Trading involves risks; seek professional advice before making any financial decisions.Informational onLY !!!
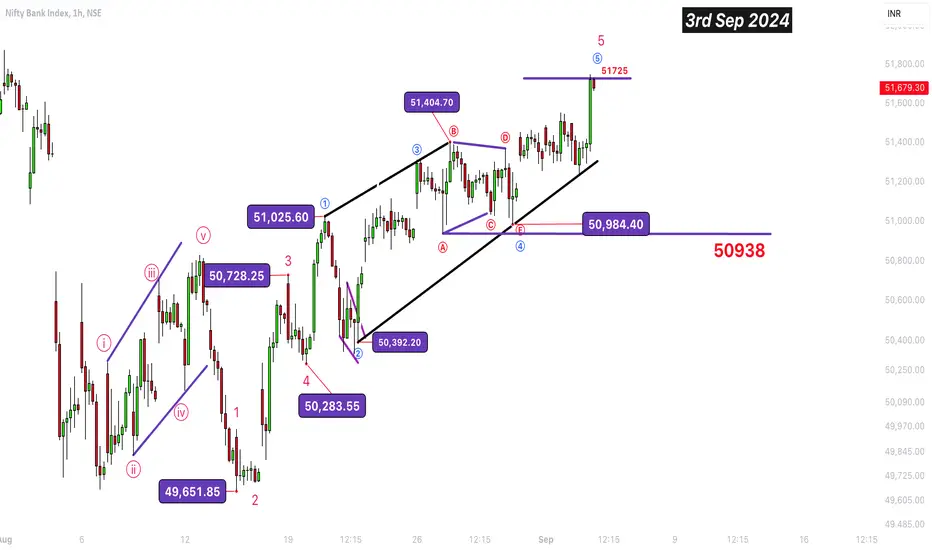
BankNifty ( Elliott Wave) - Will 51700+ Be The Short Term TopDisclaimer:
This is not a solicitation to buy or sell any financial instruments. Please consult your financial advisor.
Explore the latest Bank Nifty analysis with WaveTalks. Will 51700+ be the short-term top? Discover insights and potential market moves as we decode the whispers of the market. Stay informed with WaveTalks - Market Whispers!
Let's Jump In ...
As discussed in the last idea published on 29th August, it was suggested that holding the 50938 / 50939 critical level, Index can make new highs beyond 51404 which is very much possible. The market tested traders' patience on Friday, 30th August, and continued to do so on Monday, 2nd September, and even on 3rd September, with many feeling the urge to give up. However, bulls were fortunate as a last-minute explosive move took BankNifty from 51400 to 51750—a 350-point jump towards the end of the session.
Now, with U.S. markets trading in deep red, with major indices like S&P, Dow, and Nasdaq all down more than 1%, the big question arises: Has the BankNifty pattern we’ve been discussing since last week finally completed? Are we about to fall below 50939, potentially slipping down to the 50300 support level?
Only time will reveal the answers to these questions.
BITCOIN: Bearish - Double TOP + Rising WedgeBITCOIN: Bearish – Double TOP + Rising Wedge
The market could go back down to around $58 000.
In addition, detection of a possible double top on Bitcoin which would bring the price down to around $48 000
Watch for the 50 and 200 exponential moving averages, as well as the Ichimoku levels, and RSI.
be careful
FinNifty weekly expiry analysis for 03/09/2024.Finnifty has been trading in a rising wedge pattern and is trading around the resistance zone of 23800.
For a while the market is being good for option seller and hitting option buyer hard. If the trend changes and market starts trading below 23680, a bearish trade can be entered with previous supports as targets.
In case the market give a break out of the resistance zone above, a small quantity trade can be initiated.
Major support zone is around 23280 and a quality bearish trade can be entered only once the levels is taken out.
Other levels for intraday trades are 23680, 23600, 23490
Resistance zone :- 23840, 23970
Wait for teh price action near the levels before entering the market.
Keep in mind premium decay will be there as tomorrow is the weekly expiry of the index.
Reliance has good rising pattern with consolidation at 3kReliance looks like good consolidation at 3000 round levels. It can rise to ATH soon. Immidiate target is 3300. And according to fibo extension it can reach to achieve further targets till 3640. Please follow the above targets as per the chart. It will again become weak below 3000 levels.
Keep this in mind. Options is a dangerous instrument to play. Please do not go wild on anything unless you know exactly what you doing. Even though your direction is right still you tend to loose in option buying. And market can always prove me wrong and i take that rights too. Experience traders also fail in this market. Only risk management will give you an edge. Don’t take any trades without SL. Respect the market, Ungli nahi katoge to pura hath katna padega. Beware.
DISCLAIMER: I AM NOT SEBI REGISTERED ANALYST. ALL POSTS ARE EDUCATIONAL PURPOSES.NON ADVISORY, DISCRETIONAL NO CLAIMS, RIGHTS RESERVED. I AM NOT RESPONSIBLE FOR YOUR PROFIT OR LOSS.
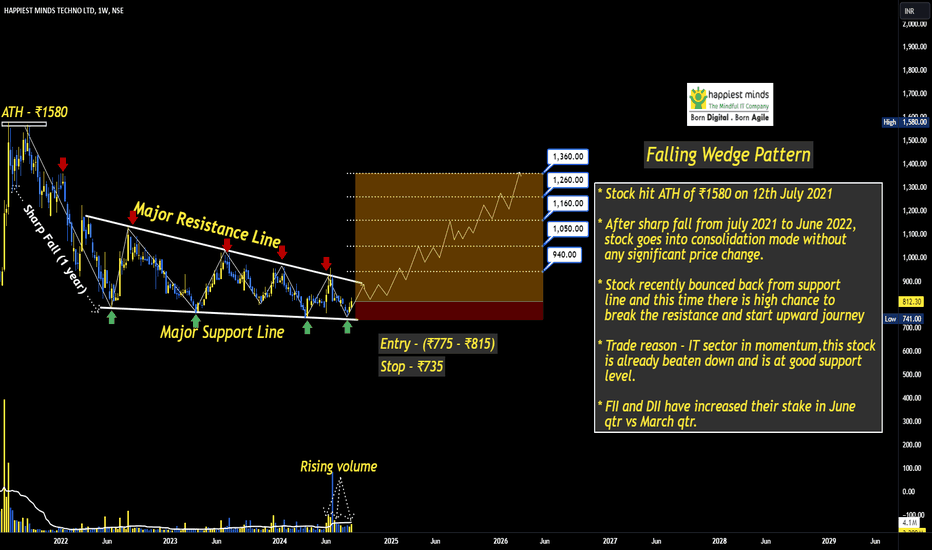
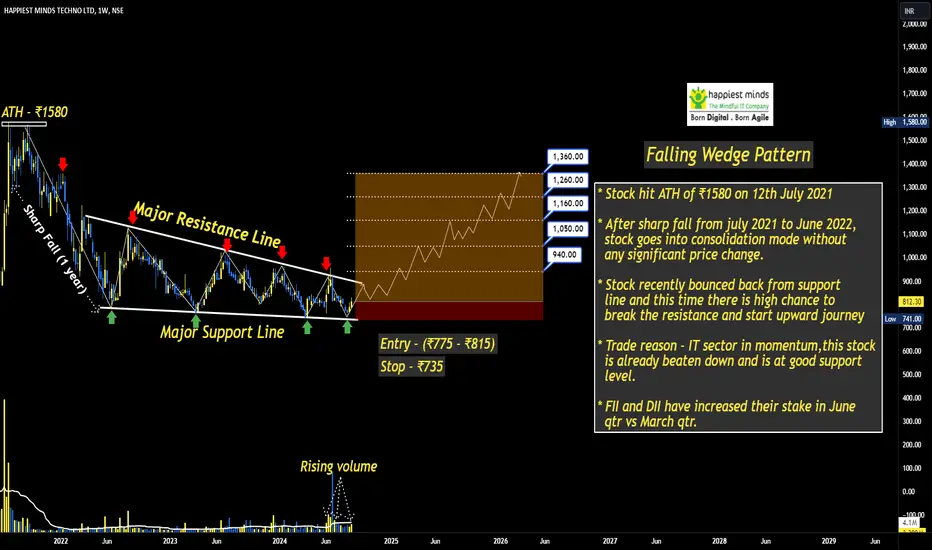
HAPPSTMNDS - Falling Wedge Pattern Formation🔊 HAPPSTMNDS - Falling Wedge Pattern Formation
HAPPSTMNDS - HAPPIEST MINDS TECHNO LTD
⌛Duration - Long Term (1 year to 2 years)
📊📈 Trade Logic - Falling Wedge Pattern Formation
CMP - ₹ 813
Time Frame - Weekly
🎯Target 1 : ₹940
🎯Target 2 : ₹1050
🎯Target 3 : ₹1160
🎯Target 4 : ₹1260
🛑 Stop : ₹735
🏆 Risk/Reward Ratio (1: 7)
* Stock hit ATH of ₹1580 on 12th July 2021
* After sharp fall from july 2021 to June 2022,
stock goes into consolidation mode without
any significant price change.
* Stock recently bounced back from support
line and this time there is high chance to
break the resistance and start upward journey
* Trade reason - IT sector in momentum,this stock
is already beaten down and is at good support
level.
* FII and DII have increased their stake in June
qtr vs March qtr.
Disclaimer: The stock information shared above is not a recommendation to buy, sell, or hold. It reflects my own analysis and is intended solely for educational purposes. Any actions you take based on this information are your responsibility, and the admin of this channel is not liable for any financial gains or losses. Please consult a financial advisor before making any investment decisions. I am not a SEBI-registered advisor.
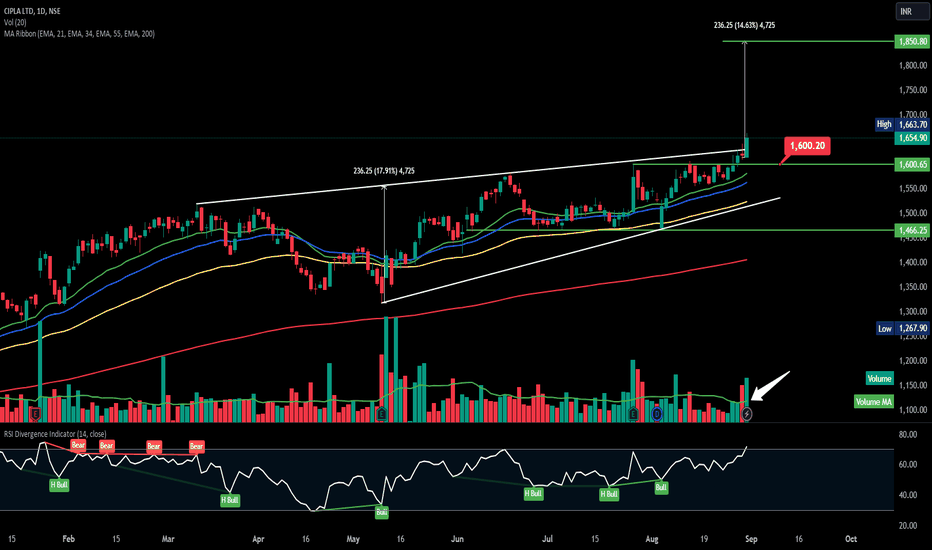
CIPLA -Rising wedge BreakoutCIPLA-Rising -Rising wedge Breakout
Name - CIPLA
Pattern - Rising wedge
Status - BreakOut with good volume
Cmp - 1654
Target - 1850
SL - 1600
Pattern
A rising wedge pattern is a technical analysis tool that often signals a potential bearish reversal. It forms when the price of an asset is moving upward, but the trendlines converge, indicating a loss of momentum. When the price breaks below the lower trendline, it typically suggests a downward move.
Fundamentals :
Here are some key financial ratios for Cipla Limited:
Price-to-Earnings (PE) Ratio: 28.71
Debt-to-Equity Ratio: 0.021
Return on Equity (ROE): 16.8%1
Net Profit Margin: 16.5%2
Revenue Growth (TTM): 10.3%2
Enterprise Value to EBITDA: 19.813
Price-to-Sales Ratio: 4.943
These ratios indicate Cipla’s strong financial health, low leverage, and efficient profitability. The company is well-positioned in the pharmaceutical industry with a solid market presence.
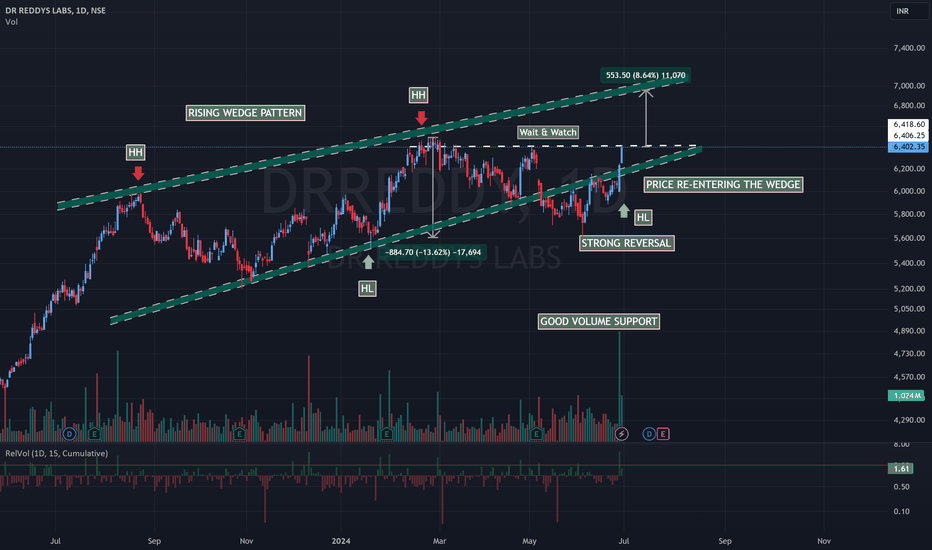
DRREDDY - PRICE REENTERING RISING WEDGE CHANNELHi All,
This idea is about Dr Reddys Lab
Fundamentals
Mkt Cap - 106810 Cr
Stock PE - 19.2
ROE - 21%
ROCE - 27%
Mkt Cap/Sales - 3.8
OPM - 28%
Technicals
Price was pushed back to follow the rising wedge pattern & if it sustains above the marked (white line) resistance, can further show an upside of 8-10% to reach the upper channel of rising wedge
Happy Trading,
Thanks,
Stock-n-Shine
TATATECH LTD. TIME FOR REVERSAL ?NSE:TATATECH
Incorporated in 1994, Tata Technologies Limited is a global engineering services company offering Product Development and Digital Solutions.
Technical Analysis:-
The Simple price action shows a reduction in the strength of bears cause the last 3-4 swing lows failed to form a strong significant lower low.
this action formed a falling wedge structure and this pattern is bullish.
If you combine the RSI readings there is a bullish divergence forming which adds up to a confluence of factors.
the volume is very low on the fall.
Entry is strictly on closing basis only above 1075
Stop:- for short-term traders is 990 on a closing basis and long-term can accumulate more on the sign of reversal from 990.
Tgt levels are mentioned on the chart.
Keep learning,
Happy trading.
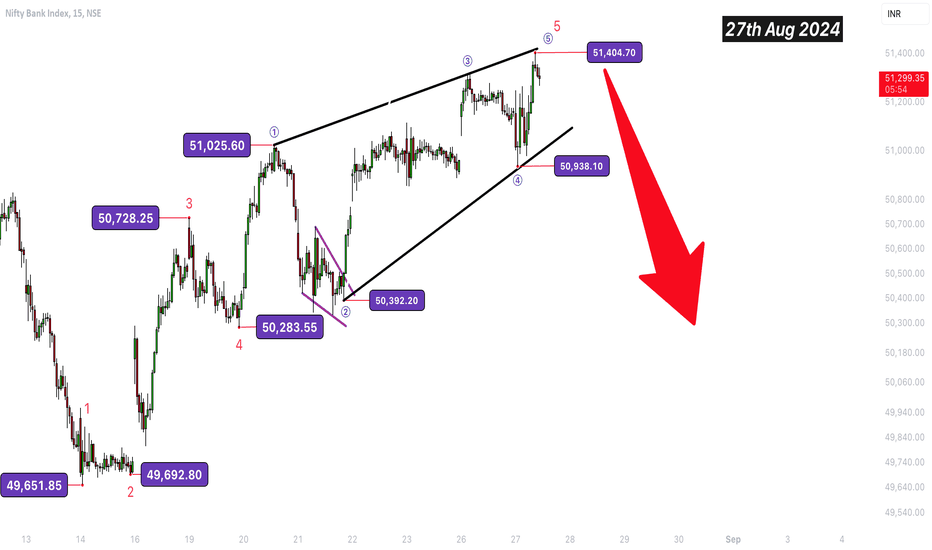
BankNifty - Is this An Ending Diagonal at Tops 51404WaveTalks ...Market Whispers! ...Can You Hear Them?
Disclaimer:
This commentary is not a solicitation to buy or sell. Please consult your financial advisor
As discussed this morning......catching the wave 4 bottoms & watching 5 unfolding in back to back ups & downs with a minor halt at 51251 have we unfolded an ending diagonal at the tops of 51404
Wave 4 Bottoms this morning close to 51000 as discussed
Wave 5 - Is this an ending diagonal unfolded at the current high of 51404
Last Idea Published - Tower Bottom Unveiled
We started this wave sequence close to 49651 discussed in the last idea - Tower Bottom Pattern
Regards,
WaveTalks
TATA TECHNOLOGIES LTD FALLING WEDGE BREAKOUTTata Technologies Limited
It has shown Termendous breakout with
3 weekly higher high closing candles which will lead to two big green candles in short term-
for a target of 1400.
Then it will consolidate before starting next leg of run-
For target second that is of 1830.
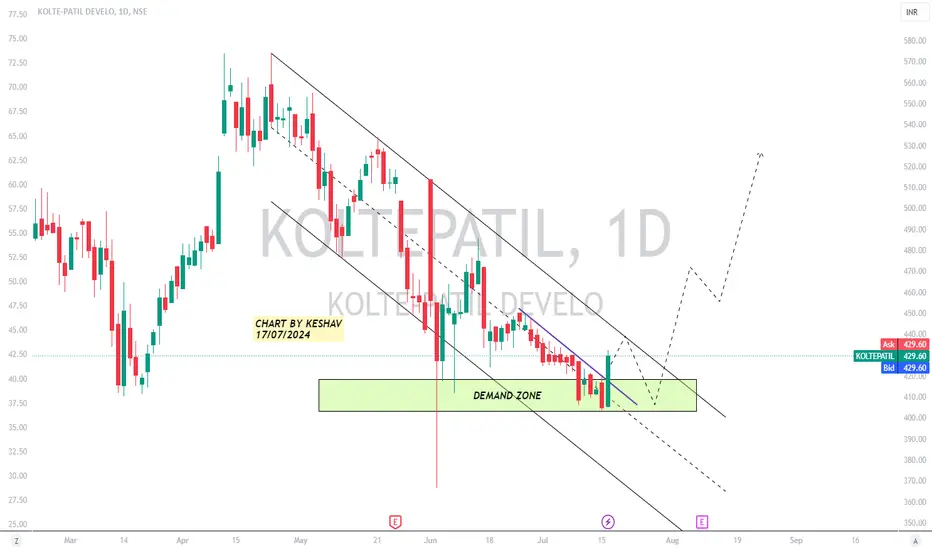
KOLTEPATIL AT DAILY DEMAND ZONEKOLTEPATIL (KOLTE-PATIL DEVELOPMENT)
About the company
The company has been creating landmarks for over 3 decades and has developed and constructed over 50 projects including residential complexes, commercial complexes and IT Parks covering a saleable area of ~20 million square feet across Pune, Mumbai and Bengaluru.
Kolte-Patil is a trusted name with an established reputation for high quality standards, design uniqueness and transparency.
Stock is at Daily Demand Zone Look At the chart👇👇
Trade Setup-
LTP 429
any dip upto 400 can be bought
For targets🎯 457 / 483 / 505 / 521++
Above 525 it would be a breakout.....
Breakout Targets🎯 555 / 581 / 600 / 625+++
WEEKLY SUPPORT 380---370
Tecnical Analysis...
1) Formation in progress of..Falling Wedge pattern on Daily Charts...
2) Volume addition
3) At good and strong numbers
4) Daily and Weekly Support
Regards...
Harm⭕️nics4Life
17/07/2024
Disclaimer & Risk Warning
I am not sebi registered analyst.
My studies shared here are for educational purposes .. Do Consult Your Financial advisor Before Taking any Trade.....Good Luck!
IRFC - Falling Wedge,This chart displays the daily price action of Indian Railway Finance Corporation Limited (IRFC) on the NSE (National Stock Exchange of India). Here’s an analysis based on the chart provided:
### Key Observations:
1. **Descending Wedge Pattern**:
- The price action has formed a falling wedge, a bullish reversal pattern. The price has broken out of the wedge, indicating a potential upward move.
2. **Support and Resistance**:
- The previous resistance level around ₹193.10, which also acted as support in past, is key. The breakout from the wedge aligns with this level, suggesting a retest of this area.
3. **Volume Analysis**:
- There’s been a spike in volume during the breakout, indicating strong buying interest. This adds credibility to the bullish breakout.
4. **Relative Strength Index (RSI)**:
- The RSI is near the neutral zone around 49.53, which suggests there’s room for upward momentum before entering overbought territory. The recent uptick in RSI supports the bullish outlook.
### Possible Scenarios:
- **Bullish Case**: If the price sustains above the ₹193.10 level, a continuation of the upward trend could lead to further gains, potentially towards previous highs around ₹230.
- **Bearish Case**: If the price fails to hold above the wedge breakout level and drops back into the pattern, a retest of lower support levels around ₹165-170 is possible.
### Conclusion:
The chart suggests a bullish breakout with potential for further upside, but watching the ₹193.10 resistance level is crucial for confirmation. The RSI and volume are supportive of a bullish scenario, but risk management is important in case of a false breakout.
Are You Ready for a Bullish Surge in REZUSDT?Yello, Paradisers! Could we be on the brink of a significant move in REZUSDT? The chart is setting up for something big, and you don’t want to miss this potential opportunity.
💎REZUSDT has formed a falling wedge pattern, which typically signals an impending bullish move. However, before jumping in, we need confirmation—specifically, a breakout and candle closing above the resistance zone. This will not only confirm the wedge but also validate the W pattern visible on the smaller timeframes, giving us a solid signal for a bullish continuation.
💎But hold up! If we see a pullback instead, watch out for the triple bottom pattern emerging from the support zone. This could offer a strong base for another bullish attempt, so keep an eye on it.
💎On the flip side, if the price breaks down and closes below the support zone, this would invalidate our bullish scenario. In that case, caution is key, as the market might turn against us.
Remember, consistency and patience are the keys to long-term success in the crypto market.
MyCryptoParadise
iFeel the success🌴
NIFTY50 IMPORTANT LEVELS FOR TOMORROW, 22TH AUGUST NSE:NIFTY ANALYSIS FOR TOMORROW 🔺
❇️ IMPORTANT LEVELS 🚀
❇️ Support: 25730-24680-24645-24600-24550.
❇️ Resistance : 24750-24800-24875-24920
❇️ Raising wedge pattern at 15-30mint time frame. (Bearish pattern)
👉🏻 PURPLE LINE : 24730 is a key level, above buying, Below selling.
👉🏻 @thetradeforecast 🇮🇳