#MRPL. WXYXZ PATTERN VISIBLE...........NEED MORE CORRECTION Current price...201
Three drive bullish pattern forming
WXYXZ pattern forming which leads price to 160.
Behalf of Three drive pattern correction should be end in August last or September first .
These are only assumption. Sharing my idea only for educational purpose. NSE:MRPL NSE:MRPL
Wedge
Midcap sensing big fallMidcap select index is loosing strength now. if it’s not able to sustain above 12770. The news down level targets are 12150 11600. If not able to defend 11600. Bounces will come but final levels are intact. Next big doors will be opened till 9800 which is 50% fibo retracement since 1 year stiff rise. Will keep updating here.
Keep this in mind. Options is a dangerous instrument to play. Please do not go wild on anything unless you know exactly what you doing. Even though your direction is right
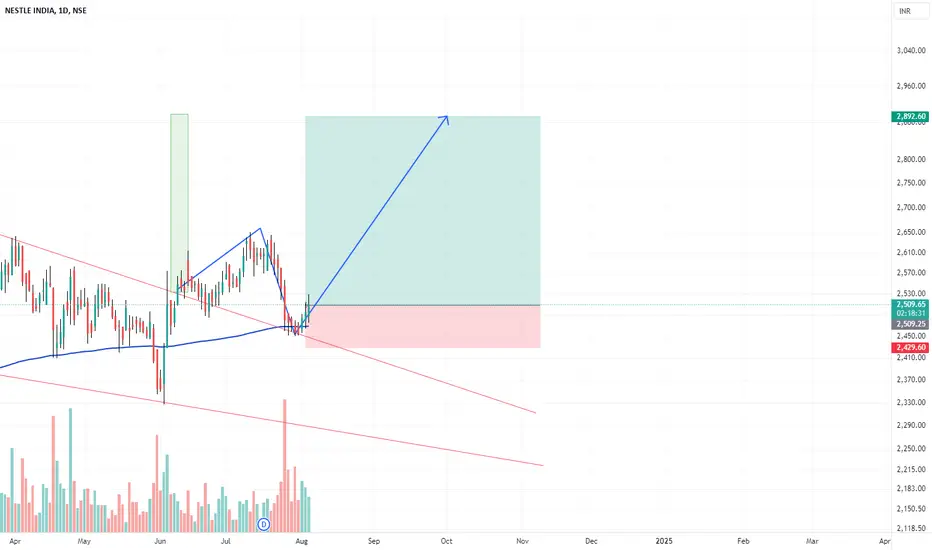
Buy Nestle India: Bullish Wedge Retest OpportunityTrade Idea:
Nestle India recently broke out of a bullish wedge pattern and is now retesting the breakout level. Additionally, the stock has been rejected from the 200 EMA , which adds to the significance of the current setup.
Entry Point : Buy at ₹2500
Stop Loss (SL) : ₹2427
Target Price : ₹2890
The setup offers a small stop loss relative to the potential upside, making it an attractive trade. Ensure to manage your risk and stay updated on market conditions.
Disclaimer : This trade
MOL - TURNAROUND POTENTIAL WITH A FALLING WEDGE BREAKOUTHi All,
The idea is about Meghmani Organics
ABOUT THE COMPANY
Founded in 1986 as M/s Gujarat Industries, the company was incorporated in 1995 as Meghmani Organics Limited. The company manufactures Pigments and Agrochemicals through its 6 manufacturing facilities located in Gujarat. The company is amongst the top 3 Phthalocyanine based pigment players in the world and amongst the top 10 producers of pesticides in India. Meghmani Organics Ltd (MOL) manufactures green and blue pigment products
DOGECOIN: Rising wedge + R.O.C DivergenceDOGECOIN: Rising wedge + R.O.C Divergence
The Wolf of Zurich has detected an ascending wedge + A nice divergence on the R.O.C = Rate Of Change, which indicates the variation of the Momentum of the underlying.
To watch the 50 and 200 exponential moving averages
The Fibonacci and ICHIMOKU levels
Consolidation breakout is on the cards!Vguard has been consolidating from 2018 in a rising wedge pattern.
Today, the stock has given a breakout of its ATH and is currently looking bullish.
However, the best entry for the stock is 255-260 with a SL of below 235 DCB for minimum target of 300.
The stock can give multibagger after a upward breakout of the pattern.
Idea is shared for educational purposes and should not be considered as a recommendation.
BankNifty Rising Wedge Resistance - Breakout OR Breakdown?Bank Nifty: on the monthly timeframe, the 53,000 level stands out as a crucial resistance line. The market's next significant move is contingent upon a decisive close above this barrier in the lower timeframe. The current pattern resembles a rising wedge.
PEPEUSDT: Major Breakout or Major Breakdown? Yello, Paradisers! Is PEPEUSDT gearing up for a bullish surge, or are we on the brink of a breakdown? Let's dive in!
💎PEPEUSDT has broken out of its descending channel and formed an inverse head and shoulders pattern, which significantly increases the probability of a bullish move. But before we get too excited, let's break down what needs to happen next:
💎For this bullish pattern to be confirmed, we need to see a breakout and a candle closing above the resistance zone. This will solidify the
IndoBorax - Fibonacci Targets in sight after Breakout - DailyIndo Borax & Chemical Ltd. has recently broken out cleanly from a descending trendline. The Fibonacci retracement levels provide clear targets for the upcoming price action, making this an interesting setup.
Technical Analysis:
Descending Trendline Breakout: The stock has decisively broken out from a descending trendline, indicating a shift in momentum from bearish to bullish.
Fibonacci Retracement Levels: The Fibonacci retracement levels drawn from the recent high to the low indicate po
Is GLMUSDT About to Skyrocket? Don't Miss This Critical AnalysisYello Paradisers! Have you noticed the recent breakout in GLMUSDT? This could be the perfect setup for a major bullish move, but let's dive into the details to understand why.
💎GLMUSDT has broken out of its descending channel, showing a Change of Character (CHoCH) towards a bullish market structure and forming an inverse head and shoulders pattern. These factors combined significantly increase the probability of a bullish move.
💎However, for confirmation, we need to see a breakout and candle c
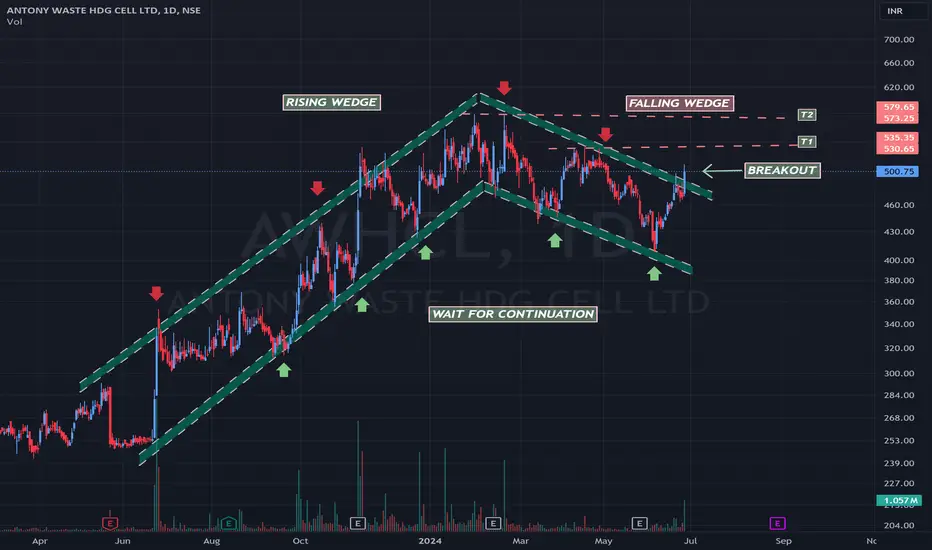
ANTONY WASTE - RISING WEDGE FOLLOWED BY FALLING WEDGE (BO)Hi All,
This idea is about Antony Waste Handling Cell Ltd
Fundamentals
Market Cap - 1419 Cr
Stock PE - 16.5
ROE - 16.3
ROCE - 13.9
Promoter Stake - 46.1
Quick Ratio - 1.3
D/E - 0.78
Antony Waste Handling Cell Ltd is engaged in the business of mechanical power sweeping of roads, collection and transportation of waste, waste to energy project and undertake the designing, construction, operation and maintenance of the integrated waste management facility in Kanjurmarg, Mumbai.
Technicals
Sin
Indigo Paints Long Position with Strong PotentialIndigo Paints is currently exhibiting a promising setup for a long position. Entering with a stop-loss at 1429 to manage risk, the initial target is set at 1630. The technical indicators also suggest that this stock has strong potential for a long-term hold. Keep an eye on its performance for a solid opportunity in the market.
MEMEUSDT: Cup & Handle Pattern Could Signal Major Reversal!Yello Paradisers! Are you ready for a potential breakout that could send MEMEUSDT soaring? Let's dive into the latest technical analysis and see what's brewing.
💎MEMEUSDT has recently broken out of a descending channel and is currently showing consolidation. This consolidation is forming a classic cup and handle pattern, which typically increases the probability of a reversal.
💎However, to confirm this bullish move, we need to see a breakout and candle closing above the resistance zone. This w
SENCO - POST 20% CORRECTION, PA MIGHT REVERSE FRM BOTTOM CHANNELHi All,
This idea is about Senco Gold Ltd
The stock has corrected over 20% in this month alone & now have reached the lower channel of rising wedge formation. Volumes have dried up indicating the supply may have exhausted & Price action might soon reverse from this point
Stock can be bought if it gives a closing above 980 for further targets of T1 1010, T2 1070, T3 1150.
If the stock shows further downside then the support levels are S1 916, S2 864
The correction is due to poor quaterly re
Is RUNEUSDT Poised for a Bullish Breakout?Yello, Paradisers! Could RUNEUSDT be gearing up for a bullish breakout? Let’s break down the latest analysis and see what levels are crucial for this move.
💎RUNEUSDT is currently in a descending channel and has formed a cup and handle pattern, increasing the probability of a bullish move. However, we need more than just patterns to confirm the trend.
💎We need a breakout of both the descending channel and the resistance zone of the cup and handle pattern to confirm a bullish move.
💎If there's
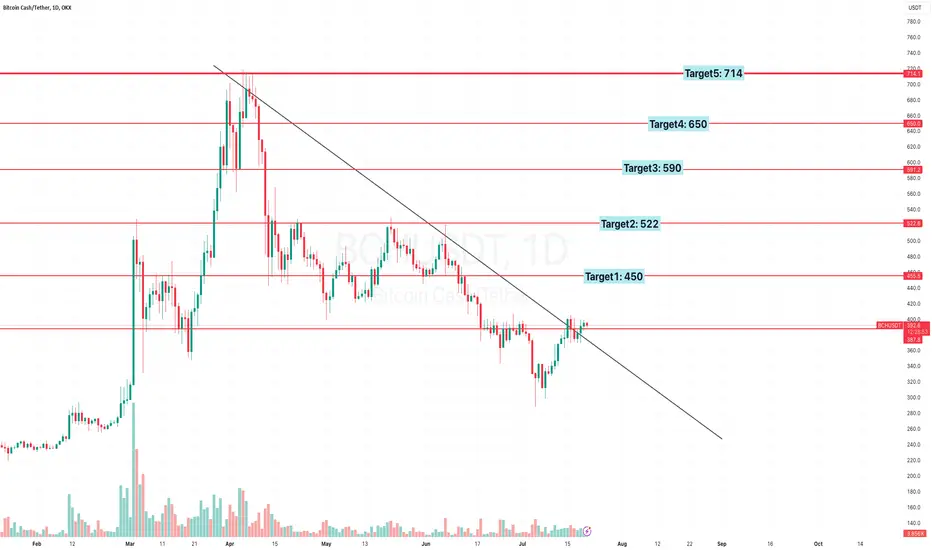
Bitcoin cash good rising pattern from the bottomSimple breakouts price action seen in Bitcoin cash. It has lot of potential. Treadline breakout is already done in day timeframe. Retesting it and booooom….
Keep this in mind. Options is a dangerous instrument to play. Please do not go wild on anything unless you know exactly what you doing. Even though your direction is right still you tend to loose in option buying. And market can always prove me wrong and i take that rights too. Experience traders also fail in this market. Only risk manageme
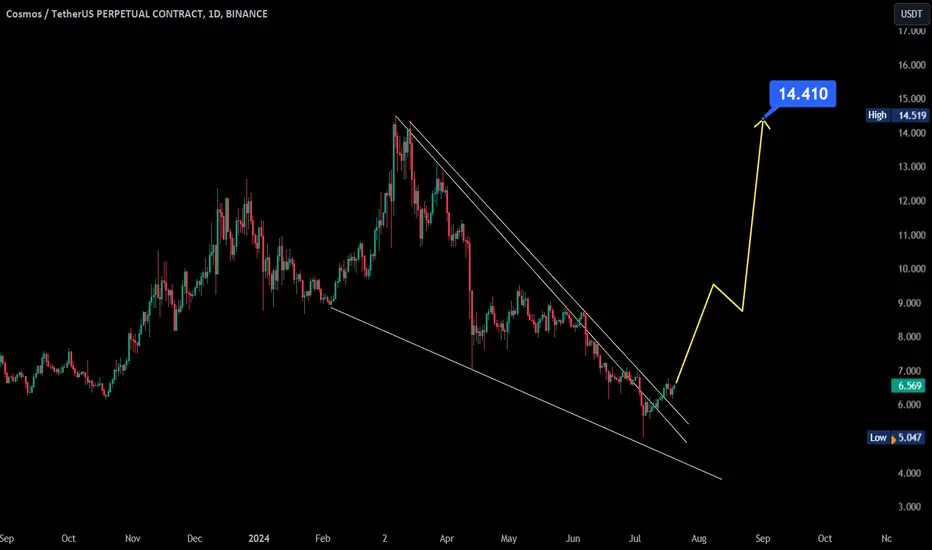
QTUMUSDT: Will This Breakout Lead to a Major Bull Run?Yello Paradisers! QTUMUSDT has broken out of a falling wedge pattern, increasing the probability of a bullish move. But, can we trust this breakout to lead us to significant gains?
💎For confirmation, we need a breakout and candle closing above the resistance zone. This will increase the likelihood of a bullish move, potentially driving the price to the next resistance levels.
💎However, if we see a pullback, we might witness a potential triple bottom pattern forming from the support zone. For t
Could This Be the Turning Point for SXPUSDT? Don't Miss Out!Yello, Paradisers! Have you been keeping an eye on SXPUSDT? We've spotted a crucial pattern that could signal a major move. Here's the breakdown:
💎SXPUSDT has formed a falling wedge pattern, which typically increases the likelihood of a bullish breakout. However, to confirm this, we need to see a breakout and a candle closing above the resistance zone. This will significantly enhance the probability of an upward move.
💎If we experience a pullback, a bounce from the support zone is expected. Fo
SLong