AVAXUSDT: Bullish Breakout or False Hope?Yello, Paradisers! 🌟 Are we about to witness a bullish breakout for AVAXUSDT? Let's dive in and find out!
💎AVAXUSDT has taken liquidity and formed a W pattern, breaking the descending channel. These factors are increasing the probability of a bullish move. However, for confirmation, we need a breakout and candle closing above the resistance zone, which will signal a strong bullish move.
💎While some might consider going long from here from the current price, But it's a low-probability setup. Th
Wedge
Nifty is stretched (expecting 10% correction)I feel market is bit stretched now. Time for one corrective move. I might be wrong too but the pattern suggest that. Follow this post for regular updates. Views can be changed time to time. But for long run, it has to correct.
For more details also check my past analysis about fall.
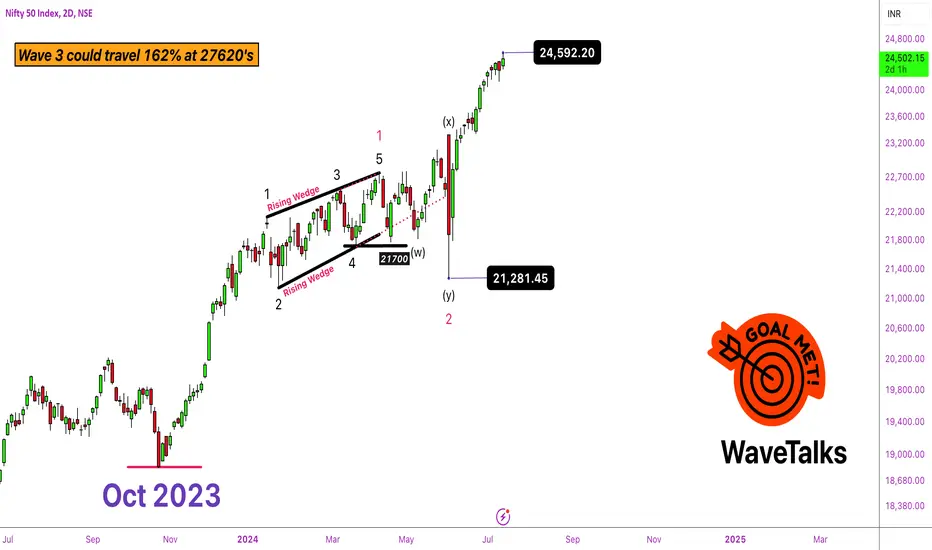
Nifty Reaches 24,500 Target: Elliott Wave Analysis Disclaimer:
------------------------
Trading in financial markets involves substantial risks. Consult your financial advisor before making decisions. This commentary is not a solicitation to buy or sell.
WaveTalks - Market Whispers: Can you hear them?
----------------------------------------------------------------------------------------------
General Election 2024: Impact on Nifty
The 2024 General Election resulted in a clear victory for the existing NDA government, with Prime Minis
SUNDARAM FINANCE - RISING WEDGE SINCE AN YR Hi All,
This idea is about Sundaram Finance Holding
Fundamentals
Market Cap - 6k Cr
Mkt Cap/Sales - 20.9
ROE - 12%
P/BV - 1.27
Div Yield - 2.81%
Technicals
Price action has been in a rising wedge pattern since Jul 23 & currently consolidating at the bottom of channel for past few days. It can give a upmove of nearly 25% in very short term.
Traders can take positional trades to capture the move.
There is a small resistance for which traders need to be careful. Price reverted twice from
SLong
Rising Wedge in nifty - bearishA rising wedge is a bearish chart pattern that typically appears at the top of a mature uptrend. Here are the key characteristics and considerations:
Preconditions:
A strong, mature trend in the background (multi-day/week).
Wave HH1 (higher high) should be significantly smaller than the subsequent wave H.
HH2 (another higher high) should be smaller than HH1.
The HH-HL (higher high - higher low) structure results in a rising wedge or arrowhead.
It usually appears at the potential top of a rally.
CESC - falling wedge A falling wedge pattern is a technical analysis chart pattern that typically signals a potential reversal or continuation of the current trend. In the context of CESC (Calcutta Electric Supply Corporation), here’s how you can understand and identify a falling wedge pattern:
Characteristics of a Falling Wedge
1. **Shape**: The pattern is shaped like a wedge that is sloping downward. It is formed by two converging trendlines – a downward sloping resistance line and a downward sloping support lin
BANDUSDT Falling Wedge: Is a Bullish Breakout Imminent?Yello, Paradisers! Have you been tracking BANDUSDT? The market is presenting a prime opportunity that you can't afford to ignore. Let's break it down!
💎BANDUSDT has formed a falling wedge pattern, and the price is currently sitting in the support zone, increasing the probability of a bullish move.
💎If the price shows an I-CHoCH (Internal Change of Character) in the lower timeframes, indicating a shift towards a bullish market structure, the probability of a bullish move will increase.
💎The pr
VETUSDT Descending Channel: Potential Breakout or Breakdown?Yello, Paradisers! Have you been keeping an eye on VETUSDT? The market is at a critical juncture, and you don't want to miss out. Let's dive in!
💎VETUSDT has formed a descending channel and recently bounced from a bullish order block after taking liquidity, increasing the probability of a bullish move.
💎For a confirmed bullish move, we need a breakout of the descending channel and the resistance zone together. This will significantly increase the probability in our favor.
💎If a pullback occur
M_M @ ATHCurrently M&M trading @ ATH.
Pros:- Retracement with breakout @ 4 hour timeframe.
:- Stock @ Ath which gives nice bullish momentum.
:- Cheap premiums in options.
:-Target till 3,000/-.
:- Entry @ first week of July_2024 which gives Bett opportunity in options trading.
:- Auto sector reduced price in SUV'S and Ev vehicle's.
Con's:- Sideways momentum in stock.
ARBUSDT: Could This Be the Next Big Breakout? Yello, Paradisers! Are you ready to catch the next big move in ARBUSDT? Let's break it down!
💎ARBUSDT has formed a falling wedge pattern and has taken liquidity, which increases the probability of a bullish move. However, there are key confirmations we need to watch for:
💎For a bullish trend confirmation, we need a breakout from both the falling wedge and the resistance zone. This will significantly increase the likelihood of a sustained upward move.
💎We can expect a bullish move from the cur
Valor Estate Ltd.#### 1. **Price Chart Analysis (Upper Section)**
- **Uptrend Channel**: The price is moving within a clearly defined upward channel, indicating a long-term uptrend.
- **Support and Resistance**:
- **Channel Support**: The price has touched the channel support multiple times, confirming its validity.
- **Horizontal Resistance**: There is a horizontal resistance line which was recently broken, suggesting a bullish breakout.
- **Chart Patterns**:
- **Falling Wedge**: A falling wedge pattern i
Are You Ready for CHRUSDT’s Potential Breakout?Yello, Paradisers! Have you noticed the patterns forming on CHRUSDT? Let's dive into the technicals to understand the next big move.
💎CHR has formed a descending channel and within it, an inverse head and shoulders pattern. This combination is increasing the probability of a bullish move.
💎For confirmation of a bullish move, CHR needs to break both the descending channel and the inverse head and shoulders pattern simultaneously. This dual breakout would signal a strong bullish trend.
💎If ther
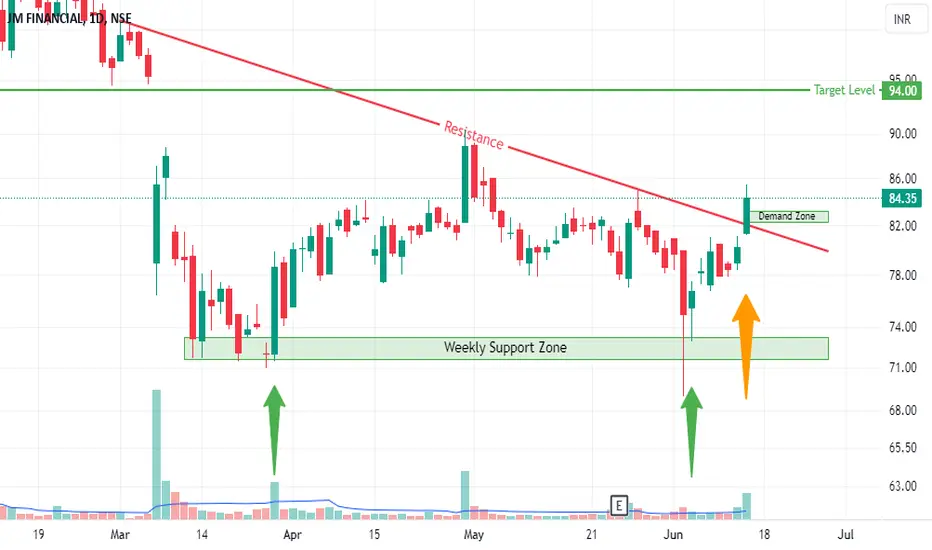
RESTAURANT BRAND ASIA - Swing Trade Analysis - 6th July #stocksRESTAURANT BRAND ASIA (1W TF) - Swing Trade Analysis given on 6th July, 2024
Pattern: FALLING WEDGE BREAKOUT
- Weekly Resistance Trendline Breakout - Done ✓
- Weekly Support Zone Retest & Consolidation - Done ✓
- Strong Pullback candle with Volumes after consolidation - Done ✓
- Demand Zone retest for a Small SL and a better RR - In Progress
* Disclaimer
Massive Opportunity Ahead for XECUSDT! Don't Miss Out!Yello Paradisers! Are you ready to seize a potential bullish move in XECUSDT? 📈 The market is showing signs of a major breakout, and you won't want to miss this. Let's dive into the details:
💎XECUSDT has formed a falling wedge pattern and taken liquidity, increasing the probability of a bullish move after confirmation.
💎We need a breakout of the falling wedge and resistance zone to confirm the bullish move.
💎While a small pullback entry is possible, it's riskier. I suggest waiting for the bre
Globus Spirits Wave Counting and Next Targets 1700 and 2350!Here is why we are super bullish on Globus Spirits:
1. This stock has corrected deeply from the top (61.8% Fib).
2. Falling wedge pattern (proper buying angle).
3. Hidden bullish divergence.
4. Wave analysis: The stock has completed Waves A and B, and is now ready for Wave C.
5. Ichimoku turning positive.
We see great risk-to-reward in this stock. It has the potential to hit our targets and could rally even further.
Disclaimer: We are not SEBI registered. The content presented here is based o
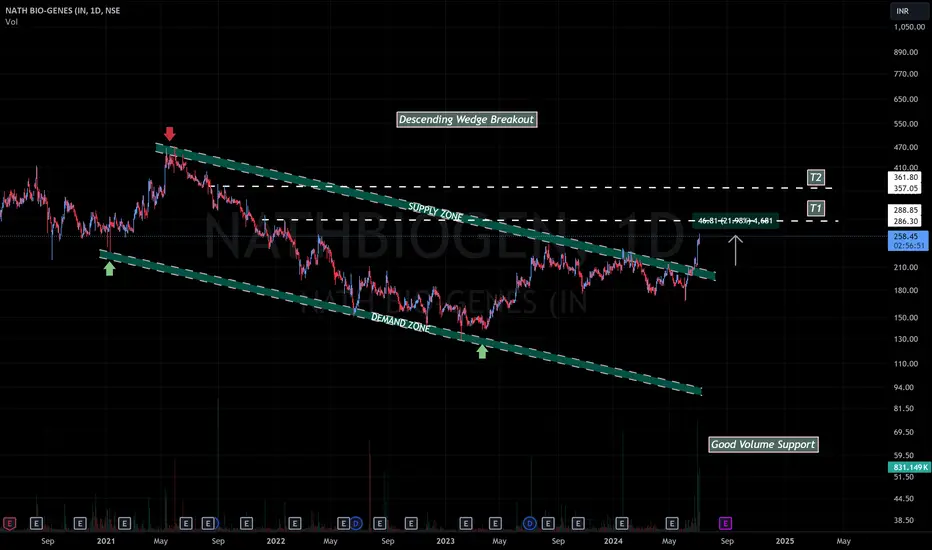
NATHBIOGEN - DESCENDING WEDGE BREAKOUTHi All,
This idea is about Nath Bio-Genes (India) Ltd
Mkt Cap - 495 Cr
Sales - 333 Cr
Mkt Cap / Sales = 1.49
ROE - 6.2%
ROCE - 6.8%
Promoter Holding - 45.6%
Quick Ratio - 1.3
D/E - 0.18
Technicals
The daily TF chart shows a positive breakout from a descending wedge pattern. This might mark a trend reversal scenario. With sector tailwinds behind, price can further rise to targets mentioned in the chart
Happy Trading,
Thanks,
Stock-n-Shine