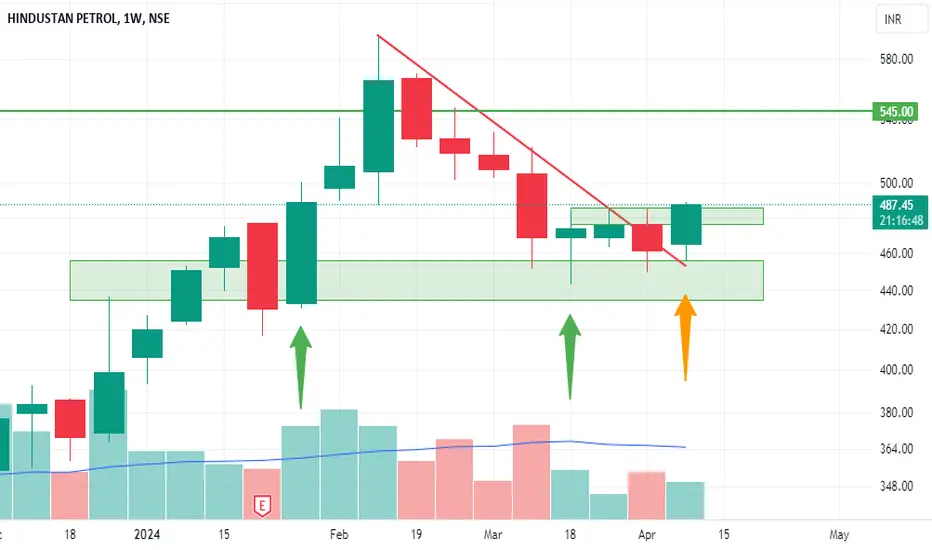
HINDPETRO - Swing Trade Analysis - 11th April #stocksHINDPETRO (1W TF) - Swing Trade Analysis given on 11th April, 2024
Pattern: FALLING WEDGE BREAKOUT
- Trendline Resistance Breakout - Done ✓
- Volume buildup at Resistance - In Progress
- Demand Zone Retest & Consolidation - In Progress
#hindpetro #niftyenergy
Wedge
TRB: Watch for Key Breaks to Validate Bullish Trend!💎 Paradisers, #TRBUSDT has broken out of a falling wedge pattern and has now formed a 'W' pattern, which increases the likelihood of a bullish move.
💎 If #TRB closes a candle above the resistance level, it will validate the pattern, and we can set our targets at the previous swings.
💎 However, if the price closes a candle below the demand zone, it will invalidate our entire bullish idea. In that case, it would be better to disregard this setup and wait for more favorable price action to develo
LODHA Infra will correct from hereLodha is trading around the resistance
This is linear chart of LODHA in weekly timeframe
Stock is trading in a rising channel
Currently stock is around the resistance of Rising channel which is coming around 1450-1500
Fresh Buy could be very risky around these levels
And if anyone is holding then Trailing Stop Loss would help them to grab maximum profits.
Thank You !!
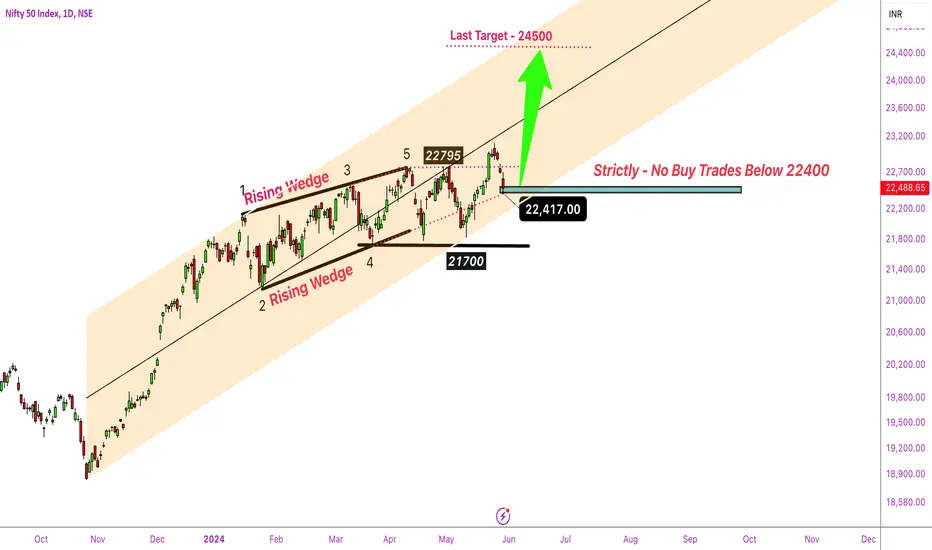
Nifty - Pre Exit Poll Outlook: Bulls Above 22,400 Disclaimer:
Trading in financial markets involves substantial risks. Consult your financial advisor before making decisions. This commentary is not a solicitation to buy or sell.
WaveTalks - Market Whispers: Can you hear them?
-----------------------------------------------------------------------------------------------
Key Levels to Watch:
- Immediate Resistance: 23,000
What Unfolded Last Week:
The index retraced 600 points, making a low of 22,417 as expected pause below 23000 in
FLOKIUSDT is ready to lead the pack on a bullish journey! 🚀💎 Paradisers, #FLOKI has broken out of the Descending Channel and formed a 'W' pattern at the bullish Order Block (OB) level, which enhances the probability of a bullish move.
💎 If #FLOKIUSDT breaks above the resistance level, we can target the next resistance levels. Remember, we need a confirmed candle close above this level.
💎 In the case of a pullback, we can anticipate a bounce from the Bullish OB level. We might see a potential double or triple bottom pattern here, improving our risk-to
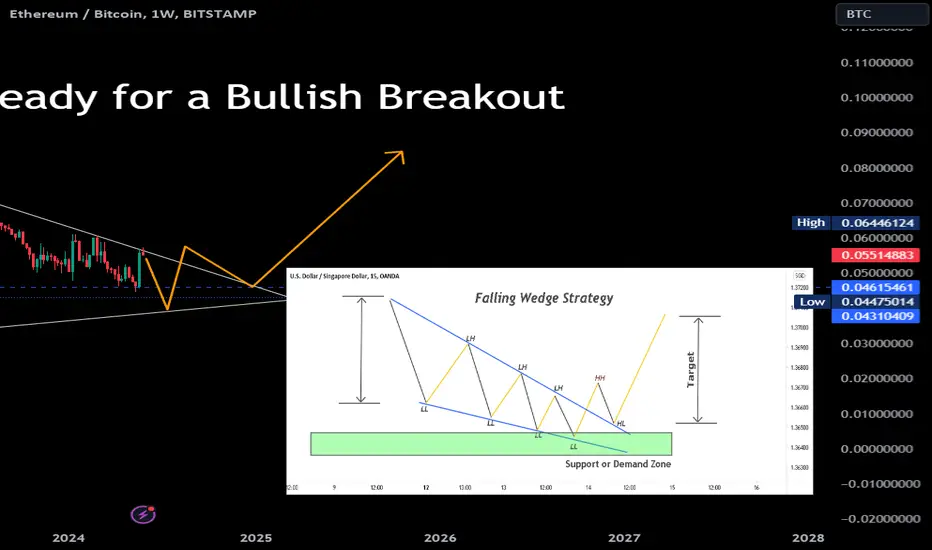
#ETH/BTC Analysis: Major Support Trendline and Falling Wedge Bre#ETH/BTC Analysis: Major Support Trendline and Falling Wedge Breakout
The 3ETH/BTC trading pair has been in a downtrend for the past 28 months, consistently forming lower highs and lower lows. However, recent price action indicates a potential reversal pattern that could signal the end of this prolonged bearish phase. Ethereum is currently taking support from a significant trendline and has formed a falling wedge, a bullish reversal pattern. Traders and investors are now eagerly awaiting a break
#ETH/BTC Falling Wedge: Ready for a Bullish Breakout#ETH/BTC Analysis: Major Support Trendline and Falling Wedge Breakout
The 3ETH/BTC trading pair has been in a downtrend for the past 28 months, consistently forming lower highs and lower lows. However, recent price action indicates a potential reversal pattern that could signal the end of this prolonged bearish phase. Ethereum is currently taking support from a significant trendline and has formed a falling wedge, a bullish reversal pattern. Traders and investors are now eagerly awaiting a break
Best swing trade idea on BATA INDIABATA INDIA has fallen 40% from highs !!
Stock has always given correction around 40 to 45% in past
Right now 40% correction is done and if stock fallen more 5% from hereon then support is coming around 1220-1260 levels.
Stock has broken its medium term support which was working from 2019
But stock is also making falling channel and it is working properly.
So if anyone is interested in a stock for a long term then should not of 5-6% correction from here and should start accumulating from
AMARA RAJA ENERGY & MOBILITY - Swing Trade Analysis - 9th March AMARA RAJA ENERGY & MOBILITY (1D TF) - Swing Trade Analysis given on 9th March, 2024
Pattern: FALLING WEDGE BREAKOUT
- Resistance Breakout - Done ✓
- Volume buildup at Resistance - Done ✓
- Demand Zone Retest & Consolidation - In Progress
#amararaja
HEG - Swing Trade - 20th May #stocksHEG (1D TF) - Swing Trade Analysis given on 20th May, 2024
Pattern: FALLING WEDGE BREAKOUT
- Trendline Resistance Breakout - Done ✓
- Volume Buildup at Resistance - In Progress
- Demand Zone Retest & Consolidation - In Progress
(Might come back to the Trendline for a Retest so be careful and do not enter in FOMO)
* Disclaimer
🚀 #AUDIOUSDT: W Pattern and Channel Break Could ignite rally💎 Paradisers, #AUDIOUSDT could present a bullish move if it confirms the 'W' pattern.
💎 If #AUDIO breaks above the resistance level, it will not only confirm the 'W' pattern but also signal the breakout of the descending channel, enhancing the probability of a bullish move.
💎 If the price shows a pullback, it could potentially form a triple bottom from the demand zone, so be cautious in this area.
💎 However, if the price breaks down below the demand zone, it will invalidate the bullish signs.
💥 VELOUSDT Momentum Build: Bullish Signs at HTF Demand!💎 Paradisers, #VELOUSDT has bounced from the Higher Time Frame (HTF) demand level, accompanied by a Fair Value Gap (FVG) candle and also shown Change of Character (CHoCH) towards a bullish market structure, increasing the likelihood of a bullish move.
💎 #VELO has also broken out of the falling wedge and shown bullish divergence on the MACD. If the price directly breaks the resistance level from here, it could present an opportunity to capitalize on the bullish move.
💎 If the price shows a pull
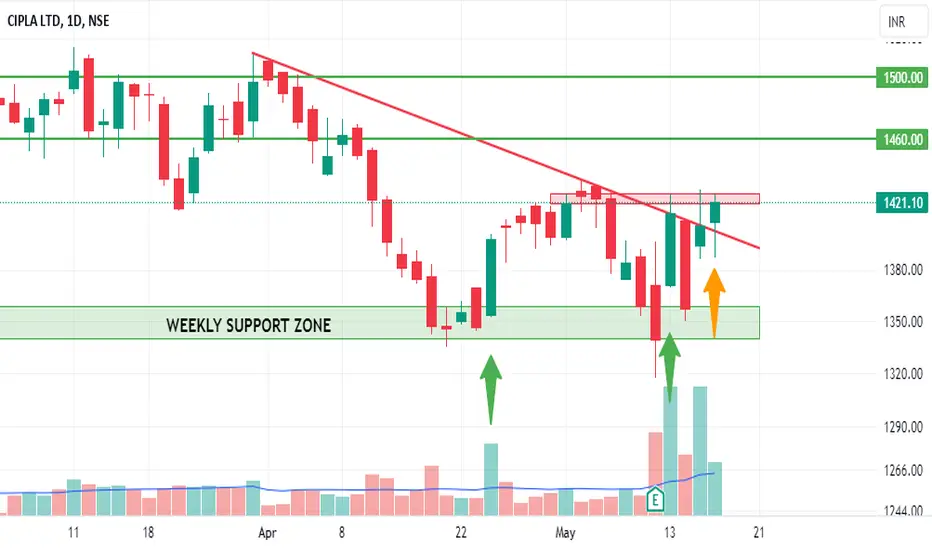
CIPLA - Swing Trade Analysis - 17th May #stocksCIPLA (1D TF) - Swing Trade Analysis given on 17th May, 2024
Pattern: FALLING WEDGE BREAKOUT (Double Bottom)
- Trendline Resistance Breakout - Done ✓
- Volume Buildup at Resistance - Done ✓
- Demand Zone Retest & Consolidation - In Progress
* Disclaimer
Nifty Explosive (Part 3): From 22,000 to 23,000 in Record Time!
Disclaimer:
Trading in financial markets involves substantial risks. Consult your financial advisor before making decisions. This commentary is not a solicitation to buy or sell.
WaveTalks - Market Whispers: Can you hear them?
-----------------------------------------------------------------------------------------------
Nifty Index Outlook - May 24, 2024
Overview
In our last analysis, we emphasized the importance of having both a primary plan (Plan A) and an alternative plan
US OIL WTI : Bullish - Falling wedges + inverse Head & ShouldersUS OIL WTI : Bullish - 2 falling wedges + Head&Shoulders
Wti crude oil can rise higher because of current geopolitical tensions. OPEC countries have reduced their daily production of barrels of oil.
Technically:
The wolf of Zurich has detected 2 "Falling wedges" and an " inverse head & shoulders" .
These chartist patterns could raise the price of WTI oil around 96$-98$ and even up to 106$ ;
However a divergence with their ROC ( Rate fo Change ) has been detected and we could go back down to t
USDT.D: Identifying a Falling Wedge#USDT Dominance (USDT.D) Analysis
#Current Technical Setup
**Timeframe**: 4-hour chart
**Patterns Observed**:
1. **Bullish Divergence**: USDT.D has formed a bullish divergence, indicating potential upward momentum. Bullish divergence occurs when the price makes lower lows, but the oscillator (such as RSI or MACD) makes higher lows, suggesting weakening downward momentum and a possible reversal to the upside.
2. **Falling Wedge**: The chart is currently forming a falling wedge pattern, a bulli