Wedge
๐ICP Breakout Alert: Get Ready for the Surge ๐๐ Paradisers, #ICP has broken out of a descending channel and formed an inverse head and shoulders pattern, increasing the likelihood of a bullish move.
๐ The candle has closed above the resistance level, but I am expecting a slight retracement to trap buyers. We can then anticipate a bullish movement from the Fair Value Gap (FVG) zone. Be cautious here and look for bullish signs.
๐ Price may also retrace from here and find support at the bullish Order Block (OB) level, after which we can expe
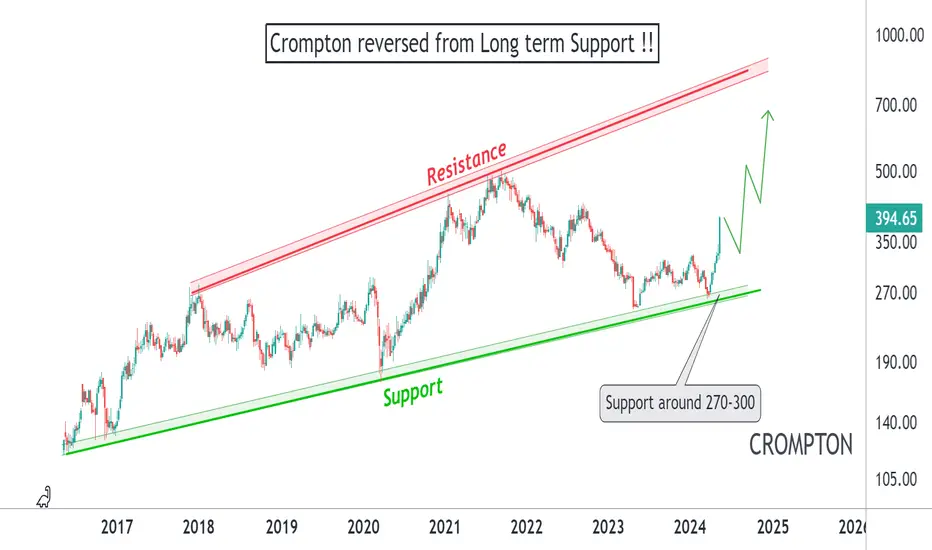
Crompton is going with momentum for More upsideCrompton has reversed from Long term Support !!
Stock always corretcs between 35-50% from highs
And give upside of 130-180%
So this time also from the lows that is from 270 levels we can expects stock to perform atleast 130-150%
Right now stock is in momentum and one can wait for correction and accumulate from lows.
Banknifty again becoming stealth bearishAfter the good support in my past 2 predictions. I am again becoming bearish for a quarter time period or so if BN breaks this current rising wedge bearish pattern. It can fall further down to 42150 in a gradual way (could be gapdowns or fall in a day). Before the election it can give good healthy correction thats what i believe in. Please only follow this if you can survive with the bounces. Need to constantly book the targets then sell on rise strategy works. Market may also further continue t
Nifty analysis - rising wedge bearish patternAccording to rising wedge bearish pattern. Nifty weak if not able to cross the upper trend line. Also up side momentum will be very slow for time being. Below i have stated upper levels with the help of fibo extension But if somehow it breaks the lower trend line. There will be fast moves after breaking the major support which is 22000. Bollinger band middle support is also 22000. It can also bounce from the major trend line support too. Like previously bounced 4th times. Likelihood of this time
๐ AI Breaks Out of Channel, Forms Bullish Cup and Handle!๐ Paradisers, #AI has broken out of the descending channel and formed a cup and handle pattern, which increases the likelihood of a bullish move.
๐ If #AIUSDT breaks above the resistance level, we can expect a bullish move up to the next resistance level.
๐ In the case of a pullback, we can anticipate a potential triple bottom pattern from the demand level, so be cautious here. It can provide a good risk-reward (RR) long setup from this point.
๐ However, in the case of a breakdown of the dema
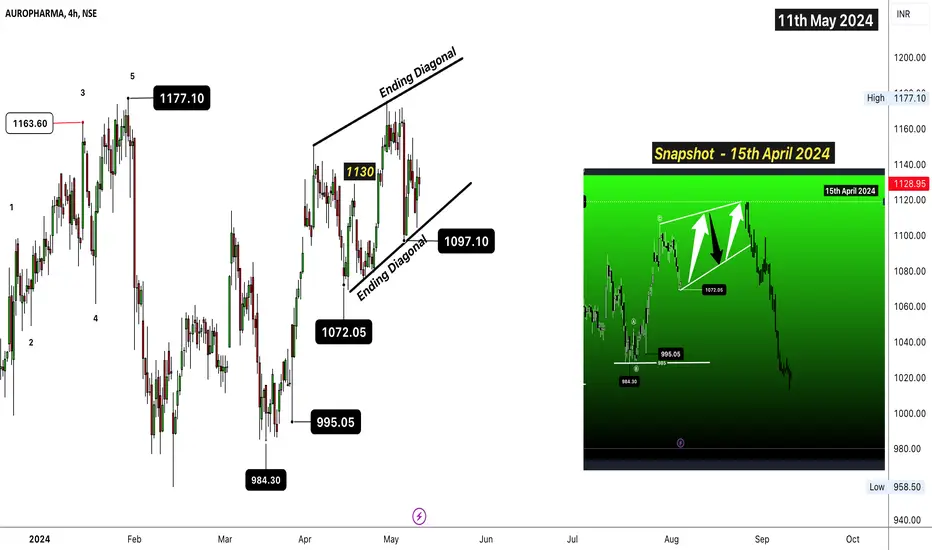
Auropharma - Can You Catch Wave Top ,Recognise This Pattern ? Elliott Wave is a such an amazing scientific method, if you apply them & be humble & open to what market tells you, you are going to be rewarded like catching all the waves.
Disclaimer:
Trading in financial markets involves substantial risks. Consult your financial advisor before making decisions. This commentary is not a solicitation to buy or sell.
WaveTalks - Market Whispers: Can you hear them?
From WaveTalks
Abhishek
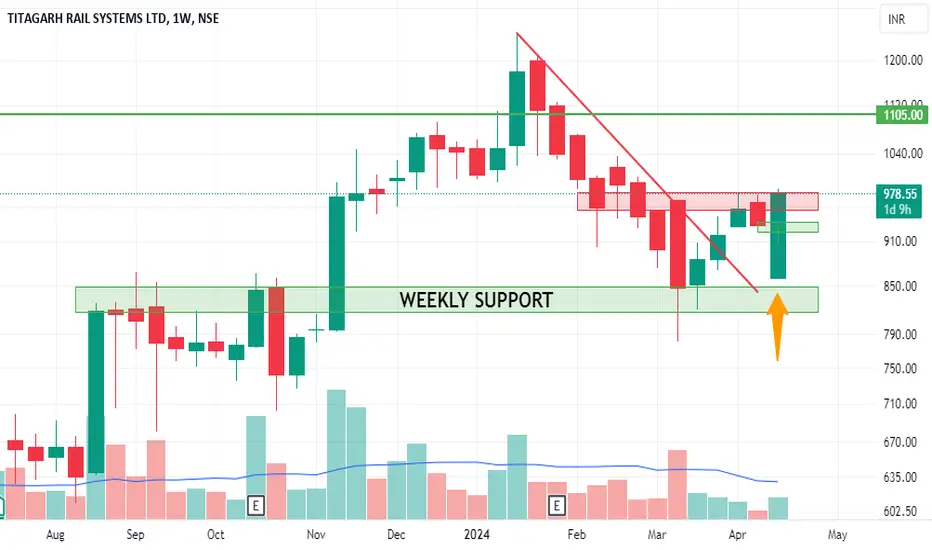
TITAGARH - Swing Trade Analysis - 18th April #stocksTITAGARH (1W TF) - Swing Trade Analysis given on 18th April, 2024
Pattern: FALLING WEDGE BREAKOUT
- Trendline Resistance Breakout - Done โ
- Volume buildup at Resistance - Done โ
- Demand Zone Retest & Consolidation - In Progress
#titagarh #indianrailways
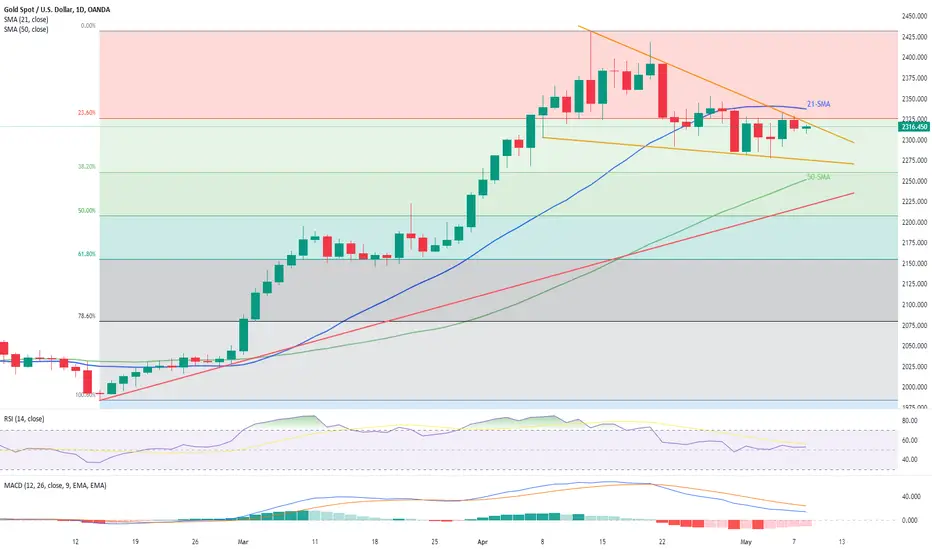
Gold keeps buyers in game despite recent inaction, $2,338 eyedGold price lacks bullish momentum despite staying positive on a weekly basis, after a two-week downtrend. While bearish MACD signals and a steady RSI (14) line suggest a continuation of the metalโs recent sideways performance, a one-month-old falling wedge bullish chart formation keeps the buyers hopeful. Itโs worth noting that the 21-SMA resistance of $2,338 will act as an extra filter toward the north, in addition to the stated wedgeโs upper line surrounding $2,322. Following that, the quoteโs
GShort
๐ Keep a close eye on the ARKUSDT๐ Paradisers, #ARK has formed a descending channel, and the price is potentially forming a double bottom after absorbing liquidity, which increases the bullish probability.
๐ We can expect a bounce from here due to the liquidity taken and the double bottom pattern, but we don't yet have a clear formation from the price.
๐ If the price breaks out of the descending channel and resistance level, we can target the next resistance levels.
๐ However, if the price breaks down below the demand zone,
DYDXUSDT is gearing up for a bullish ride! ๐๐ Paradisers, #DYDX has absorbed liquidity from the supportive trendline of the ascending channel, which increases the probability of a bullish move from here.
๐ It's also showing a Break of Structure (BOS) towards a bullish market structure and hasn't closed below the demand and Bullish Order Block (OB) zone, which demonstrates the strength of the bulls.
๐ If #DYDXUSDT breaks out of the resistive trendline, we can expect a bullish move to the next resistance levels.
๐ By taking liquidity fro
D